Transcription
SQL Server PerformanceAssessment andOptimization TechniquesJeffry A. SchwartzWindows TechnologySymposiumDecember 6, 2004Las Vegas, NVjeffstx3@frontiernet.net
Emphasis of PresentationInterpretation and usage of informativeperformance countersExpand upon PerfMon explanationsALL graphs of actual customer dataInsights acquired from analysis of manycustomer data setsPossible courses of actionSQL Profiler usage considerations2
OverviewSQL Server Measures many activities, but only certain ones can be traced to aspecific database None can be traced back to a specific query Sometimes need additional tools such as SQL Profiler (SQL Servertrace) to complete analysesMust monitor other performance objectsPresentation refers to SQL Server objects unless otherwisenoted3
OverviewMany PerfMon explanations uselessExample explanations SQL Compilations/sec is “Number of SQL compilations” Table Lock Escalations/sec is “The number of times locks ona table were escalated” Bulk Copy Rows/sec is “Number of rows bulk copied persecond”4
PerfMon Counter HierarchyThree-level hierarchyObjects at top levelCounters Comprise bottom level Always pertain to a particular objectInstance level added between object and counterlevels when necessary5
Object Hierarchy ExamplesProcessor object Æ Processor 0 instance Æ %Processor Time counterMemory object Æ Page writes/sec counter6
SQL Server ObjectsOne set per SQL Server instanceEach set divided into 17 categories4 memory-related2 lock-related7
SQL Server Objects7 measure database backup, replication, and usersettable categories Applicable to database backup and replication performance,as well as specifically defined and maintained user countersRest involve database transactions, log handling,and database access activities8
SQL Server Object ListSQL Server Objects9CategorySQL Server: Access MethodsDatabase accessSQL Server: Backup DeviceDatabase backupSQL Server: Buffer ManagerMemory managementSQL Server: Buffer PartitionMemory managementSQL Server: Cache ManagerMemory managementSQL Server: DatabasesTransactions & log handlingSQL Server: General StatisticsUser connectionsSQL Server: LatchesLockingSQL Server: LocksLockingSQL Server: Memory ManagerMemory management
SQL Server Object ListSQL Server Objects10CategorySQL Server: Replication AgentsDatabase replicationSQL Server: Replication Dist.Database replicationSQL Server: Replication LogreaderDatabase replicationSQL Server: Replication MergeDatabase replicationSQL Server: Replication SnapshotDatabase replicationSQL Server: SQL StatisticsSQL command activitiesSQL Server: User SettableUser defined
Buffer Manager and Buffer PartitionObjects21 counters5 involve Address Windowing Extensions (AWE)AWE covered indirectly11
Buffer Cache Hit RatioFrequency with which database read requests aresatisfied from database cache memory instead ofdiskHigher values result in lower disk usageRecommended value at least 90%Raw performance data can sometimes exceed100%12
Detecting Insufficient SQL MemoryCompare Memory Manager object’s Target ServerMemory (KB) with Total Server Memory (KB)countersIf Total less than Target, possibly insufficientmemoryIf comparison too small or Buffer Cache Hit Ratiois too low, allocate more memory to SQL Server,if possible13
SQL Server Only App and Single InstanceIf SQL Server only application on system andthere is only one instance, decisions may besimpler Reconfigure to use all of memory automatically, if notalready doing so and not using AWE Add more memory14
AWE and SQL Server Using All MemoryAutomaticallySetting SQL Server to use all memory has oftencaused problems when AWE used on Windows2000Can cause system to Exhaust Windows memory Page heavilyAWE-related tables hard to identify15
AWE and SQL Server Using All MemoryAutomaticallyScalability experts have stated that AWE-relatedtables consume more Windows memory as moreAWE memory locations accessed (at least onWindows 2000)Experience has shown this to be true16
AWE User Experiences #130 GB allocated to SQL Server on 32 GB system System paged heavily after user activity increased Little or no available memory for Windows Could not attribute Windows memory usage to a processReduced allocation to 28 GB Paging ceased Both system and SQL Server ran fine Buffer cache hit ratio hardly affected17
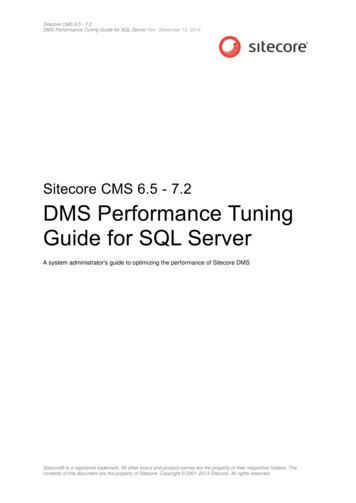
AWE User Experiences #2All but 65 MB allocated to SQL Server on 8 GB system System ran fine for several weeks, but available memory decreased veryslowlyFull text index creation executed System cache increased Index creation programs required own non-SQL memorySystem began to page heavily Little or no available memory for Windows System basically stopped functioning when available memory droppedbelow 4 MBSQL memory allocation reduced to insure 678 MB available –problems ceased permanently18
Available & Cache Memory19
SQL One of Many AppsDecisions much more complex if SQL Server NOT onlymajor application on computer or multiple instances existClassic system versus database conflict Allocating too much memory to SQL Server can harm otherapplications, SQL Server instances, or Windows, unless sufficientmemory can be addedNeed to match instance memory with businessrequirements20
Increasing SQL MemoryMake very gradual changesMonitor system Memory object counters beforeand after any changes Page writes/sec Available Bytes- Insure Windows 4 MB available memory limit impossible toreach, regardless of application activities21
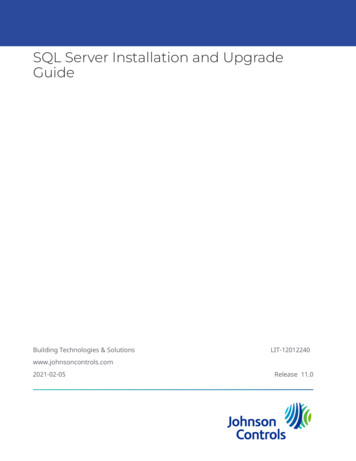
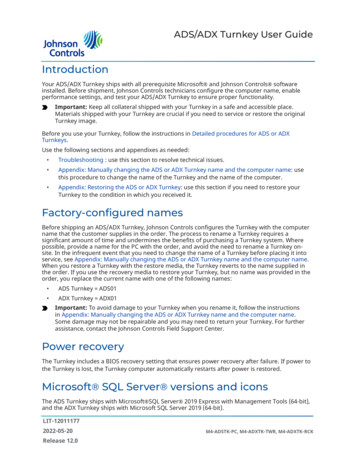
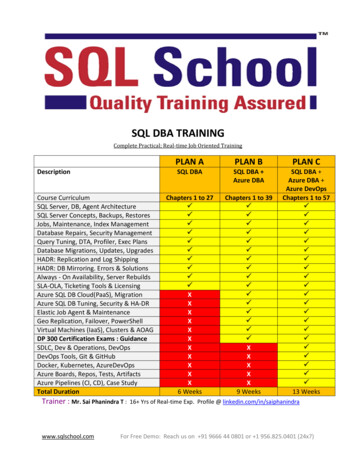
Free Pages CounterNumber of memory buffers available to receivedatabase pages read from diskIndicator of insufficient SQL Server memoryValues consistently close to zero indicate SQLServer memory shortageClosely associated with Free list stalls/sec22
FreeList Stalls CounterFrequency with which requests for availabledatabase pages are suspended because nobuffers are availableFree list stall rates of 3 or 4 per second indicatetoo little SQL memory available23
FreeList Stalls Graph24
Stolen Pages CounterPages “stolen” when Windows requires memoryfor another applicationUseful indicator of overall system memoryshortageShort periods may be normalExample: system backup begins after largedatabase batch run completes25
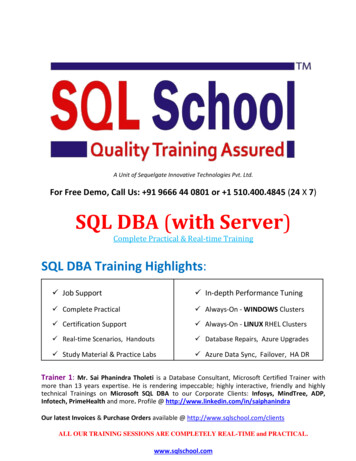
Database I/O CountersPage Reads/sec and Page Writes/sec countersMeasures physical I/Os, not logical I/OsMay indicate Insufficient database memory Applications improperly accessing database Improper database table implementation26
I/O Activity Graph27
Page Lookups/sec CounterMeasures number of times database attempted tofind a page in buffer poolLogical readUseful for corroborating and further quantifyingbuffer cache hit ratioCompare Page Reads/sec with Page lookups/sec28
Buffer Cache Hit Ratio - RevisitedCan perform computation when more precisionnecessary, e.g., 30 of 32 GB allocated to SQL1 – (Page reads/sec / Page lookups/sec)29
Page Lookups Graph30
Memory Manager ObjectCounters can be used to develop SQL Servermemory composition graph Connection Memory (KB) Granted Workspace Memory (KB) Lock Memory (KB) Optimizer Memory (KB) SQL Cache Memory (KB)Monitor lock blocks31
Access Methods ObjectMost helpful counters Forwarded Records/sec Full Scans/sec Index Searches/sec Range Scans/sec Table Lock Escalations/sec32
Forwarded RecordsOnly occur in tables without clustered indices, i.e., heapsOccur when row/record moved from one database page toanother because changed record cannot fit back in originalpage Image data, i.e., bitmap data Variable-length string dataMost frequently occur in Tempdb33
Forwarded RecordsCreates de facto physical linear search, whichcan cause long record access times and highpage read ratesAdding clustered index is simplest way toeliminate problem Use as few data columns as possibleOtherwise, create records that are large enoughto accommodate changes34
Detecting Forwarded RecordsTwo ways to determine total count of forwarded records in a tableEnable trace flag 2509 and execute DBCC CHECKTABLEcommand as shown below DBCC TRACEON (2509) GO DBCC CHECKTABLE ( table name )ORExecute DBCC SHOWCONTIG using TABLERESULTS option asshown below DBCC SHOWCONTIG ( table name ) WITH TABLERESULTS35
Forwarded Records/secMeasures # of records fetched via forwardedrecord pointersSince forward record “chains” are prevented bySQL Server, counter refers to actual record count,not number of pointer “chases”36
Forwarded Records Graph37
Full ScansUnrestricted linear searches through table or indexExample SQL statement SELECT * FROM TABLETHATISAHEAPSQL Query Estimated Execution Plan can identify themahead of timeSQL Query Actual Execution Plan and SQL Profiler (trace)can identify them when they occurTrace records contain logical reads and writes38
Access Method Graph39
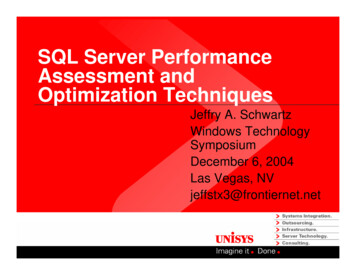
I/O Activity vs. Access MethodsDirect graphical comparison of these entities is very helpfulShows whether physical and logical linear searches, i.e.,forwarded records and full scans, result in physical I/Os orare completely satisfied from memoryMany linear searches can be against very short tables thatare always in memoryComparison distinguishes relatively harmless ones fromthose that impact the I/O subsystem40
SQL Server I/O, Forwarded Record, & FullScan Graph41
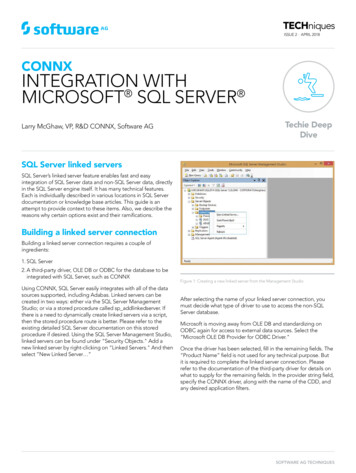
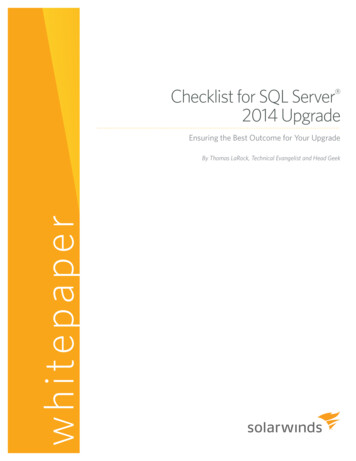
Locks ObjectOne of the most important objectsNumber of Deadlocks/sec criticalSQL Profiler can provide information about howdeadlock was createdLock Timeouts/sec also critical # of lock requests that exceed maximum specified wait time Monitors each type of lock42
Lock Types/InstancesItem43DescriptionDatabaseEntire databaseExtentContiguous group of 8 data pages or index pagesKeyRow lock within indexPage8-kilobyte (KB) data page or index pageRIDRow ID. Used to lock single row within tableTableEntire table, including all data & indices
Lock Timeouts Graph44
Other Lock CountersAverage Wait Time (ms) Measures average time each lock request was forced to waitUseful to sum these to prevent averages from disguisingproblems Calculate percentage of interval spent waitingLock Waits/sec Records how often lock requests waitedTrace duration filter does not apply to lock timeouts45
Total Lock Wait Times46
Lock EscalationsRow, key, or page locks automatically escalated to coarsertable locks as appropriate Single table lock acquired Many lower level locks releasedRecorded in Table Lock Escalations/secLock Owner Blocks Allocated and Lock Blocks Allocatedcan be used to validate that applications hold too manylocks for too long47
Table Lock Escalations48
Lock Block & Lock Block Owners Graph49
LatchesLatches Lightweight, short-term synchronization objects Protect action that need not need be locked for life oftransaction50
Latch Object CountersCounters Average Latch Wait Time (ms) Latch Waits/sec Total Latch Wait Time (ms)51
Avg. Latch Wait Time (ms) CounterLarge values, e.g., greater than one second Indicate large number of physical I/Os or long I/O times Check following counters- Page Reads/sec and Page Writes/sec- System PhysicalDisk object, especially Avg. Disk Sec/Transfer Often coincide with low buffer cache hit ratios52
% Disk Times & Queue Lengths% Disk Times useless because they are simplyrestatements of queue lengths using percent formatPerfmon constrains these to 100%Queue lengths can no longer be interpreted as mostWindows performance books suggest, i.e., disk is in troublewhen queue length 2Queue lengths of 14 or more are common, even on wellperforming I/O subsystems53
Physical I/O MeasurementsOnly I/O time is measured directlyDisk driver provides I/O times to WindowsDue to driver’s location in I/O path I/O time service time queue timeMay not be possible to improve large servicetimes due to physical or financial constraints54
Large SQL Server I/OsBeginning with Service Pack 3, SQL Server can generatevery large I/Os, e.g., larger than 65,535 bytes131,070 byte and larger I/Os have been observed (seeExample #3)HBAs can be saturated fairly quickly under theseconditionsI/O service times can cause I/O times to be high even ifqueuing does not occur55
I/O Time CalculationsImportant to know whether queuing is causinglarge I/O timesUse Little’s Law to compute missing statistics56
Little’s LawN X*R N average # customers at a service center X program completion rate R average elapsed time57
Using Little’s Law to Compute Missing I/ORelated TimesAll calculations use PhysicalDisk countersDisk Utilization 100 - % Idle TimeDisk service time Disk Utilization / DiskTransfers/secDisk queue time Avg. Disk sec/Transfer - Diskservice time58
RAID Example Calculations #1Disk Utilization 36.57%Disk Transfers/sec 0.65Avg. Disk sec/Transfer 2.0095Disk service time .3657 / 0.65 0.563 secondsor 563 millisecondsDisk queue time 2.0095 – 0.563 1.447 secondsor 1,447 millisecondsBytes/Transfer 1,30759
RAID Example Calculations #2Disk Utilization 77.67%Disk Transfers/sec 30.89Avg. Disk sec/Transfer 2.4424Disk service time .7767 / 30.89 0.025 secondsor 25 millisecondsDisk queue time 2.4424 – 0.025 2.4174seconds or 2,4174 millisecondsBytes/Transfer 22,43760
RAID Example 1 vs. 2I/O times are not that far apart despite beingoutrageously highQueuing being encountered for both disksLow I/O rate of Disk #1 appears to contribute tohigh service times 1,307 bytes should not require 563 ms61
RAID Example 1 vs. 2Disk #2 is doing much more work Utilization is double I/O size is 17 times larger Service time is much more reasonable @ 25 msProblems began when faster processor complexattachedSolution was to reconfigure EMC drives62
RAID Example Calculations #3Disk Utilization 99.59%Disk Transfers/sec 58.2Avg. Disk sec/Transfer 0.7678Disk service time 0.9959 / 58.2 0.0171 secondsor 17.1 millisecondsDisk queue time 0.7678 – 0.0171 0.7507seconds or 750.7 millisecondsBytes/Transfer 168,53663
RAID Example #3 Discussion100% utilization is suspicious, but RAID may befunctioning well enough In this case, it obviously is not17 ms service times are good consideringaverage I/O sizeQueuing is the problemDrives comprising disk were clearly saturated64
RAID Example #3 DiscussionAnother disk processed 143.7 I/Os per second @7.8 ms per I/OQueue time was 2.1 msService time was 5.7 ms28,786 Bytes/TransferWhen all disks were combined, HBA was at thelimitSolution was to add drives and HBAs65
SQL Statement HandlingBatch Group of SQL statements Possibly hundreds or thousands of lines Must be parsed and compiled into an optimized executionplanCompilation and parsing can be Quite resource intensive Time-consuming66
SQL Statistics ObjectMost important counters Batch Requests/sec SQL Compilations/sec SQL Re-Compilations/secUse with Cache Manager object Cache Hit Ratiocounter67
Batch Requests/secNumber of select, insert, and delete statementsEach of these statements triggers a batch event,which causes counter to be incrementedNote: This includes each of these statement typesthat are executed within a stored procedure68
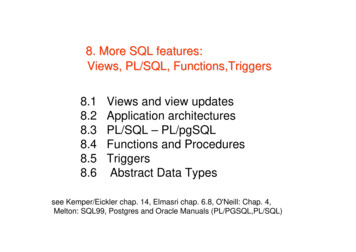
SQL Server Connection AffinityDocumented in Q299641Batch Requests/sec can be compared with System ContextSwitches/sec counter to highlight need for SQL ServerConnection AffinityNetwork packet comparison with System ContextSwitches/sec counter also usefulProcessor % DPC Time counter can also be useful in thisendeavor69
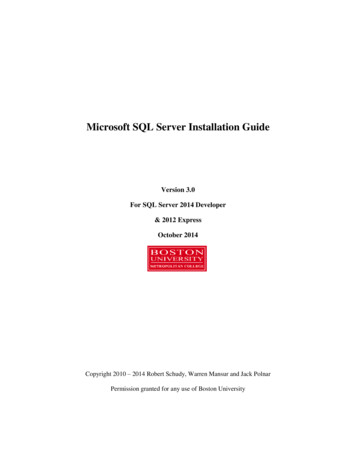
Connection Affinity ExampleBatch requests/sec correspond almost exactlywith System Context Switches/secNetwork packet traffic also almost perfectlymatches System Context Switches/secProcessor DPC activities correspond closely aswell70
Batch Requests vs. Context Switching Graph71
Network Card Packet Traffic & ContextSwitches Graph72
Processor Overview Graph73
Stored Procedure CompilationAllows batch to be parsed and compiled onlyonce (hopefully)Execution plan cached & re-used unless Removed from cache Execution plan invalidated because of database changesIf stored procedure requested after removal orinvalidation, it is recompiled74
Cache Manager ObjectMonitors various execution-related entities and their re-use Prepared SQL plans Procedure plans Trigger plans Normalized treesUsed in SQL statement, stored procedure and triggercompilation, optimization, and execution75
Cache Hit RatioMost importantShould be 90% or higherLower values Indicate too many ad-hoc queries Often associated with higher values of- SQL Compilations/sec (SQL Statistics object)- SQL Re-Compilations/sec76
GuidelinesSQL Compilations/sec should be less than 40% ofBatch Requests/secHigh compilation rates frequently Correspond with lower Cache Manager cache hit ratios Indicate lack of stored procedure usage Indicate possible memory shortage77
General Statistics ObjectUseful in capacity planning situationsLogins/secLogouts/secUser ConnectionsUseful in calculating work per user or connection78
Databases ObjectEach database is a performance counter instanceLog and transaction counters most important79
LogDatabase journalUsed for recoveryChanges written here before databaseCan dramatically hinder database performance ifplaced on busy diskShould be on own disk volume Minimizes disk head movement80
Log Flush Wait Time CounterMeasures total time database commits waited forlog flushesObviously, should be small81
Average Log Write Waiting Times Graph82
Potentially Confusing Log CountersLog Flushes/sec measures number of log buffersflushed to diskLog Flush Waits/sec measures number of flushesthat had to wait Seems like an ideal numberWaits should be subset of total? Unfortunately, only in some cases83
Recovery ModelsFull Recovery Every database change logged Recover to last complete transactionBulk-logged Bulk operations minimally logged Recover to end of transaction log backupSimple Recover to last database backupWaits a subset of Total only for Simple model, which isused least in production84
Other Database CountersTransactions/sec counter indicates whichdatabases updated most frequentlyParticularly important because all Tempdbtransactions are monitored85
TempdbContains all temporary disk tables andworkspacesOveruse can significantly hinder scalabilityCan become major bottleneckUse creatively designed queries to reduceTempdb activity86
Table VariablesMore efficient than pure tablesUnfortunately, still use Tempdb as other temporary tablesdoObviously, spreading Tempdb across several physicaldisks helps performanceNot so obviously, increasing number of physical Tempdbfiles can reduce file access bottleneck, especially if Tempdbhit very hard87
Database Transaction Volumes Graph88
Other Database CountersBulk Copy Throughput/sec Useful for monitoring efficiency and frequency of flat file loads intodatabase tablesBulk copies/inserts can easily cause table escalation andlockingExtremely efficient method for mass data loadsShould be infrequent during online day89
StatisticsComputed for tables and indicesEnables query optimizationCan be expensive to create or update depending uponsample size and frequencyMay want to update these manually during off-peak timesinstead of using automatic defaultsDBCC Logical Scan Bytes/sec useful for detecting whenstatistics recalculated90
StatisticsSet on by default in TempdbApplication Sentinel SQL Optimizer detects thisVarious options can be used to control impact of statisticsupdate or recreation FULLSCAN SAMPLE n PERCENT or ROWS RESAMPLE ALL or COLUMNS or INDEX91
Database Size CountersLog File(s) Size (KB)Data File(s) Size (KB)Log File(s) Used Size (KB)Percent Log UsedLog GrowthsLog TruncationsLog Shrinks92
Database Size CountersUseful for determining Volatility of log files Frequency of database and log expansion Overall sizes of databases and their logsMinimize frequency of database and logexpansions93
SQL ProfilerBad reputation as a resource hog and performance killerneed not be deservedExcessive resource consumption caused by Requesting entities that are changed constantly, e.g., locks andscans Not using duration filter Requesting too many entitiesUpdating GUI on monitored machine94
EventsEntities that are monitoredCareful use of templates can greatly reduceresource consumptionUnfortunately, duration filter does not controlLock:Timeout event logging Most records returned will be zero durationLock:Deadlock and Lock:Deadlock Timeout stillvaluable events95
Starting EventsFollowing events usually unnecessary becausestart time can be calculated from ending recordsusing duration Stored Procedures event class- SP:Starting, SP:StmtStarting, RPC:Starting T-SQL event class- SQL:BatchStarting, SQL:StmtStarting96
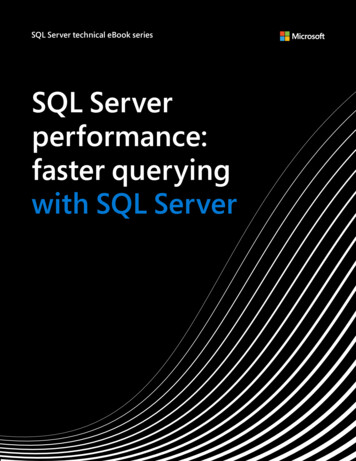
Other EventsPerformance events Potentially very useful Execution Plan, Show Plan All, Show Plan Statistics, and ShowPlan Text difficult to decipherErrors and Warnings events Extremely useful for highlighting inefficient sorts, missing statistics,inefficient joins Low overhead97
Warnings SummaryDatabase IDEvent NameEvent SubClass NameInteger DataCount1Sort WarningsSingle pass3546Sort WarningsSingle pass9,0066Sort WarningsMultiple pass1,32363Hash WarningHash recursion054063Hash WarningHash recursion1665Hash WarningHash recursion021967Hash WarningHash recursion01,062611Hash WarningHash recursion027,477Sort WarningsSingle pass898Object ID153
sp trace Instead of ProfilerMost efficient to use sp trace commands tocapture trace information because no GUIinvolvedBetter than using remote Profiler becausesession does not restart after networkinterruption99
sp trace Commandssp trace create defines a trace, but does not start itsp trace setevent “adds or removes an event or eventcolumn to a trace”sp trace setfilter “applies a filter to a trace”sp trace setstatus “modifies the current state of thespecified trace,” e.g., starts or stops trace100
sp traceCan be used to “sample” trace data instead ofcontinuously capturing data Collect for a few minutes and then stop Restart collection at some future pointUseful on high-volume systems where any tracingcould be noticedJob can be set up to implement this101
Using SQL Server to Analyze TracesTraces can be imported easily into a SQL Server databaseusing T-SQL commands SQL ProfilerStored Procedures can be used to Summarize data Replace numeric IDs with meaningful text Locate offending queries Join trace data with other performance data102
ConclusionsMany performance counters available with SQLServerSeveral have useful descriptions associated withthem, but many do notMost objects and counters pertain to SQL Serveras an entity without regard to a specific user,query, or database103
ConclusionsWhen complex applications access multipledatabases under one SQL Server instance,PerfMon counters alone do not provide enoughinformationExtremely important to combine SQL Serverperformance information with systemperformance information, especially processor,memory, and I/O104
ConclusionsSQL Query and SQL Profiler both provideextremely useful insights into how specificdatabases, queries, transactions, batches, andstored procedures perform105
ConclusionsMany analysts believe that SQL Profiler cannot be runagainst a production system without severely damagingperformanceThis need not be true!Lightweight Profiler templates or trace T-SQL routines canbe used to gather very specific and inexpensive informationregularly106
ConclusionsSQL Trace output can be imported into a SQLServer database for fast and easy analysisOnce specific queries or stored procedures havebeen identified as offenders, additional data canbe gathered for just those entities107
ReferencesKalen Delaney, Inside Microsoft SQL Server 2000Mark Friedman and Odysseas Pentakalos,Windows 2000 Performance GuideMicrosoft SQL Server 2000 Books Online108
ReferencesEdward Whalen, Marcilina Garcia, Steve DeLuca,and Dean Thompson, Microsoft SQL Server 2000Performance Tuning109
SQL Server: Replication Snapshot Database replication SQL Server: SQL Statistics SQL command activities SQL Server: User Settable User defined. 11 . Lock Types/Instances Item Description Database Entire database Extent Contiguous group of 8 data pages or index pages Key Row lock within index