Transcription
Table of ContentsPreface2Chapter 1: Trading Basics3Chapter 2: Basic Tools4Chapter 3: ADX6Chapter 4: Accumulation Line8Chapter 5: Average True Range10Chapter 6: Candlesticks13Chapter 7: MACD17Chapter 8: Moving Averages19Chapter 9: Keltner Channel20Chapter 10: Putting It Together22
PrefaceThere are thousands of traders that aspire to become successful day traders and unfortunately, theoverwhelmingly vast majority fails to succeed. I have found most of these unsuccessful traders tend todo the same wrong things. It is the goal of this book to share my knowledge to help you become a bettertrader.Packed in these pages are trading principles that I have long followed and refined over many years. Theindicators discussed in this book are widely accepted trading indicators. While I tend to put a twist onthe strategies (typically trying to do the opposite of what most people would do), there are no guaranteesexpressed or implied by this book. These are for educational purposes for you, the reader.These indicators are a tool to aid you in your decision making process and hopefully through this bookand future installments I can share my philosophy on trading. My philosophy is very simple: mosttraders lose money because they tend to do the same things. It is fundamental human behavior.Short Term Trading Secrets2Chapter 1: Trading BasicsThere is a substantial risk of loss in futures and options trading. Past performance is not necessarily indicative of futureresults. The use of a stop loss order may not necessarily limit your loss to the intended amount.
Chapter 1: Trading BasicsOver the years I have heard statistics on the percentage of traders that are successful. Usually thisnumber varies, but it is common for people to throw out a number that 5-15% of traders are successful.This implies that 85-95% of traders are unsuccessful and losing money.There is no concrete number of the success rate, but I think those numbers, even the 5%, are optimistic.To be successful, in my view, is to have longevity and not just make money in one month or one year.To make a profit one month or one year does not make one “successful”. If your plan is destined to fail atsome point in the future, then it is not a successful plan.Discipline is a pre-requisite for any successful endeavor. Even traders that trade discretionarily, from“the seat of their pants” have some form of discipline. They know when to cut their losses and they knowwhat rules to follow to exit the trade.You must have a similar plan for your trading. Getting into the market is only half the strategy; the mostimportant part is when to exit. I have long held that you can simply flip a coin (heads you buy; tails yousell) and enter the market with a 50/50 chance of knowing the day’s direction. But with proper disciplineto exit the position, you could actually become a successful trader. It is not just entering the market, butexiting the market that is just as important.Some traders will analyze the markets in depth, execute a trade, see a quick 100 profit and take it. Theirrationale might be “I just made 100 in 30 seconds. Let it dip back down 2 minutes from now and I’lljust get back in.” And then the market slips away from them because it never bounces back so they canre-enter at the original price. They took a 100 profit from the markets, but left potentially thousands onthe table.Short Term Trading Secrets3Chapter 1: Trading BasicsThere is a substantial risk of loss in futures and options trading. Past performance is not necessarily indicative of futureresults. The use of a stop loss order may not necessarily limit your loss to the intended amount.
Chapter 2: What to TradeI have long favored the futures and futures options for short-term trading for the following reasons:Liquidity: the E-Mini S&P 500 is currently trading near 1200. Each point represents 50and therefore the contract represents approximately 60,000 of notional value (1200 x 50). Most days it will trade over two million contracts per day. This represents over 120billion dollars a day of stock value. And this is just one of the stock futures contracts. Ittrades more value than all the stock exchanges combined.Further, the spreads are extremely tight – spreads are typically 0.25 which is only 12.50.If we were to trade stocks, and we were to trade 3,000 shares of a 20 stock (to obtain thesame 60,000 leverage) with a spread of 0.01 that is 30, almost 2.5 times the spread of theE-Mini S&P 500. The tighter the spread, the more liquidity, and the less money you aregiving to the markets when you utilize stop loss orders.Market hours: the E-Mini S&P 500 trades virtually 23 ½ hours per day. You can formulatean opinion on the market for the next 2-3 days and have opportunity to capitalize it whenthe other financial markets are closed. This opens the door to situations where you mightbe bullish the market and during the night session the market is down 5 or 6 points and itallows you an opportunity to enter at a better price – a price that may no longer exist whenthe New York stock market opens in the morning.Tax considerations: the tax rate on short-term futures transactions is a blended tax ratecomposed of long-term and short-term capital gains. Since short-term gains are taxed atthe highest tax rate, if you day trade stocks and show a profit, you are subject to the highesttax rate. If you trade futures, you are subject to a blended rate of long-term and short-termgains putting more money in your pocket. Specifically, 40% of your profit is charged atthe long-term capital gains rate which today is only 15%. The other 60% of your profit ischarged at the short-term gains rate. This is a substantial tax savings for the serious daytrader. As with any business transaction with tax consequences, you should speak to yourtax advisor for specific details.Short Term Trading Secrets4Chapter 2: What to TradeThere is a substantial risk of loss in futures and options trading. Past performance is not necessarily indicative of futureresults. The use of a stop loss order may not necessarily limit your loss to the intended amount.
To begin trading futures, I recommend that you start with 25,000 or more to invest.The reason why I recommend 25,000 is that is affords you the flexibility to dollar cost averageyour short-term trades. If you have only a few thousand dollars then you do not have the ability toincrementally add to your position to average your price.In the book, all indicators and snapshots are from the Firetip trading platform. (www.firetip.com). Irecommend using the Firetip platform because it is a comprehensive day trading system – it has all ofyour quotes, charts, news, and account information at your fingertips. You can use any trading platformthat you desire but many brokers offer Firetip and it does everything discussed in this book.5Short Term Trading SecretsChapter 2: What to TradeThere is a substantial risk of loss in futures and options trading. Past performance is not necessarily indicative of futureresults. The use of a stop loss order may not necessarily limit your loss to the intended amount.
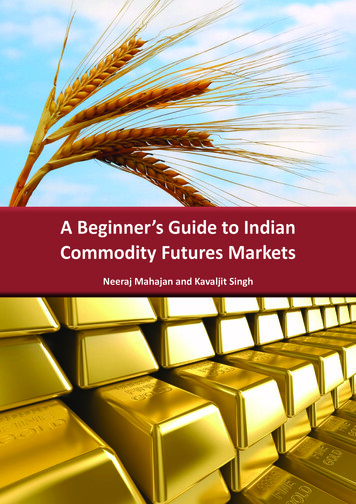
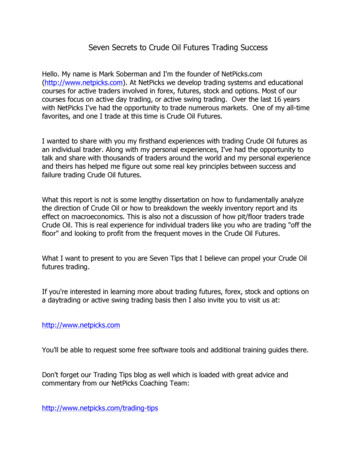
Chapter 3: Our First Indicator: ADXThe ADX indicator stands for “Average Directional Index”. The ADX indicator measures the strengthof a trend. This indicator can be useful to determine whether a trend is weak or strong. High readingsindicate a strong trend, while low readings indicate a weak trend.If the ADX is between 0 and 25, then the market is in a trading range. The when ADX begins to moveup, and gets above 25, the beginning of a trend will be visible to you at this point. Big up or down movestend to occur around this point. Remember, the ADX is a reflection of “strength”, it does not tell you thedirection. We need to look at the chart to get a sense of the direction.There are two ways to use the ADX:When the ADX is rising from a low level and gets above 30, then the market is showing astrong trend. We will generally want to trade with this trend.If the ADX falls to 20 or lower, then we can reasonably believe the market is now in atrading range and we can trade the ranges.Trading is an art and not a science, so you do not want to mechanize the idea that “if ADX gets to 30.01, Iwill go with the trend and if it is below 20 then I will trade the ranges”.Here are some additional concepts for ADX:Watch the strength of the increase in ADX from below 20 to 30 . If it slowly moves from20 to 30, then it is not as strong of a trend as if ADX jumped from 20 to 35 very quickly.The first move to 30 in Figure 1 [Point A] illustrates this.In our example [Point A], while the ADX never moved over 30 officially, it would havebeen perfectly acceptable if you went long the E-Mini S&P in anticipation of a rally.Remember, trading is not an exact science, so buying in anticipation of the move up(especially since it was showing some strength) would have been acceptable.However, when the next few bars showed that the market was not gaining momentum andlosing stream (ADX was unable to break above 30), you should have6Short Term Trading SecretsChapter 3: Our First Indicator: ADXThere is a substantial risk of loss in futures and options trading. Past performance is not necessarily indicative of futureresults. The use of a stop loss order may not necessarily limit your loss to the intended amount.
exited the trade for a small loss or gain.Be wary of news driven events. Trading before and after the news is very risky. We do notwant to rely on the ADX (or any other indicator) when there is news. In Figure 1 [PointD], we illustrate the March Unemployment number that came out and its impact on ADX.This would have been easy to avoid as you should have known what economic reportswould coming out and thus you should have avoided trading into the report.In Figure 1 [Points B & C] we show two healthy moves in the market that resulted afterthe ADX moved to 30 . These are the type of ADX moves you should be looking for andtrading off of.Short Term Trading Secrets7Chapter 3: Our First Indicator: ADXThere is a substantial risk of loss in futures and options trading. Past performance is not necessarily indicative of futureresults. The use of a stop loss order may not necessarily limit your loss to the intended amount.
Chapter 4: Accumulation LineOne of the most popular volume indicators is the Accumulation line. The premise behind theAccumulation line is that volume precedes price. Volume reflects the amount of contracts that aretraded in a particular market and therefore is a direct reflection of the money flowing into and out of thesecurity.Volume or money flow indicators are designed to identify early increases in positive or negative volumeflow to gain an edge before the price moves. By using the Accumulation line as a volume indicator, thiswill help to determine if the volume in a security is increasing on the advances or declines. Also, theAccumulation line can be used to gauge the general flow of money. An uptrend indicates that buyingpressure is prevailing, and a downtrend would therefore indicate that selling pressure is prevailing.Short Term Trading Secrets8Chapter 4: Accumulation LineThere is a substantial risk of loss in futures and options trading. Past performance is not necessarily indicative of futureresults. The use of a stop loss order may not necessarily limit your loss to the intended amount.
The accumulation indicator is best used on a longer term time frame (minimum 30minute chart). This is because we have little desire to change our opinion of the marketdue to short-term accumulations or distributions in the market. If we know that a largeinstitutional customer has purchased a substantial number of contracts over a five orten minute time frame, we have no idea if there are more purchases looming or if thosecontracts will hit the market (sells) in the next hour or day. For this reason, this indicatorhas little to no value for me on a short-term (3-15 minute) chart.This is an effective tool to watch on a 30 or 60 minute chart.Short Term Trading Secrets9Chapter 4: Accumulation LineThere is a substantial risk of loss in futures and options trading. Past performance is not necessarily indicative of futureresults. The use of a stop loss order may not necessarily limit your loss to the intended amount.
Chapter 5: Average True RangeThe average true range is a technical indicator that is based on trading ranges. The range of a trading baris its high minus its low. The average true range determines a security’s volatility over a given time. Theaverage true range is the moving range of the true range for a certain given period. We use the defaultsmoothing value of “14” in our example.The true range is the greatest of the following:The difference between the current high and the current lowThe difference between the current high and the previous closeThe difference between the current low and the previous closeThe average true range is then calculated by taking an average of the true ranges over a set number ofprevious periods.Short Term Trading Secrets10Chapter 5: Average True RangeThere is a substantial risk of loss in futures and options trading. Past performance is not necessarily indicative of futureresults. The use of a stop loss order may not necessarily limit your loss to the intended amount.
One important aspect of day trading is determining when the market is in a “tradingrange” or in a “trend”. Look for changes in the Average True Range to isolate when themarket may be expanding its trading ranges (meaning there is an imbalance between buyerand seller) and a subsequent move (up or down) may be in the works.The average true range will not tell us if the market is going up or down, but it will give usa good idea on market imbalance so we can determine our trading strategy (do we go withthe trend? Or do we trade against the trend?)If we believe that the market is in a trading range, we are more apt to sell rallies and buydips. A viable strategy for a trading range market would be to accumulate contracts as themarket drops and selling those contracts into an anticipated rally later in the day.If, however, our indication is that the market is poised to trend and move in a consistentdirection, then we will want to position ourselves for the trend and add contracts goingwith the trend as the market moves in our favor.With Firetip, you have the added feature of adding a Moving Average to any of theindicators. In Figure 4, I add a 10 bar moving average and “Smooth” the Average TrueRange. Now we can see (Figure 5) when the moving average starts to turn up that themarket is getting more volatile and when it is turning down, the market is calming down.Short Term Trading Secrets11Chapter 5: Average True RangeThere is a substantial risk of loss in futures and options trading. Past performance is not necessarily indicative of futureresults. The use of a stop loss order may not necessarily limit your loss to the intended amount.
Look for changes in the direction of Average True Range. Use a 3-minute or 5-minutechart to help pinpoint these changes.Short Term Trading Secrets12Chapter 5: Average True RangeThere is a substantial risk of loss in futures and options trading. Past performance is not necessarily indicative of futureresults. The use of a stop loss order may not necessarily limit your loss to the intended amount.
CandlesticksCandlestick patterns have become an extremely popular source and one of the most widely studiedmeans of identifying the current state of price action. A candlestick pattern is simply a way of readingdata on the chart. Here are the top candlestick patterns that traders universally agree on and use:Stomach Reversal:Doji: When the opening and closing price are essentially the same, the candlestick formedresembles a plus sign, cross, or inverted cross and is referred to as Doji. It represents indecision on thepart of the market, and is interpreted by traders that a turning point is imminent.Engulfing Pattern:Evening Star: Commonly regarded as a bearish reversal pattern, this three-day patternconsists of a long white body, followed by a smaller gap up candlestick, with the third and final dayclosing below the midpoint of the first day.Short Term Trading Secrets13Chapter 6: CandlesticksThere is a substantial risk of loss in futures and options trading. Past performance is not necessarily indicative of futureresults. The use of a stop loss order may not necessarily limit your loss to the intended amount.
Evening Star: When trading occurs significantly below the open, but ends well above thelow and closes as its high, the candlestick formed has only one tail below its body. When this formationoccurs during a downtrend, it often signals a reversal.Hanging Man: Identical to the Hammer, this candlestick pattern occurs during anuptrend, and signals a continuation of the price movement.Harami: This is a simple two day candlestick pattern that has a relatively small body on thesecond day that is completely surpassed on both sides by the previous day’s candlestick and is always ofthe opposite color. It usually occurs during a minor correction in a bear or bull market and signals thatthis temporary uptrend or downtrend is reaching an end, and the underlying trend will continue. It isespecially considered a strong indicator when it appears together with low trading volume.Morning Star: This formation is considered a three day bullish reversal pattern thatconsists of a long bodied black first day, a short gap down second day, followed by a third long whitebodied candle, which closes above the midpoint of the first day.Morning Star: This formation is considered a three day bullish reversal pattern thatconsists of a long bodied black first day, a short gap down second day, followed by a third long whitebodied candle, which closes above the midpoint of the first day.Short Term Trading Secrets14Chapter 6: CandlesticksThere is a substantial risk of loss in futures and options trading. Past performance is not necessarily indicative of futureresults. The use of a stop loss order may not necessarily limit your loss to the intended amount.
Shooting Star: The opposite of the Hammer, this is a one-day formation and occurs inan uptrend. Trading opens higher and trades much higher but prices end near the low. This pattern isviewed as a bearish reversal.One benefit of Firetip in trading Candlestick is that Firetip can do all of the work for you to find thesesignals. If you are bearish and looking for a sell entry and there is a bearish Stomach Reversal or bearishEngulfing Pattern, you can let Firetip monitor the chart for you and inform you when a pattern has beenachieved.Figure 6 shows a chart with various bullish Candlestick patterns. In Firetip, simply click the greenup-arrow and it will tell you what candlestick pattern it has recognized. Note that we are usingcandlesticks on a 30-minute chart. I recommend using them on short-term (3-minute & 5-minute) aswell as longer-term (30 & 60 minute) charts.Short Term Trading Secrets15Chapter 6: CandlesticksThere is a substantial risk of loss in futures and options trading. Past performance is not necessarily indicative of futureresults. The use of a stop loss order may not necessarily limit your loss to the intended amount.
Figure 7 shows a chart with various bearish Candlestick patterns:Short Term Trading Secrets16Chapter 6: CandlesticksThere is a substantial risk of loss in futures and options trading. Past performance is not necessarily indicative of futureresults. The use of a stop loss order may not necessarily limit your loss to the intended amount.
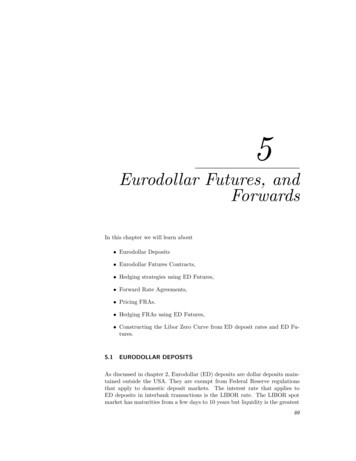
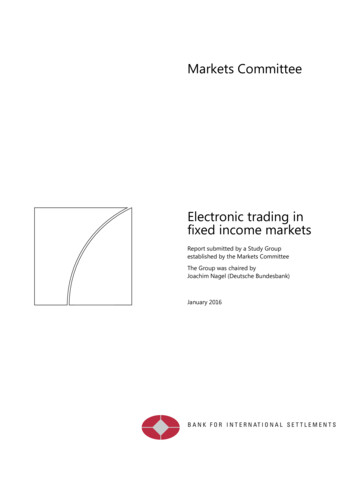
Chapter 7: MACDMACD stands for Moving Average Convergence/Divergence, and is a technical analysis indicator. MACDshows the difference between a fast and slow exponential moving average of closing prices. The standardperiods are 12 and 26 days.There are a few ways to use the MACD. One popular (and common) way is to buy the instrument beingcharted when the fast line crosses the slow line. Unfortunately this is somewhat of a lagging indicator(basically similar to a moving average cross-over) and only works if you are confident that a trend isestablished and is going to continue for a while.My preferred method is to follow the MACD histogram. Follow the trend of the MACD histogram whenthe histogram is away from the zero line. Go with the trend of the histogram assuming it has trended inone direction for the last 3 histogram bars.Let me explain in other words using Figure 8 as an example. On the first signal [Point A], we see that thehistogram is at -200 but it starts to trend higher. In fact, there are 3 bars where the MACD histogram isincreasing. This is a buy. A good time to exit is when the histogram moves 1 bar in the wrong direction[Point B].This is most effective the further away MACD is from zero because this tends to indicatean established trend and it is my view that trends generally follow trends.Do not try to trade contrary to a substantial trend. While this would have worked andappears to be have profitable on [Point D], this would have been a risky move to “fight thetrend”, especially such a strong trend. Good day traders will fight the trends all the time,but not the strongest move a market has made in a week.We must learn to tweak the “3 bar” rule. If you find it is generating many false signals,then change it to whatever is working given the market conditions (for example, requiring4 or 5 bars to follow the same direction). This is part of the discipline of day trading. Usewhat is working for the market conditions today.Short Term Trading Secrets17Chapter 7: MACDThere is a substantial risk of loss in futures and options trading. Past performance is not necessarily indicative of futureresults. The use of a stop loss order may not necessarily limit your loss to the intended amount.
Short Term Trading Secrets18Chapter 7: MACDThere is a substantial risk of loss in futures and options trading. Past performance is not necessarily indicative of futureresults. The use of a stop loss order may not necessarily limit your loss to the intended amount.
Chapter 8: Moving AveragesMoving averages are the most popular and easiest trading tool to use. The two most common types ofmoving averages are the Simple Moving Average (SMA) and the Exponential Moving Average (EMA). Asimple moving average is formed by computing the average price of a security over a specified number ofperiods. Most moving averages are created using the closing price. For example: a 10 day simple movingaverage is calculated by adding the closing prices for the last 10 days and dividing the total by 10. TheEMA’s apply more weight to recent prices relative to older prices. The shorter the EMA’s period, the moreweight that will be applied to the most recent price.Moving averages give an easy reference to market conditions. You can glance at the chart,so a rising moving average and conclude that the market has recently staged a rally. Thedistance that the prices are from the moving average help identify the strength of therecent movement.The moving averages are there to help you formulate the view of the market. Do not try totrade off the moving average.Short Term Trading Secrets19Chapter 8: Moving AveragesThere is a substantial risk of loss in futures and options trading. Past performance is not necessarily indicative of futureresults. The use of a stop loss order may not necessarily limit your loss to the intended amount.
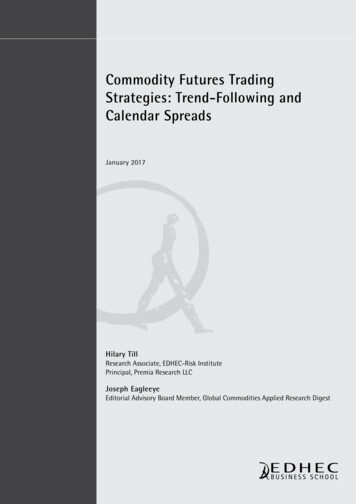
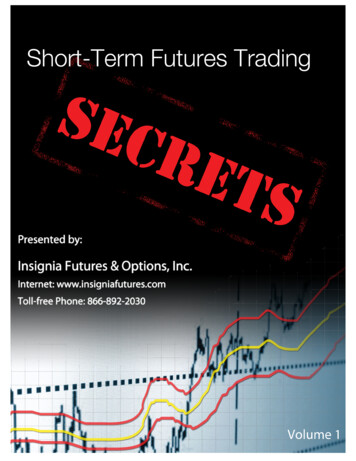
Chapter 9: Keltner ChannelThis indicator is the heart and soul of my trading methodology. The Keltner provides an updatingmoving average of recent price history (the yellow line in Figure 10) along with price bands (red lines).The Keltner is value to me in that it provides a visual representation of market movements and enablesyou to confidently trade a market like the S&P 500.When using the Keltner, the first thing we want to do is identify the trend of the market. The Kelnter willhelp us determine which direction the market is trending or, if it is not trending, what the bands are forthe trading range.First, watch for market movements as they react to the red price bands. If prices are trading abovethe red price band, then the market is bullish. You should look to buy the market on a slight pullback.Conversely, if prices are trading below the lower red price band, it indicates a weak market and youshould look to sell a small rally.If prices are not reaching either of the two red price bands, then it means that the market is in a tradingrange and you can sell the market as it approaches the upper band and buy when it approaches thebottom.In Figure 11, note that prices have breached the upper red price band at [Point A]. This gives us anindication that the market is bullish. Subsequently, we would seek to go long the S&P 500 as pricespulled back. I like to use the yellow center line (the moving average) as a reference point. Since themarket rallied decisively above the upper red price band, I would now want to watch how the marketreacts to the yellow moving average and accordingly look to buy. This is illustrated at [Point B]. Basedupon this methodology, we would have bought at point (B).Again, we would have triggered another buy (meaning the rally is continuing) at [Point C]. The marketremains bullish and we should still look to buy. A good place to buy would have been [Point D].Note that the trade at [Point C] produced either a small gain or a small loss as the market essentiallylanguished for the next few hours.Short Term Trading Secrets20Chapter 9: Keltner ChannelThere is a substantial risk of loss in futures and options trading. Past performance is not necessarily indicative of futureresults. The use of a stop loss order may not necessarily limit your loss to the intended amount.
As the market has been unable to break the red price bands from 07:00 AM (PT) to 09:00 AM (PT), itwould have been prudent that this time to trade the ranges – buying on dips and selling rallies.This methodology and the Keltner are not to be mechanized. You need to incorporate some commonsense trading discipline and use the other indicators to come up with a confluence of indicators. If theKeltner is rallying above the upper red price band, and the ADX is showing that a trend is established,then you need to look for your buy entry point.Short Term Trading Secrets21Chapter 9: Keltner ChannelThere is a substantial risk of loss in futures and options trading. Past performance is not necessarily indicative of futureresults. The use of a stop loss order may not necessarily limit your loss to the intended amount.
Chapter 10: Putting It TogetherThere are a few common sense caveats when it comes to trading:Do not trade minutes before or after news. If you are trading into a news story you arebetting on the news report and not on your trading tools and experience.Understand the impact of news: Markets tend to be very choppy in the minutes after anannouncement, so it is best to avoid trading at that time. But understand that if the newswas significant, there may be an established trend that will last for hours or days postannouncement.Before news is announced, markets tend to be quieter and range bound. Since everyoneis waiting for the news to be announced nobody is making major shifts in their positions.You can use this to your advantage by trading the ranges in the market before majorannouncements.Always use a stop loss. In Firetip, you can place “Bracket Orders”. A bracket order is anorder where you set your profit target and your stop loss at the same time. It doesn’t matterif you decide to use a 500 stop per contract or a 100 stop. But pick a stop that you arecomfortable with and that fits with your trading time frame. If you plan to hold a trade for10 minutes, then a 100 stop is adequate. If you intend to hold the trade for 3 days thenmaybe you need a 750 stop.The liquidity of the E-Mini S&P 500 is very good such that you should always use a stop.You can always re-enter the market one second after your stop is hit. But trading withouta stop can cause devastating losses when the markets are volatile. Likewise, you can putmarket volatility to your advantage and set a target limit order (hence, my suggestion touse the “Bracket Order”). If the market gets to your limit price, fills your order, and thenretreats you will have made the profit. You can put volatility to your advantage by having atarget order ready.Please trade from a longer-term time horizon. Do not place a trade with the intent that it will last threeminutes or ten minutes. This is very hard to do. You limit yourself to small profits and smallShort Term Trading Secrets22Chapter 10: Putting It TogetherThere is a substantial risk of loss in futures and options trading. Past performance is not necessarily indicative of futureresults. The use of a stop loss order may not necessarily limit your loss to the intended amount.
losses. It is hard to be successful making a few dollars at a time.The best methodology is to formulate an opinion of the market for the next two or three trading days. Ifyou think about it, the fund managers that move these markets are not looking to get in and get out in afew minutes. They are planning to deploy their capital over a period of a few days. And it is these biggermovements that will make you more money. You might only stay in the position for an hour or threehours, but at least you have enough of a time horizon that short-term movements won’t impact yourtrade.One reason I recommend starting with a larger capital position ( 25,000 or more) is so that you can scaleinto a trade. Since it is difficult to time the exact second or minute to enter a long or short position, I findit more appealing to be able to enter the market gradually over a thirty minute or one hour window andbuild up my position in anticipa
Short Term Trading Secrets Chapter 1: Trading Basics Preface There is a substantial risk of loss in futures and options trading. Past performance is not necessarily indicative of future . recommend using the Firetip platform because it is a comprehensive day trading system - it has all of your quotes, charts, news, and account information .