Transcription
Luo Health Inf Sci Syst (2015) 3:3DOI 10.1186/s13755-015-0011-0Open AccessSOFTWAREMLBCD: a machine learning tool for bigclinical dataGang Luo*AbstractBackground: Predictive modeling is fundamental for extracting value from large clinical data sets, or “big clinicaldata,” advancing clinical research, and improving healthcare. Machine learning is a powerful approach to predictivemodeling. Two factors make machine learning challenging for healthcare researchers. First, before training a machinelearning model, the values of one or more model parameters called hyper-parameters must typically be specified.Due to their inexperience with machine learning, it is hard for healthcare researchers to choose an appropriatealgorithm and hyper-parameter values. Second, many clinical data are stored in a special format. These data must beiteratively transformed into the relational table format before conducting predictive modeling. This transformation istime-consuming and requires computing expertise.Methods: This paper presents our vision for and design of MLBCD (Machine Learning for Big Clinical Data), a newsoftware system aiming to address these challenges and facilitate building machine learning predictive models usingbig clinical data.Results: The paper describes MLBCD’s design in detail.Conclusions: By making machine learning accessible to healthcare researchers, MLBCD will open the use of big clinical data and increase the ability to foster biomedical discovery and improve care.Keywords: Machine learning, Big clinical data, Automatic algorithm selection, Automatic hyper-parameter valueselection, Entity–Attribute–Value, PivotBackgroundThe healthcare industry collects large amounts of clinicaldata from diverse sources including electronic medicalrecords, sensors, and mobile devices. These large clinicaldata sets, or “big clinical data,” provide opportunities toadvance clinical care and biomedical research. Predictive analytics leverage these large, heterogeneous datasets to further knowledge and foster discovery. Predictivemodeling can facilitate appropriate and timely care byforecasting an individual’s health risk, clinical course, oroutcome. Approaches to predictive modeling include statistical methods such as logistic regression and machinelearning methods that improve automatically throughexperience [1], such as support vector machine, neuralnetwork, decision tree, and random forest. Compared to*Correspondence: gangluo@cs.wisc.eduDepartment of Biomedical Informatics, University of Utah, Suite 140, 421Wakara Way, Salt Lake City, UT 84108, USAstatistical methods, machine learning can increase prediction accuracy, sometimes doubling it, with less strictassumptions, e.g., on data distribution [2–4].Two major aspects of machine learning require significant computing expertise and are poorly supportedby existing machine learning software such as Weka [5],RapidMiner, R, and KNIME [6], making machine learning inaccessible to many healthcare researchers who useclinical data to do research [7–9]. First, before a machinelearning model can be trained, an algorithm and hyperparameter values must be chosen. An example hyperparameter is the number of hidden layers in a neuralnetwork. The chosen algorithm and hyper-parameter values can have a large impact on the resulting model’s performance, sometimes changing accuracy from 1 to 95 %[8]. Selecting an effective algorithm and hyper-parametervalues is currently an art, which requires deep machinelearning knowledge as well as repeated trials. It has been 2015 Luo. This article is distributed under the terms of the Creative Commons Attribution 4.0 International License (http://creativecommons.org/licenses/by/4.0/), which permits unrestricted use, distribution, and reproduction in any medium, providedyou give appropriate credit to the original author(s) and the source, provide a link to the Creative Commons license, and indicateif changes were made. The Creative Commons Public Domain Dedication waiver ) applies to the data made available in this article, unless otherwise stated.
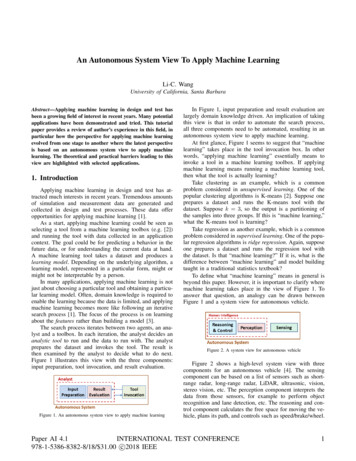
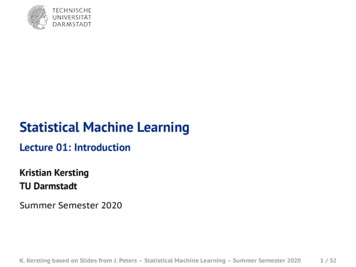
Luo Health Inf Sci Syst (2015) 3:3widely recognized that this is beyond the ability of layman users with limited computing expertise, and alsofrequently a non-trivial task even for machine learningexperts [7, 8, 10–12]. Emerging evidence suggests thatautomatic search methods for the optimal algorithmand hyper-parameter values can achieve equally goodor better results than careful manual tuning by machinelearning experts [10, 13]. However, when a large varietyof algorithms is considered, prior efforts such as AutoWEKA [8], hyperopt-sklearn [13], and MLbase [7, 14]cannot quickly determine the optimal algorithm andhyper-parameter values for a large data set, limiting theirusefulness in practice.A major obstacle to automatic search is that a long timeis needed to examine a combination of an algorithm andhyper-parameter values on the entire data set. Whendetermining an optimal combination, prior efforts atautomation examine many combinations on the entiredata set. On a data set with a modest number of datainstances and attributes, such as several thousand rowsand several dozen attributes, this can last several days[8]. In practical applications, search time can be hundreds or thousands of times longer for three reasons: (1)The process of conducting machine learning is iterative.If a particular set of clinical parameters yields low prediction accuracy, the analyst will probably look at otherunused, available clinical parameters that may be predictive. A new search is required for each iteration. (2)A data set can consist of many data instances, e.g., fromseveral healthcare systems. (3) A data set can includemany attributes, like those extracted from textual and/or genomic data. The execution time of a machine learning algorithm typically grows at least linearly with thenumber of attributes and superlinearly with the numberof data instances. Many predictive modeling problemsmust be resolved for numerous diseases and outcomes toattain personalized medicine. Search time will become abottleneck at this point, irrespective of whether it createsan issue for a predictive modeling problem.The second aspect is related to the data extraction required before data analysis. Many clinical dataare stored in the Entity-Attribute-Value (EAV) format(see Fig. 1) [15]. Examples of electronic medical record(EMR) systems using the EAV format include the CernerPage 2 of 19Powerchart EMR [16], Regenstrief EMR [17], Intermountain Healthcare’s HELP EMR [18], TMR EMR [19], andColumbia-Presbyterian EMR [20]. Examples of clinicalstudy data management systems using the EAV formatinclude Oracle Clinical [21], Clintrial [22], TrialDB [23],i2b2 (Informatics for Integrating Biology and the Bedside), REDCap, OpenClinica, LabKey, and Opal [24, 25].A large portion of patient-generated health data, such asthose from home health equipment, in personal healthrecords, or from mobile apps, is stored in the EAV format [26]. Even in an enterprise clinical data warehousedesigned to provide data ready for analysis, some of thelargest tables (e.g., the fact tables) still use the EAV format [27, 28]. In the OMOP (Observational Medical Outcomes Partnership) [29] and PCORnet (the NationalPatient-Centered Clinical Research Network) CommonData Models [30] and i2b2 data mart schema [31], someof the largest tables (e.g., observation, diagnosis, procedure, and lab result) use the EAV format.The EAV data model uses tables with at least three columns: the entity, attribute, and value. Usually, the entitycolumn identifies a clinical event and can be regarded asa patient ID and date/time stamp pair [27, page 58]. Theattribute column identifies a clinical parameter. The valuecolumn contains the clinical parameter’s value. In thisway, an EAV table combines many clinical parametersand their values in the attribute and value columns.Before performing predictive modeling, EAV datamust be transformed by pivot operations into relationaltable formats (see Fig. 1), with each clinical parameterof interest occupying its own column. Pivoting is oftenperformed repeatedly, as machine learning is an iterative process. Since healthcare researchers with limitedcomputing expertise are known to have difficulty writing complex database queries [32], each round of pivoting requires work from a computing professional,which creates dependencies and consumes significanttime and computing resources. Traditional pivotingtechniques often require repeatedly processing largeclinical data sets and/or performing multiple joinoperations [33–35], either of which is computationallyexpensive.New approaches are needed to enable healthcareresearchers to build machine learning predictive modelsFig. 1 Pivot to obtain the columns for the three clinical parameters ‘test 1,’ ‘test 2,’ and ‘test 3’
Luo Health Inf Sci Syst (2015) 3:3on big clinical data efficiently and independently. To fillthe gap, we present in this paper the design of a newsoftware system called MLBCD (Machine Learningfor Big Clinical Data) supporting the whole process ofiterative machine learning on big clinical data, including clinical parameter extraction, feature construction,machine learning algorithm and hyper-parameter selection, model building, and model evaluation. MLBCD canbe used once the researcher has defined the study population and research question, has obtained the clinicaldata set, and has finished data preparation [36] includingcleaning and filling in missing values. For clinical data,filling in missing values usually requires applying medical knowledge, and therefore is unsuitable for completeautomation.This work makes the following innovativecontributions:1. We present the first software supporting the wholeprocess of iterative machine learning on big clinical data, from clinical parameter extraction to modelevaluation. Currently no such software exists.2. We present a new method to provide a solution toa long-standing open problem in machine learning that has been widely recognized in the literature[7, 11, 12, 14]. Our method efficiently (in less time)and automatically searches for the optimal machinelearning algorithm and hyper-parameter values for agiven machine learning problem. Existing automaticsearch methods are inefficient. Our method uses sampling to search for the optimal algorithm and hyperparameter values concurrently. This has never beendone before. Our method uses new techniques suchas handling high-performance and low-performancecombinations of hyper-parameter values in differentways. With proper extensions, these techniques canbe used for handling other problems in stochasticoptimization.3. We present the first implementation method of efficient pivoting techniques using the MapReduceframework [37] for distributed computing. Pivot operations are essential for analyzing clinical data, but arenot supported by existing big data software for distributed computing such as Hadoop [38] and Spark [39].4. MLBCD offers new features tailored to healthcareresearchers’ needs, such as the options of producingonly interpretable models, specifying forced inclusion of a subset of input variables in the model, anddisplaying the used input variables in descendingorder of importance with cumulative impact on prediction accuracy. Existing machine learning softwaresystems are not tailored to healthcare researchers’needs.Page 3 of 19MethodsMLBCD integrates techniques of fast pivoting, visualquery building, efficient and automatic selection ofmachine learning algorithms and hyper-parameter values, and scalable machine learning. It provides an intuitive graphical user interface for each step of the analyticalprocess and can run on a cluster of commodity computers for scalable parallel processing. MLBCD uses a newmethod for efficiently and automatically searching for theoptimal machine learning algorithm and hyper-parameter values for a given machine learning problem. MLBCDalso provides the first implementation of efficient pivoting techniques using the MapReduce framework [37] fordistributed computing.After obtaining EAV data containing potentially predictive clinical parameters, MLBCD can be used to performfast iterative machine learning. For example, hundredsof thousands of clinical parameters exist in an EMR [27,page 56]. An analyst typically starts the analytical processfrom a few clinical parameters such as lab tests. With theEAV tables containing all lab tests and their result values,the analyst can use MLBCD to iteratively add more labtests for analysis until satisfactory prediction accuracy isreached.Results and discussionThis part of the paper is organized as follows. “Existingbig data software” provides some background on existing big data software relevant to MLBCD. “The design ofMLBCD” presents the design of MLBCD. “An automaticselection method for machine learning algorithms andhyper-parameter values” describes the efficient and automatic selection method for machine learning algorithmsand hyper-parameter values used in MLBCD. “Evaluationplan” mentions our evaluation plan for MLBCD. “Relatedwork” discusses related work.Existing big data softwareIn this section, we provide some background on existing big data software relevant to MLBCD. Modern bigdata software for distributed computing is developed tosupport large-scale data-intensive applications not handled well by parallel relational database systems. Thesebig data software systems typically run on a cluster ofcommodity computers, borrow many techniques fromparallel relational database systems, and provide newfunctions beyond those supported by parallel relationaldatabase systems.Hadoop [38] and Spark [39] are two widely used,open source, big data software systems. Hadoop implements Google’s MapReduce framework [37] for distributed computing using the Map and Reduce functions.The Map function converts an input element into zero
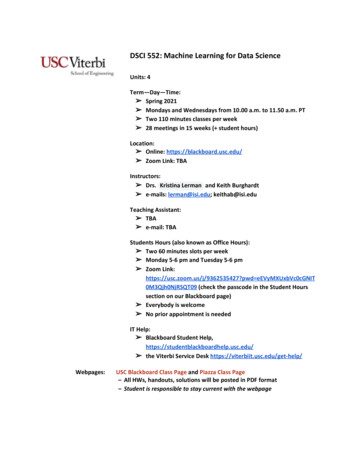
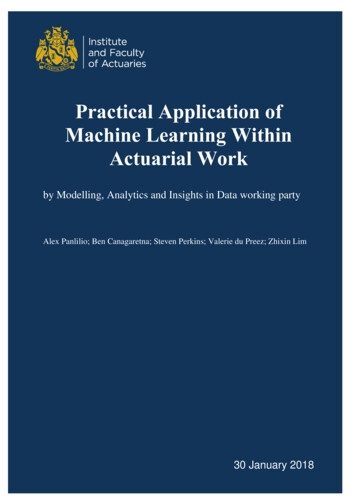
Luo Health Inf Sci Syst (2015) 3:3or more key-value pairs. The Reduce function convertsa key and its list of associated values into zero or morekey-value pairs that can be of another type. Data arestored in the Hadoop distributed file system, the opensource implementation of Google’s BigTable file system[40]. Hadoop is unsuitable for iterative and interactivejobs, as job execution usually requires repeated readingand writing of data from and to disk, incurring significantoverhead [39]. Structured Query Language (SQL) is thestandard query language for relational database systems.SQL’s declarative nature allows easier programming thanby low level Map and Reduce functions. Hive [41] is asoftware system supporting a large portion of SQL on topof Hadoop.To overcome Hadoop’s shortcomings, Spark [39] wasdeveloped on top of the Hadoop distributed file system.To improve performance, Spark executes most operations in memory and avoids disk inputs/outputs whenpossible. Like Hadoop, Spark supports the MapReduceframework. Spark SQL [42, 43] is a software system supporting many relational operators, a large portion ofSQL, and other functions on top of Spark. MLlib [7, 44,45] is Spark’s machine learning library. Spark can runSQL queries at a speed comparable to parallel relationaldatabase systems and up to 100 times faster than Hive,and iterative machine learning algorithms 100 timesfaster than Hadoop [42]. Neither Spark SQL nor Hivesupports the pivot operator. MLBCD is developed usingSpark, Spark SQL, MLlib, and new techniques to addressexisting software’s limitations.The design of MLBCDIn this section, we present the design of MLBCD. During iterative machine learning on big clinical data, threesequential steps are executed repeatedly. First, a set ofclinical parameters is extracted from EAV data into relational table formats by pivoting. Second, raw clinicalparameters are transformed to construct features, a.k.a.input variables or independent variables, of the predictivemodels to be built. This step is optional and often doneby executing SQL queries. If this step is omitted, rawclinical parameters will be the input variables of the predictive models to be built. Third, one or more predictivemodels are built on the current set of clinical parametersand evaluated. If model performance is unsatisfactory,the analyst can add more clinical parameters and restartfrom the first step.MLBCD covers all three steps and supports the wholeprocess of iterative machine learning on big clinical data.MLBCD provides a separate intuitive graphical userinterface for each step. At any time, the user can moveeasily between the three steps at will. MLBCD uses Sparkas its basis for distributed computing, allowing it to runPage 4 of 19on a single computer as well as on a cluster of commodity computers for parallel processing. As detailed below,MLBCD is built using the open source software systemsSpark, Spark SQL, MLlib, and SQLeo [46], each of whicheither supports a Java application programming interfaceor is written in Java. MLBCD is written mainly in Java soit can call the functions in and interface with these software systems. Figure 2 shows MLBCD’s architecture. Inthe following, we describe the software component foreach of the three steps.Step 1: Clinical parameter extractionIn the first step, MLBCD performs pivoting on Spark toextract desired clinical parameters. The pivot operatoris currently not supported by Spark SQL, nor well supported by existing large-scale relational database systems.We use the MapReduce framework [37] to support thepivot operator on Spark and implement three efficientpivoting techniques that we have developed in Luo andFrey [33]. The first technique performs early removalof EAV tuples related to unneeded clinical parameters.The second technique facilitates pivoting across severalEAV tables. The third technique supports multi-queryoptimization.Our techniques fit well with MapReduce by formingone key-value pair per EAV tuple in the Map function.The key is the entity column of the EAV tuple. The valueis the combination of the attribute and value columns ofthe EAV tuple. In the Map function, EAV tuples relatedto unneeded clinical parameters are filtered out early on[33]. The Reduce function combines all relevant EAVtuples with the same entity value from one or more EAVtables into a relational tuple. The Reduce function canwrite to multiple files for each record processed [38, 41],supporting multi-query optimization.To let users with limited computing expertise avoidwriting SQL-like statements for pivoting, MLBCD provides an intuitive graphical user interface to guide usersthrough the pivoting process. In MLBCD’s input interface, the user specifies sequentially (a) the EAV data’sstorage location, such as the name of a comma-separated values (CSV) file in the local file system, a file inthe Hadoop distributed file system, or an EAV tablein a relational database; (b) the fields of the EAV dataFig. 2 Architecture of MLBCD
Luo Health Inf Sci Syst (2015) 3:3corresponding to the entity, attribute, and value columns,respectively; and (c) desired clinical parameters. Whenever possible, the user will input by selecting from a listor navigating a directory of items rather than typing.After the user provides inputs and clicks “Extract clinicalparameters”, MLBCD automatically loads the EAV datainto Spark, then extracts the specified clinical parametersinto relational table formats using the pivot operator onSpark. By default, the extracted relational data are storedin Spark’s default persistent storage space, the Hadoopdistributed file system. In MLBCD’s input interface, theuser can optionally modify the storage location of therelational data to be extracted, e.g., if the user wants toexport the relational data as a CSV file for use by otherprograms.As mentioned in Luo and Frey [33], there are three possible cases of pivoting: (a) pivoting on a single EAV tableto generate a relational table; (b) pivoting across severalEAV tables to generate a relational table from data scattered across them; and (c) performing multiple pivotoperations on the same EAV table or across the same setof EAV tables to generate multiple relational tables simultaneously. MLBCD’s input interface includes one tab foreach case. After completing pivoting, MLBCD displays inits output interface the first few tuples in each relationaltable generated. This can help the user ensure that pivoting has been done properly.Some clinical data such as patient demographics arestored in the relational table format. MLBCD provides anintuitive graphical user interface to allow importing relational data, e.g., from a CSV file or relational database,into Spark. Both clinical data originally stored in the EAVformat and clinical data stored in the relational table format then become available for the subsequent analyticalprocess.Step 2: Feature constructionIn the second step, raw clinical parameters are transformed to construct features. This will typically be doneby using Spark SQL to execute SQL statements on therelational data extracted in Step 1. MLBCD provides avisual query builder to help users form SQL statements.Visual query building is widely used in relational database systems. A visual query builder provides an intuitivegraphical user interface, in which users form SQL statements visually. For instance, to form a basic SQL queryjoining two tables, the user only needs to select the twotables through drag and drop, draw a line connectingtheir join attributes, and then check the attributes thatwill appear in the results.A good way to write the visual query builder inMLBCD is to modify the source code of SQLeo [46], anopen source visual query builder written in Java. SQLeoPage 5 of 19currently supports several relational database systems,such as Oracle and PostgreSQL, but not Spark. The modification lets SQLeo interact with Spark SQL using JavaDatabase Connectivity (JDBC) supported by SQLeo andSpark SQL. After the visual query builder forms a SQLstatement and the user clicks “Run statement”, MLBCDuses Spark SQL to execute the SQL statement.In addition to the visual query builder, MLBCD provides a command line interface for Spark. Advancedusers can use the command line interface to performoperations supported by Spark and Spark SQL.Step 3: Model building and evaluationIn the third step, machine learning models are built onthe current set of clinical parameters and evaluated.MLBCD integrates machine learning functions of MLlib[7, 44, 45] by modifying the source code and/or callingthe Java application programming interface of MLlib.Recall that MLlib is Spark’s distributed machine learninglibrary and can run on a cluster of computers for parallelprocessing. MLlib implements multiple machine learningalgorithms and feature selection techniques, all of whichare supported by MLBCD.Like Weka [5], MLBCD provides an intuitive graphical user interface for machine learning. Weka is the mostwidely used open source machine learning and datamining toolkit. Weka’s graphical user interface supportsfeature selection (optional), model building, and modelevaluation. In the input interface, the user specifies thedata file, independent variables, dependent variable,machine learning algorithm, and its hyper-parameter values. After the user clicks “Start,” Weka builds the modeland presents its performance metrics. MLBCD’s graphical user interface for machine learning works similarlywith one major difference. In Weka’s input interface, theuser must select an algorithm before building the model.This requires computing expertise. Like Auto-WEKA [8],MLBCD treats the choice of feature selection techniqueas a hyper-parameter and uses the method described in“An automatic selection method for machine learningalgorithms and hyper-parameter values” to automatically search for the optimal algorithm, feature selectiontechnique, and hyper-parameter values. If desired, theuser can make changes in MLBCD’s input interface. Ifthe resulting model’s accuracy is lower than a pre-determined threshold, such as area under the receiver operating characteristic curve (AUC) 0.8 [47, page 177],MLBCD automatically prompts the user to considerreturning to Step 1 to add additional clinical parameters.By default, MLBCD considers all input variables,machine learning algorithms, and feature selection techniques. In the input interface, the user can optionallyspecify a subset of input variables deemed important
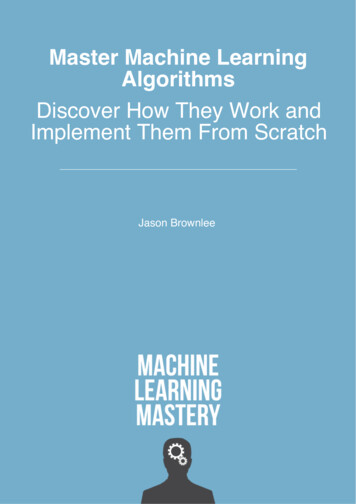
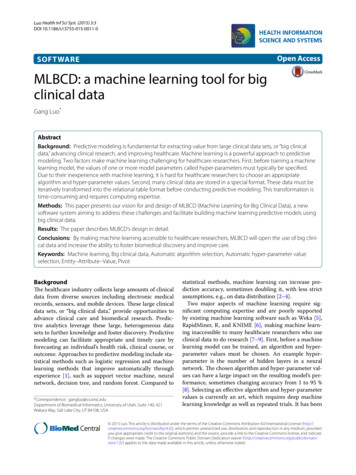
Luo Health Inf Sci Syst (2015) 3:3based on medical knowledge and must be included inthe model. In this case, feature selection will be appliedonly to the other input variables. The user can alsooptionally specify the feature selection techniques and/or algorithms to be explored, possibly based on a desiredproperty. For instance, the user may want interpretable models such as decision tree and k-nearest neighbor(similar patients) [48]. In the output interface, a receiveroperating characteristic (ROC) curve is displayed forbinary classification. The user can mouse over the ROCcurve to exploit trade-offs between sensitivity and specificity. To help simplify the model, the user can opt to seethe used input variables sorted in descending order ofimportance, e.g., using backward feature elimination [1].For each input variable, the accuracy of the model usingall input variables up to it is shown. Often, not every clinical parameter used in the model is routinely collectedin all healthcare systems’ databases. By determining theset of clinical parameters essential for high accuracy, theuser can simplify the model so other healthcare systemsare more likely to adopt it.An automatic selection method for machine learningalgorithms and hyper‑parameter valuesIn this section, we present a new method for efficientlyand automatically searching for the optimal algorithmand hyper-parameter values for a given machine learningproblem. MLBCD uses this method to address existingautomatic search methods’ inefficiencies mentioned inthe Introduction. Our discussion focuses on a large dataset. With some modifications, the new method will alsoapply to relatively small data sets, e.g., by using the testresults on a few random combinations of hyper-parameter values to quickly determine whether a machinelearning algorithm should be eliminated from furtherconsideration. Any given accuracy measure, such asAUC, can be used in our method.In “Overview of the automatic search method”, wegive an overview of the new automatic search method.In “Background on hyper-parameters”, we providesome background on hyper-parameters. In “Review ofthe sequential model-based optimization method”, webriefly review the sequential model-based optimizationmethod. We describe the observations and insights basedon which the new automatic search method is designedin “Observations and insights”. In “The training and testsamples”–“The iterative search process”, we present various parts of the new automatic search method in detail.Page 6 of 19problems are available. If this is not the case, experimental results on previous machine learning problems canbe used to help select a good starting point of the searchprocess for the current machine learning problem, e.g.,in a way similar to that in Feurer et al. [49], and improvesearch efficiency.The entire space of machine learning algorithms andhyper-parameter values is extremely large due to the largenumber of algorithms and possible hyper-parameter values. To efficiently and automatically search for the optimal algorithm and hyper-parameter values, we performprogressive sampling, filtering, and fine-tuning to quicklynarrow down the search space. As shown in Fig. 3, ourkey idea is to use progressive sampling to generate asequence of random samples of the data set, one nestedwithin another [50]. Inexpensive tests are conducted onsmall samples of the data set to eliminate unpromisingalgorithms and identify unpromising combinations ofhyper-parameter values as early and as much as possible.More computational resources are devoted to fine-tuning promising algorithms and combinations of hyperparameter values on larger samples of the data set. Thesearch process is repeated for one or more rounds. As thesample of the data set expands, the search space shrinks.In the last round, (a large part of ) the entire data set isused to find an optimal combination of an algorithm andhyper-parameter values. Sampling has been used beforefor searching for the optimal machine learning algorithm[9, 50–57], but not for searching for the optimal algorithm and hyper-parameter values concurrently.Background on hyper‑parametersIn this section, we provide some background on hyperparameters needed for describing our automatic searchmethod. There are two types of hyper-parameters: conditional and unconditional. An unconditional hyperparameter is always used. In contrast, the relevance ofa conditional hyper-parameter depends on the value ofanother hyper-parameter. For instance, for neural network, the hyper-parameter of the number of hidden unitsin the second layer is relevant only if the hyper-parameter of the number of layers in the neural network is 2.As shown in Fig. 4, all hyper-parameters of a machinelearning algorithm form a tree or directed acyclic graph.Overview of the automatic search methodWe consider all machine learning algorithms applicable to the data set. We focus on the common case thatno experimental results on previous machine learningFig. 3 An illustration of progressive sampling used in our automaticsearch method
Luo Health Inf Sci Syst (2015) 3:3Page 7 of 19Observations and insightsOur automatic search method is designed based on thefollowing observations and insights.Insight 1 It is time-consuming to test a combination of amachine learning algorithm and hyper-parameter valueson the whole data set. It is much faster to test this combination on a (relatively) small random sample of the dataset.Fig. 4 An example depe
(see Fig. 1) [15]. Examples of electronic medical record (EMR) systems using the EAV format include the Cerner Powerchart EMR [16], Regenstrief EMR [17], Intermoun-tain Healthcare's HELP EMR [18], TMR EMR [19], and Columbia-Presbyterian EMR [20]. Examples of clinical study data management systems using the EAV format