Transcription
Practical Application ofMachine Learning WithinActuarial Workby Modelling, Analytics and Insights in Data working partyAlex Panlilio; Ben Canagaretna; Steven Perkins; Valerie du Preez; Zhixin Lim30 January 2018
AbstractMachine learning techniques are increasingly being adopted across the financial sector. Workstream 2 sets outto explore the use of these techniques in existing actuarial practice areas.In Section 1, a clear objective is outlined. We consider the various practise areas and highlight potentialapplications of machine learning techniques. In Section 2, machine learning concepts are introduced andexplored at a high level. Parallels between the machine learning project cycle and the actuarial control cycle aredrawn to highlight the similarities.In Section 3, four case studies, showcasing the applications of machine learning techniques, are introduced (anddetailed in the appendix), including:1.2.3.4.Utilising unstructured data in forecasting interest ratesPricing of marine hullSupervised learning in exposure managementMortality experience analysisIn Section 4, an overview is provided for some of the programming platforms used. The list is by no meansexhaustive and lays the foundation as a starting point for actuaries to use. In Section 5, an overall conclusion isdrawn and a number of lessons learnt provided. The conclusions drawn from the case studies were in most casesinconclusive although we have gained enough intellectual property to be confident of the merits of thesetechniques within our respective areas. We have identified the limitations and potential improvement to ourwork.2
Contents1234Working Party Overview . 51.1Working Party Aims . 51.2Background to working party . 5Machine Learning Overview . 92.1What is “Machine Learning”?. 92.2Other Machine Learning Concepts . 112.3Machine Learning or Data Science? . 122.4Data Science vs Traditional Actuarial Approaches . 132.5How Actuarial Tasks May Benefit from Machine Learning. 14Executive Summary of Case Studies . 153.1Utilising Unstructured Data in Forecasting Interest Rates . 153.2Pricing of Marine Hull . 153.3Supervised learning in Exposure Management . 153.4Mortality experience analysis . 16Programming languages and Applications . 174.1R . 174.2Python . 174.3Other Proprietary Software . 184.4Implementation Considerations . 185Conclusions and recommendations . 196Appendix – Case Studies . 206.1Utilising Unstructured Data in Forecasting Interest Rates . 206.1.1Background . 206.1.2Problem definition. 206.1.3Results and benefits . 206.1.4Framework and methodology . 216.2Pricing of Marine Hull . 266.2.1Background . 266.2.2Problem Definition. 266.2.3Results . 266.2.4Limitations and Scope . 296.2.5Conclusion . 306.3Supervised learning in Exposure Management . 316.3.1Background . 316.3.2Problem Definition. 313
6.3.3Exposure Management . 336.3.4Conclusion . 346.4Mortality experience analysis . 356.4.1Background . 356.4.2Preliminary Analysis . 356.4.3Further Analysis . 366.4.4Improving our Result: Iterations of our modelling approach . 376.4.5Results . 386.4.6Limitations and Future Improvements . 404
1 Working Party Overview1.1 Working Party AimsTo investigate whether the application of machine learning techniques can improve the models and/orassessments we use within traditional actuarial practice areas i.e. how would traditional actuarial practice areasbenefit from data science; and in particular machine learning; techniques?Mission Statement from Terms of ReferenceTo identify key actuarial function areas and processes which have scope to be improved by the implementationof mathematical modelling, predictive analytic tools and data science. Once a list of applicable areas isestablished, the workstream aims to explore and use these new methods and techniques to produce possiblesolutions to improve these areas. This will be summarised into a report for the Institute and Faculty of Actuaries(“IFOA”) Modelling, Analytics and Insights from Data (MAID) Steering Committee.1.2 Background to working partyThe working group started by identifying broad categories of models used within the traditional actuarialpractice areas. From this, we identified areas, which could potentially benefit from the application of machinelearning techniques. This is not an exhaustive list.TRADITIONALACTUARIAL PRACTICEAREASGeneralInsurancePricing Product Design / PropensityCustomer Behaviour Reserving Capital Modelling Exposure Management PensionsLife, Health &CareInvestment Scheme Valuation Surplus Distribution Strategic / Tactical AssetAllocationAsset & LiabilityManagement / Hedging Claims Management Data Cleansing (Table 5) External Data Sources(Table 5) Table 1: Potential application of machine learning techniques5
GENERALINSURANCEMETHODS TO EXPLOREPricing Supervised Learning: decision tree, forests and penalised regressionUnsupervised Learning: using a non-linear approachDeep Learning and high level decision makingExperience monitoring with a larger datasetProduct Design/PropensityCustomerBehaviour Big Data on consumer informationSentiment Analysis using external sources and social mediaReserving Different cohorts Making projections more predictive; claim predicting patterncould varyExplore supervised learning (penalised regression)Experience monitoring with a larger database CapitalModellingExposureManagement1) Network / Graph Modelling- looking at driving dependencies rather thancorrelation assumptions2) Strategically flexible, more decision aid based model on environment3) Portfolio / Reinsurance optimisation – genetic algorithms Build predictive models based on weather patterns(See Table 5. Data Cleansing)Table 2: General InsurancePENSIONMETHODS TO EXPLORESchemeValuation More granular individual information from alternative data sources e.g. socialmediaMore sophisticated longevity modelTailoring investment strategy to individual circumstancesTable 3: Pensions6
INVESTMENTMETHODS TO EXPLOREStrategic /Tactical AssetAllocation Utilising alternative data e.g. text-heavy data, social media feeds, satellite imagesetc.Improvements to Mean-Variance Portfolio OptimisationAsset &LiabilityManagement /Hedging More granular data for asset/liability modellingEnhanced market risk monitoringTable 4: InvestmentLIFE,HEALTHAND ODS TO EXPLORE Supervised Learning: decision tree, forests and penalised regressionUnsupervised Learning: using a non-linear approachDeep Learning and high level decision makingExperience Monitoring with a larger database1) Network / Graph Modelling- looking at driving dependencies rather thancorrelation assumptions2) Strategically flexible, more decision aid based model on environment3) Portfolio / Reinsurance optimisation – genetic algorithms More granular individual information from social media sitesMore sophisticated longevity modelTable 5: Life, Health and CareALLPRACTICEAREASData CleansingExternal DataSourcesFeedback Loop /ActuarialControl CycleMETHODS TO EXPLORE1)2)3)4)Reducing errors i.e. data validationFilling in gaps i.e. missing latitude and longitudesIncreasing sample size using Machine Learning extrapolationWeb scraping, word search / natural language analysis Quandl / Dun and Brad Street / Bloomberg / social media feeds / credit agency Year on year to keep track of outputsTable 6: All areasFollowing the review above, the group was then subdivided into separate working groups in order to explore thefollowing case studies: General Insurance – pricing techniques using experience data7
Exposure Management – data cleansingMortality – analysing suicide rates within a defined populationInvestments –interest rate forecastingThis report summarises the work of the group and is a starting point for further research and discussion on thetopic.8
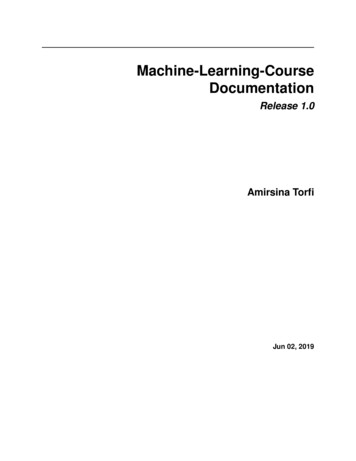
2 Machine LearningLOverviewwImprovemments in compputational powwer has given rise to the usee of machine learningltechnniques in a wide varietyof areas, including finaance, driverlesss cars, imagee detection andd speech recognition amongg others. In a world ofhigh vollume and varried datasets,, machine learrning techniquues are an essential toolkit tto provide acctionableinsights from the datta.2.1 WWhat is “Machine Leaarning”?The termm “machine leearning” is ann overarchingg term which covers a wide variety of ttechniques ovverlappingareas of mathematicss, statistics annd computer science. Maachine learninng is often reeferred to ass artificialintelligennce (AI), withh the two woords (often inccorrectly) beccoming synonnymous. This is because manymhighprofile, ccutting edge, AI use cases utilise machhine learning techniquestto create intelliigent systemss. Broadlyspeaking, machine leaarning algorithhms can be divvided into thrree classes deppending on thhe type of probblem theyare applieed dLearn ingReinforceementLearningSupervissed learningStill by far the mosst common applicationaoof machinelearning are instances of “supervised learning”. A historicalset of training data is useduto create a model whicch explainsthe undeerlying correlaations within the data. Criitically, thetraining ddata has bothh input variables (often refferred to as“featuress”) as well as a target variaable (often refferred to asthe “respponse variablle”). Supervissed learning algorithmswill use tthe input variiables to attemmpt to identifyy the targetvariable. Once a supeervised learninng model has been builtand validdated, it can beb used to makke predictionss for futuredatasets wwhere the inpput variables are known annd the userwould likke to estimatee the unknowwn target variiable. Mostactuaries will be fammiliar with the modellinng processdescribedd above, witth many tradditional actuaarial tasksnaturallyy fitting into thhe supervised learning frammework.Figure 1: Exaample of supervvised learning (decision treeregreession)Superviseed learning inncludes three categoriescof aalgorithms: Binary classiffication;Multiclass claassification;Regression.Binary cllassification taasks are thosee where the ressponse variable is categoriccal in nature wwith exactly twwo classes(e.g. frauud vs. not fraudd).Multiclasss classificatioon tasks are thosetwhere tthe response variablevcan beb separated iinto a finite numbernofspecific “classes” (e.gg. class A, B or C). Binaary classification is therefoore a special instance of multiclassmclassificaation where thhere are only twwo classes.9
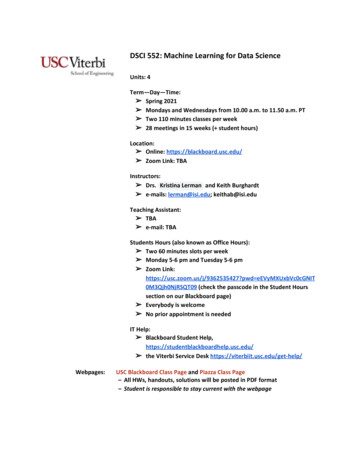
Finally, regression tasks are those where the response variable is numerical and continuous in nature (e.g.predicting claims cost).Some examples of supervised learning algorithms used in practice include: Decision trees;Random forests;Gradient boosted machines;Generalised linear models;Support vector machines;K-nearest neighbour;Neural networks.The above list of techniques is far from exhaustive, but provides an introductory set of techniques for supervisedlearning. These algorithms can be applied to both classification and regression tasks, though the actualparameters used within the models will need to be adjusted accordingly.As highlighted, many actuarial modelling projects naturally fall into the category of supervised learning, withtasks such as insurance contract pricing or pension scheme valuation naturally fitting into this framework. Thedifference between actuarial and machine learning approaches to such tasks is often relatively small, asdiscussed further below. This makes supervised learning tasks a natural place for actuaries to initially exploremachine learning techniques.Unsupervised learningUnsupervised learning covers a variety of techniques which have been designed to solve distinctly differenttypes of problems. Similar to supervised learning, a historical set of training data is used to create a model whichexplains the data. The training data contains input variables, however for unsupervised learning tasks there is noresponse variable. This therefore means that unsupervised learning does not rely on previously known orlabelled data to be trained. Instead it takes the input data as it is, then infers patterns and structures from it“blindly”.Initially, the concept of unsupervised learning can feel counterintuitive to non-statisticians as it may be believedthat nothing meaningful can be learned without some form of outcome data (e.g. a response variable). However,unsupervised learning often allows users to gain a deeper understanding of their data, even if it is not obvious atthe outset quite what will be learned. By far the most common implementation of unsupervised learning iscluster analysis, which is also often used for dimensionality reduction and anomaly detection.Commonunsupervisedlearningalgorithms used in practice include: K-means clustering;K-nearest neighbour;Hierarchical clusteringPrincipal component analysis;Support vector machines;Neural networks.Again, the above list of techniques is farfrom exhaustive, but provides anintroductory set of techniques forunsupervisedlearning.Itwillimmediately be obvious that certaintechniques appear on both the supervisedand unsupervised learning lists. This isbecausethesealgorithmsareFigure 2: Example of cluster analysisparticularly flexible in how they can beimplemented, allowing the user to apply them in a variety of ways.There are perhaps fewer instances where unsupervised learning can be applied within actuarial work. However,cases such as image recognition, text analysis and speech recognition may increasingly become useful areas to10
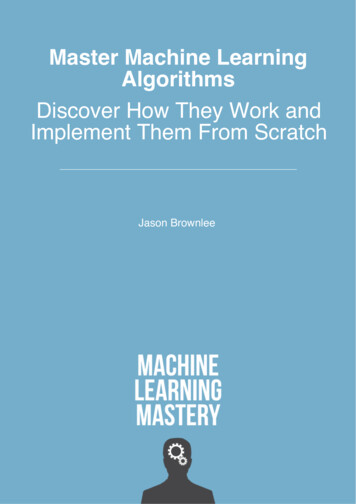
apply unnsupervised learning. A moore traditionall actuarial taskk might invollve cohort creeation, with inndividualsperhaps ggrouped based on their yeear of birth. UUnsupervised learning mighht provide a potential alternative totraditionaal cohort creattion, creating more homogeeneous risks anda hence improving modellling.Reinforccement learniingPerhaps the most coomplex area of machine learning is reinforcement learning. UUnlike supervvised andunsupervvised learning,, reinforcemennt learning dooes not rely onn a historical dataset to buiild a model. Innstead themodel iss created andd updated dyynamically. A reinforcemeent learning algorithmawilll provide a predictedresponse,, but once it is shown the actual outcomme it will inccorporate this new informaation into the model toimprove the next preddiction it makkes. Over timee the predictioons should immprove as the algorithm leaarns moreabout thee environmentt it operates inn. Convergencce of a reinforrcement learnning algorithmm to an optimaal solutionis not guuaranteed andd improving thhe theory covvering the connvergence of these is an aactive area off research.Howeverr, one classicaal example off a problem wwhich can be solved using reinforcemennt learning is a Markovdecision process. Therre may be rellatively fewerr immediate applicationsaoff reinforcemenent learning inn actuarialwork, buut this may well change overr time as statisstical methodss improve.2.2 OOther Machhine Learniing ConcepptsModel VValidationA commmon issue withhin statistical modelling iss over-fitting a model. It is therefore imimportant to validatevapredictive model to ennsure the performance genneralises to neew cases. Wiithin machinee learning andd actuarialwork a standard way tot scrutinise anda improve mmodels is to useu model vallidation in ordder to assess whetherwapredictive model retaains a sufficieent level of performance against new data. Under a standard validationvapproachh, a holdout saample is takeen prior to anyy modelling work.wModelss are built usining a “trainingg” datasetwhich is independent of this holdoout “test” dataa, with this “uunseen” datasset being usedd to test the predictiveppower off the model. ModelsMare tyypically scoreed using an appropriate performance meetric(s) (decidded at theoutset); tthe model achhieving the higghest score onn this indepenndent dataset willw usually bee selected to beb used inpractice.Cross-vaalidation is an alternativve model vvalidation teechnique for assessing how the reesults ofa statisticcal analysis willw generalize to an indepenndent set of data. It is mainnly used in setttings where thet goal isprediction and the userr wants to estiimate how acccurately a preddictive model will perform in practice.Cross-vaalidation is useed to find out the predictabbilityof the moodel by splittiing a dataset intoik-parts (ooftenreferred to as ‘folds’’). k-1 parts are used forr theactual traaining of the modelmand thee remaining siinglepart is ussed as an indeependent dataaset for validaatingthe perfoormance of thee model. This approach iterratesuntil all combinationss of the k parrtitions have bbeena produced andtested. Inn this manneer k models arescored aggainst (differeent) independdent datasets. Thefinal moddel might thenn be a simplee average of ththe kmodels pproduced, as shownsin Figuure 3. Withouut anexplicit hholdout dataseet, this allows models to bennefitfrom uttilising all thetavailablee data whillstbenefitinng from validdation of perfformance on kdatasets wwhich are independent of thhe actual moddelbuilding process.Figure 3: Cross‐validatioCon using 10 foldds of 10%An extension of thiis is to this use of croossvalidationn can be in tuning model hypeerparameteers. In this insstance the data is split intoo atraining and test (or ‘holdout’) dataset,dbut thhetraining set is then spplit into k-parrts. Models aarebuilt withh a variety of hyper-parameeters once agaainusing k-1 elements of the trainingg set. The beesthyper-paarameters can be selected based on theeirperformaance on the kth (‘validationn’) part of thhe11Figure 4:4 Cross‐validattion using 5 fol ds of 16% as wellw as a 20% hooldout
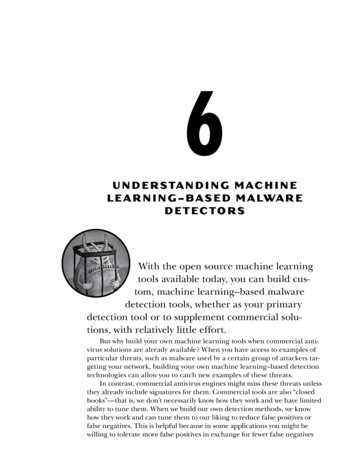
training set. This allows a user to identify what appears to be the ‘optimal’ (or at least best performing) set ofmodel parameters to go forward and be scored against the test data. Utilising cross validation for the hyperparameter tuning ensures that the test dataset remains truly independent of the model fitting process andtherefore will give an unbiased view on the performance of the model against other candidate models. Thisapproach is illustrated in Figure 4.Deep LearningAn area of machine learning gaining particular notoriety is deeplearning. Deep learning has become a recognisable term formany due to its being the catalyst for many recent high-profileadvancements in artificial intelligence. It is fundamentally anadvanced application of artificial neural networks (ANNs), withan example of a basic feed-forward ANN shown in Figure 5.Much like other modelling techniques, such as generalisedlinear models, in a supervised learning context a neural networktakes inputs (shown in blue) and uses these to predict anoutcome (shown in red). The neural network does this bytransforming the inputs via a hidden layer (shown in green).The actual model parameters are the weights that are placed oneach linking edge of the model (the black lines).As an example, Figure 5 shows a relatively basic feed-forwardANN with 5 input nodes. Each input node will take a valueFigure 5: Example of a basic neural networkwhich for ease could be assumed to be either 0 or 1. The valueof the first node in the hidden layer will be determined by the values of these 5 input nodes with the relativeweight placed on each input learned as part of the model fitting process. Other nodes in the hidden layer will besimilarly defined, though they will naturally have different weightings on each of the input nodes. In much thesame way the value of the output node will then be determined by the values of the 7 nodes in the hidden layer,with the relative weight placed on each hidden node again being determined through the model training.Inputting a new observation containing values of the 5 input nodes will lead to an output prediction for the valueof the target variable. This is calculated by passing the inputs through the network using the learned weightsfrom the training process to firstly calculate the values at the nodes in the hidden layer and then use these tocalculate the value of the output node.The above is a very high-level description of a basic ANN, but more complex neural network architectures havebecome popular more recently due to their empirical performance for a variety of challenging tasks. However,this has all been made possible through the ability to design complex model structures which reflect the natureof these tasks. Whilst in certain cases the underlying mathematics behind these complex model structures hasbeen known about for a while it is the increase in data volumes along with the improved computing capabilities(including GPU processing) which has resulted in an increase in the usage of ANNs.Deep learning itself can be defined in a number of ways but, broadly speaking, it covers the extension of theabove basic model architecture to cover any case where there is more than one layer of hidden nodes, ormultiple layers of neural networks. As such, these ANNs make predictions based on processing repeat layers ofsignals, imitating the learning process via neural pathways in the human brain.2.3 Machine Learning or Data Science?Two terms which are often used interchangeably are “machine learning” and “data science”, and therefore it isimportant that actuaries are clear around the distinction in these two terms. Machine learning covers a suite ofstatistical techniques and algorithms used for modelling data. Data science is a broader term which includes allmethods, processes, and approaches to extract insights from data. Therefore, data science will include areas suchas: Data collection;Data cleaning;Data engineering;Data visualisations;Application of the scientific method;Advanced programming.12
Data science also includes knowledge of machine learning to determine which approaches are best suited toparticular tasks. What should immediately become apparent though is that many of the above skills are alsocommon with those already used by actuaries as discussed further below.2.4 Data Science vs Traditional Actuarial ApproachesAs already noted above, many aspects of data science are very similar to those already used by actuaries. Figure6 below gives an overview of a typical data science project lifecycle.1. Define Problem Aims Supervised / Unsupervised Classification / Regression3. Monitor Outcome2. Design Solution Model Refinement Model Aging Interaction with Environment Obtain / Prepare Data Select Inputs Variables Select Accuracy Metric Select ModelFigure 6: An overview of a typical data science project lifecycleWhen shown in this format, it becomes clear that there is a significant overlap between the phases data scientistsgo through when developing a model and the actuarial control cycle. The main differences between actuarialand data science approaches occur in phase two, when a solution is being designed. Actuaries will typically usetheir domain knowledge to select an appropriate model format before spending a reasonable amount of timemaking choices of parameters which are sensible and justifiable for the purpose of the model. In this way,actuaries typically spend a large amount of time minimising the parameter error within their models. Bycontrast, data scientists may look to test a wider array of potential models, taking advantage of the speed withwhich machine learning can fit suitable models. This means that a data science approach can focus on reducingthe model error initially, by testing a variety of model forms, with parameter tuning coming later and perhapsreceiving less scrutiny than under an actuarial approach.The other key difference is that actuaries will often build models which are financial in nature, utilising theirexisting domain knowledge. Data scientists tend to tackle a wide variety of modelling tasks (financial and nonfinancial) and therefore are often more reliant on gaining an understanding of the domain specific elements of atask from other domain specialists. Other key differences arise due to the following: The statistical techniques used by actuaries and data scientists often differ;The approaches taken to validate assumptions may differ;The approaches used for variable selection may differ;The approaches used to assess the performance of a model may differ.However, despite these differences, what should be clear is that data science and actuarial modelling approacheshave much in common. This leaves the actuarial profession well placed to utilise these new techniques withinthe scope of their existing work.13
2.5 How Actuarial Tasks May Benefit from Machine LearningThe exponential increase in data generation, capture and storage along with improved computer power is likelyto benefit actuaries in two primary ways. Firstly, improved data and computational capabilities is likely to meanthat traditional actuarial tasks can be tackled with increasingly sophisticated approaches. The secondopportunity arises because many actuaries will have the necessary skills to capitalise on new opportunitieswhich arise to expand the profession into new areas.This paper focuses on the first of these benefits, demonstrating them via a series of case studies. The keybenefits of applying machine learning to actuarial tasks can broadly be split into six categories.Improved Data QualityAs more data is created and storage becomes more cost effective, there is an increase in the opportunity toimprove the quality of data which businesses are using. Similarly, as competitors start utilising better data,businesses not attempting to do the same may become left behind. These effects are allowing companies toimprove the quality of their data going forward, and this can only benefit actuaries as higher quality data wi
applications of machine learning techniques. In Section 2, machine learning concepts are introduced and explored at a high level. Parallels between the machine learning project cycle and the actuarial control cycle are drawn to highlight the similarities. In Section 3, four case studies, showcasing the applications of machine learning .