Transcription
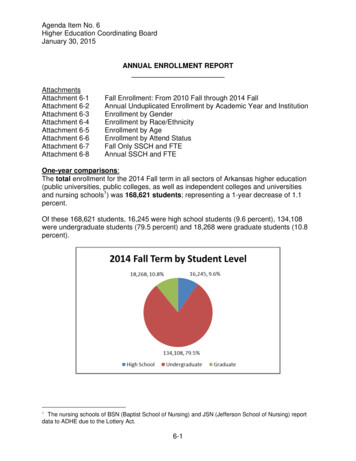
Agenda Item No. 6Higher Education Coordinating BoardJanuary 30, 2015ANNUAL ENROLLMENT REPORTAttachmentsAttachment 6-1Attachment 6-2Attachment 6-3Attachment 6-4Attachment 6-5Attachment 6-6Attachment 6-7Attachment 6-8Fall Enrollment: From 2010 Fall through 2014 FallAnnual Unduplicated Enrollment by Academic Year and InstitutionEnrollment by GenderEnrollment by Race/EthnicityEnrollment by AgeEnrollment by Attend StatusFall Only SSCH and FTEAnnual SSCH and FTEOne-year comparisons:The total enrollment for the 2014 Fall term in all sectors of Arkansas higher education(public universities, public colleges, as well as independent colleges and universitiesand nursing schools1) was 168,621 students; representing a 1-year decrease of 1.1percent.Of these 168,621 students, 16,245 were high school students (9.6 percent), 134,108were undergraduate students (79.5 percent) and 18,268 were graduate students (10.8percent).1The nursing schools of BSN (Baptist School of Nursing) and JSN (Jefferson School of Nursing) reportdata to ADHE due to the Lottery Act.6-1
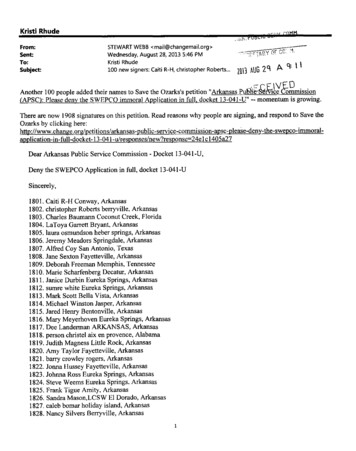
Agenda Item No. 6January 30, 2015Only the number of high school students enrolled in college has increased since the2013 Fall term. The number of both undergraduate and graduate students hasdecreased.Growth Since 2013 FallHigh -69-1,889Percent13.4%-2.7%-0.4%-1.1%Public 4-Year University enrollment continues to constitute the majority of all highereducation enrollment in Arkansas. The below pie chart illustrates that 58.1 percent ofall college students are enrolled at public 4-Year Universities, 31.7 percent are at public2-Year Colleges, 9.8 percent are at private/independent institutions of higher education,and 0.5 percent are enrolled at nursing schools.The current enrollment decline is only affecting the public 2-Year Colleges.Growth Since 2013 Fall4-Year Universities2-Year CollegesPrivate/IndependentsNursing nt0.3%-4.9%2.2%33.9%-1.1%
Agenda Item No. 6January 30, 2015Issue of Non-Traditional and Innovative Terms/SemestersHistorically, colleges and universities have enrolled students into fall, spring andsummer terms. However, with many institutions attempting to be more customerservice oriented and because of increased competition for students from otherinstitutions of higher education (including out-of-state online programs), manyinstitutions are offering enrollments into terms that do not coincide with the traditionalfall, spring and summer terms. A common arrangement is three terms per semester: (a)one 8-week term at the beginning of the traditional term, (b) a second 8-week term atthe end of the traditional term, and (c) the full 16-week traditional term. Some termsmay even cross over the traditional terms, such as an 8-week term starting in lateNovember and ending in January, etc.This phenomenon is expected to continue and its use will most likely increase. This willhave the effect of blurring term comparisons making annual comparisons more usefulthan term comparisons.Five-year comparisons:Comparing 2014 Fall data to 2010 Fall data, total enrollment is down 4,692 students(2.7 percent).The table below shows that the highest percentage growth has occurred with theenrollment of high school students.Growth Since 2010 FallHigh 115-429-4,692Percent4.3%-13.8%-0.2%-12.3%
Agenda Item No. 6January 30, 2015Public institutions account for 89.8 percent of total enrollment.The following summarizes more specific information by sector.6-4
Agenda Item No. 6January 30, 2015Annual Unduplicated Headcount EnrollmentAnnual unduplicated headcount enrollment is counting all students one time for theentire academic year. The student may be enrolled in two or more semesters but theyare counted only once during the academic year.Attachment 6-2 shows the total number of students served in for-credit classes atArkansas higher education institutions by academic year, focusing on the unduplicatedheadcount of students enrolled in colleges and universities during at least one termduring the academic year. The semesters and terms composing an academic yearcorrespond closely to the July 1 through June 30 fiscal year and chronologically includea second summer term, the following fall semester, the following spring semester, andthe following first summer term. (Note: Students enrolled in off-schedule coursesrelated to these semesters and terms are also included. Also, the nursing schools of6-5
Agenda Item No. 6January 30, 2015BSN and JSN have not yet participated in data collection process to have five years ofhistory.) In those cases where the student enrolled in more than one term, which ismost frequently the case, the student is counted only one time, hence this reportsunduplicated headcount enrollment for the academic year and for each institution.Unduplicated headcount provides a more complete picture of total statewide enrollmentthan does just the fall semester enrollment summary. The fall semester enrollmentreport presents a snapshot of enrollment that is valid for the fall term, but it does nottake into account the number of new or returning students who enroll during the othersemesters and terms throughout the academic year. The unduplicated headcountenrollment summary is also a better measure of the total number of students served atthe college or university level.The annual unduplicated headcount enrollment for Academic Year 2014 (2013-2014) inArkansas higher education (4-year public universities, 2-year public colleges, privateindependent institutions, and nursing schools) was 213,966 students; representing a 1year decrease of 3.0 percent and a 5-year decrease of 0.8 percent.Five 4-Year Universities reported increases in 1-year growth with the top three asfollows:1. University of Central Arkansas – 3.3 percent2. Arkansas Tech University – 3.2 percent3. Southern Arkansas University – 3.1 percentSix of the eleven 4-Year Universities experienced positive 5-year growth. The top threewere:1. Arkansas Tech University – 24.8 percent2. University of Arkansas Fayetteville – 23.5 percent3. Arkansas State University Jonesboro – 7.6 percentOnly three of the twenty-two 2-Year Colleges experienced 1-year increases in annualunduplicated headcount enrollment. The top three were:1. College of the Ouachitas – 4.7 percent2. Cossatot Community College of the University of Arkansas – 1.3 percent3. Southern Arkansas University Tech – 0.6 percentOnly two of the twenty-two 2-Year Colleges experienced positive 5-year growth. Theywere:1. Arkansas State University Newport – 8.3 percent2. Ozarka College – 4.8 percentFour private/independent institutions experienced 1-year growth in unduplicatedheadcount enrollment. The top three were:1. John Brown University – 5.0 percent2. Hendrix College – 3.3 percent3. Williams Baptist College – 2.5 percentSeven of the private/independent institutions experienced 5-year growth in unduplicated6-6
Agenda Item No. 6January 30, 2015headcount enrollment. The top three were:1. Arkansas Baptist College – 79.4 percent2. Central Baptist College – 50.1 percent3. John Brown University – 48.0 percentFor the nursing schools, Jefferson School of Nursing reported a 1-year growth rate of2.6 percent.NOTE: The private/independent institutions and nursing schools are not being reportedfor 5-year growth as they have not been submitting data for each term of enrollment forfive years. Their reporting of enrollment for every term began with the Lottery Act.Student Demographic ProfileA demographic overview of students enrolled in Arkansas public higher education in fall2014 contrasts significantly between the universities and the colleges and has changedsince fall 2010. Gender: Overall, the proportion of male-to-female students has seen a gradualincrease in the percentage of male students over the past 5 years from 40.9 percentin fall 2010 to 41.6 percent in fall 2014.Change in Gender4-Year Universities2-Year CollegesPrivate/ IndependentsNursing SchoolsTotalPercent Male 2010 Fall43.4%36.7%43.8%15.3%40.9%6-7Percent Male 2014 3%0.7%
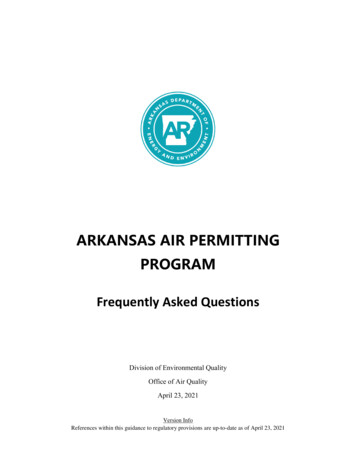
Agenda Item No. 6 January 30, 2015Race/Ethnicity: The race/ethnic breakdown for the fall 2014 semester follows.Note that the race/ethnicity categories are abbreviated; the full classifications areAmerican Indian/Alaskan Native only, Asian only, Black only, Hawaiian and PacificIslander only, Hispanic any, White only, Two or More Races only, Non-ResidentAlien, and Unknown.2014 FallAmer. Indian/AlaskanAsian4-Year Universities0.9%1.9%2-Year Colleges0.7%1.1%Private/ Independents0.9%1.3%Nursing 0%1.5%0.1%5.3%White69.0%66.1%70.7%74.2%68.3%Two 1.5%1.9%4.4%1.4%1.9%0.0%0.0%2.7%3.1%1.1%Looking at race/ethnicity by the major categories in Arkansas provides the followinggraph and table.6-8
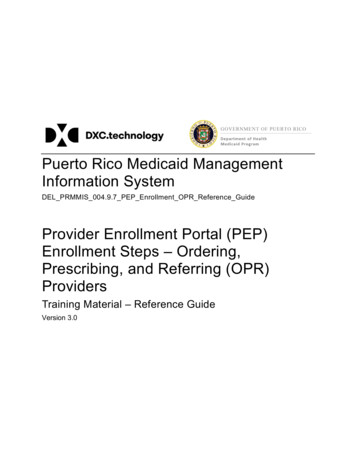
Agenda Item No. 6January 30, 2015The below table illustrates the change in Race/Ethnicity from 2010 Fall to 2014 Fall.Changes from 2010 Fall to 2014 FallInstitution Type4-Year Universities2-Year CollegesPrivate/ IndependentsNursing SchoolsTotal Amer. -3.1%69.3%-0.4%1.1%0.1%Two %1.3%0.0%0.6%Unknown-0.8%-4.9%0.0%-93.9%-2.7%Age: The age distribution reveals contrasting trends for the two sectors. Notsurprisingly, 63.6 percent of 4-Year University students and 72.6 percent of privateindependent students are in the traditional-aged bracket (18-24 years), while only44.1 percent of 2-Year College students and 53.1 percent of nursing school studentsare in this age bracket.6-9
Agenda Item No. 6January 30, 2015 Attendance Status: Since fall 2010, the overall percent of full-time students hasdecreased slightly. Double Enrollments: A total of 2,342 students were enrolled in two or moreinstitutions in fall 2014. This represents a 7.0 percent increase from fall 2013.6-10
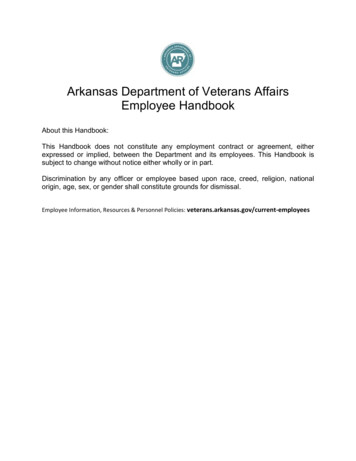
Agenda Item No. 6 January 30, 2015Geographic Origin: For all institutions, 82.1 percent of the students enrolled in thefall 2014 semester at Arkansas universities and colleges are from Arkansas.OriginArkansas Percent82.1%Texas8,4305.1%Foreign Tennessee2,1001.3%Distance Learning/Telecommunications Coursework: Based on institutionsreporting coursework delivered via distance learning (telecommunications coursesonly), 5,127 courses (up from 4,904 the previous fall) were offered in fall 2014representing an increase of 4.5 percent. There were 96,310 enrollments (up from92,783 the previous fall) in these courses representing an increase of 3.8 percent. Atotal of 283,654 SSCH were involved in telecommunications courses (274,436SSCH for 2013 fall), representing 3.4 percent increase.Term2013 Fall2014 FallGrowth 6,3103.8%SSCH274,436283,6543.4%Off-schedule courses: In order to ensure that institutions receive credit in thefunding formula for a full year of student semester credit hours (SSCH) that theyproduce and in recognition that many institutions offer courses that meet accordingto a schedule that varies from the traditional fall-spring-summer calendar, ADHE hascollected data concerning off-schedule courses and enrollments through a specialreporting process. Through this process, short-courses and other courses that beginafter the census date are reported and the resultant SSCH are tabulated andincluded for funding purposes. Without such a process, institutions that attempt toreach more students by making their courses more available, at times that are moreconvenient to students, would be penalized by losing state-funding for the SSCHthat are generated by these courses.6-11
Agenda Item No. 6January 30, 2015Fall SSCH and FTESSCH and FTE are highly related as SSCH is usually divided by a pre-determinedfactor to determine FTE. For undergraduates, SSCH is divided by 15 to determineundergraduate FTE, whereas SSCH is divided by 12 to determine graduate FTE.However, to determine First Professional FTE, the past IPEDS method of using fallstudent headcounts is used in this report. This method counts all full-time students as 1FTE and all part-time students as 0.6 FTE.Note that SSCH and FTE are calculated for public institutions only. The independentinstitutions and nursing schools do not submit course data that is required forSSHC/FTE calculations.Fall FTE (full-time equivalents) have decreased over the last five fall terms (from Fall2010 to 2014 Fall) by 3.0 percent to a total of 110,524 FTE. This represents a one-yeardecrease of 2.4 percent.Institution Type4-Year Universities2-Year CollegesTotalInstitution Type4-Year Universities2-Year CollegesTotalUndergraduate Graduate First ProfessionalOne (1) Year Growth in FTE-0.2%0.3%0.7%-7.2%-2.6%0.3%0.7%Undergraduate Graduate First ProfessionalFive (5) Year Growth in -7.2%-2.4%Total4.7%-17.2%-3.0%
Agenda Item No. 6January 30, 2015Undergraduate SSCHThe 4-year universities with the greatest volume of undergraduate SSCH were:1. University of Arkansas Fayetteville – 301,652 SSCH2. University of Central Arkansas – 129,800 SSCH3. Arkansas State University Jonesboro – 124,700 SSCHThe 2-year colleges with the greatest volume of undergraduate SSCH were:1. Pulaski Technical College – 91,172 SSCH2. Northwest Arkansas Community College – 69,176 SSCH3. Arkansas State University Beebe – 41,552 SSCHGraduate SSCHThe 4-year universities with the greatest volume of graduate SSCH were:1. University of Arkansas Fayetteville – 27,495 SSCH2. Arkansas State University Jonesboro – 16,582 SSCH3. University of Arkansas at Little Rock – 13,103 SSCHAnnual SSCH and FTEAnnual SSCH and FTE are highly related as SSCH is usually divided by a predetermined factor to determine FTE. For undergraduates, annual SSCH is divided by30 to determine annual undergraduate FTE, whereas annual SSCH is divided by 24 todetermine annual graduate FTE. However, to determine First Professional FTE, theIPEDS method of using fall student headcounts was used. This method counted allunduplicated annual full-time students as 1 FTE and all unduplicated annual part-timestudents as 0.6 FTE.Annual FTE (full-time equivalents) has increased over the last five years (fromAcademic Year 2010 to Academic Year 2014) by 0.7 percent to a total of 122,145 FTE.This presents a one-year decrease of 2.2 percent.6-13
Agenda Item No. 6Institution Type4-Year Universities2-Year CollegesTotalInstitution Type4-Year Universities2-Year CollegesTotalJanuary 30, 2015Undergraduate Graduate First ProfessionalOne (1) Year Growth in FTE-0.2%3.1%0.0%-6.9%-2.7%3.1%0.0%Undergraduate Graduate First ProfessionalFive (5) Year Growth in -2.2%Total7.3%-11.0%0.7%Undergraduate SSCHThe 4-year universities with the greatest volume of undergraduate annual SSCH were:1. University of Arkansas Fayetteville – 608,337 SSCH2. Arkansas State University Jonesboro – 274,575 SSCH3. University of Central Arkansas – 268,506 SSCHThe 2-year colleges with the greatest volume of undergraduate annual SSCH were:1. Pulaski Technical College – 219,124 SSCH2. Northwest Arkansas Community College – 159,192 SSCH3. Arkansas State University Beebe – 93,555 SSCHGraduate SSCHThe 4-year universities with the greatest volume of graduate annual SSCH were:1. Arkansas State University Jonesboro – 70,202 SSCH2. University of Arkansas Fayetteville – 67,580 SSCH3. University of Arkansas at Little Rock – 31,867 SSCH6-14
Agenda Item No. 6January 30, 2015TIF (Technical Institute Funding) CoursesTwo institutions (ATU and UAM) have courses that receive Technical Institute Fundingthat are not included in the above enrollment and SSCH calculations. This is generallythe Ozark campus for Arkansas Tech University and the Crossett and McGeheecampuses for the University of Arkansas at Monticello. The enrollment and SSCH forTIF courses are below.SSCH and Enrollment for Technical Institute Funding CoursesSSCHInst. Type InstitutionAY2010AY2011AY2012AY2013AY20141-Yr. 48,70751,78752,7201.8%Annual Unduplicated EnrollmentInst. Type InstitutionAY2010AY2011AY2012AY2013AY20141-Yr. 037-0.7%6-155-Yr. Growth36.2%6.8%23.4%5-Yr. Growth50.5%6.0%31.0%
Fall Enrollment by Academic Year and InstitutionATTACHMENT 6-1AY2011, Term 1 (2010 Fall)AY2012, Term 1 (2011 Fall)Fall Enrollment, Academic Year 2011Fall Enrollment, Academic Year 2012Institution#UnderUnderGraduate All Students High SchoolGraduate All StudentsHigh 95079547VJSN0560560710714-Year 4396,4772-Year e 51Nursing Schools0919091908660866State 176,823Statewide Unduplicated Headcount170,203173,896Inst.TypeNOTE: Counts of 10 or lessare not shown due to FERPA.Page 1 of 4ADHE Updated 12/19/2014
Fall Enrollment by Academic Year and InstitutionATTACHMENT 6-1AY2013, Term 1 (2012 Fall)AY2014, Term 1 (2013 Fall)Fall Enrollment, Academic Year 2013Fall Enrollment, Academic Year 2014#InstitutionUnderUnderGraduate All Students High SchoolGraduate All StudentsHigh 529052947VJSN0610610730734-Year 1897,6882-Year e 04Nursing Schools0911091106020602State 170,510Statewide Unduplicated Head172,019168,305Inst.TypeNOTE: Counts of 10 or lessare not shown due to FERPA.Page 2 of 4ADHE Updated 12/19/2014
Fall Enrollment by Academic Year and InstitutionATTACHMENT 6-1AY 2015, Term 1 (2014 Fall)Fall Enrollment, Academic Year 2015#InstitutionUndergraduHigh SchoolGraduate All 053046VBSN0737073747VJSN0690694-Year Universities6,06675,84316,06897,9772-Year Colleges9,55643,821053,377Private Institutions62313,6382,20016,461Nursing Schools08060806State Total16,245134,10818,268168,621Statewide Unduplicated Head166,269Inst.TypeNOTE: Counts of 10 or lessare not shown due to FERPA.Page 3 of 4ADHE Updated 12/19/2014
ATTACHMENT 6-1Fall Enrollment by Academic Year and InstitutionOne (1) Year Growth#Inst.TypeInstitutionHigh 7VJSN4-Year Universities2-Year CollegesPrivate InstitutionsNursing SchoolsState TotalStatewide Unduplicated HeadNOTE: Counts of 10 or lessare not shown due to -5.5%-0.7%-7.8%2.6%33.9%-2.7%GraduateFive (5) Year GrowthAll Students High %-20.0%-12.3%20.0%0.3%-5.1%-0.4%Page 4 of 6.9%-2.3%All %23.2%4.3%-13.8%-0.2%-12.3%-2.7%-2.3%ADHE Updated 12/19/2014
ATTACHMENT 6-2Annual Unduplicated C43PUO44PWBC45VBSN46VJSN4-Year Universities2-Year CollegesPrivate/IndependentsNursing SchoolsTotalStatewide 1Page 1 of .1%0.0%-0.8%-0.1%ADHE Prepared 12/2/2014
ATTACHMENT 6-3Fall Enrollment by Gender#InstitutionTotal4-Year Universities1 ASUJ13,4152 ATU9,8153 HSU3,7264 SAUM3,3795 UAF21,3736 UAFS7,7167 UALR13,1768 UAM3,6389 UAMS2,83610 UAPB3,42811 UCA11,444Sub-Total93,9462-Year Colleges1 ANC2,0032 ASUB4,6833 ASUMH1,5834 ASUN2,0855 BRTC2,4986 CCCUA1,5237 CotO1,5438 EACC1,5059 MSCC2,33910 NAC2,42111 NPCC3,84512 NWACC8,36513 OZC1,56214 PCCUA2,15515 PTC11,20616 RMCC1,11617 SACC1,76018 SAUT1,85119 SEAC2,18120 UACCB1,70521 UACCH1,55722 UACCM2,462Sub-Total61,948Private/Independent Institutions1 ABC1,1212 CBC7363 CRC2014 HC1,4675 HU6,7486 JBU2,1317 LC6518 OBU1,5049 PSC69610 SC011 UO63012 WBC615Sub-Total16,500Nursing Schools1 BSN8632 JSN56Sub-Total919Total173,3132011 (2010 Fall)Male#%Female#%Total2012 (2011 119.615.37334577
3. Arkansas State University Jonesboro - 7.6 percent Only three of the twenty-two 2-Year Colleges experienced 1-year increases in annual unduplicated headcount enrollment. The top three were: 1. College of the Ouachitas - 4.7 percent 2. Cossatot Community College of the University of Arkansas - 1.3 percent 3. Southern Arkansas University .