Transcription
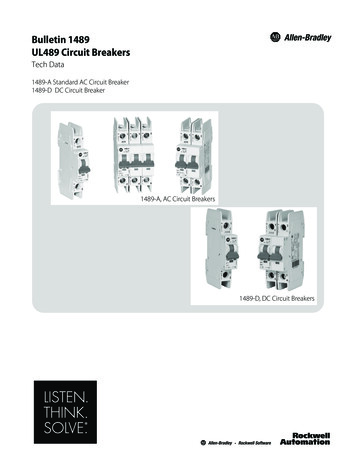
Highway Loss Data InstituteBulletinVol. 37, No. 12 : December 2020Compendium of HLDI collision avoidance research SummaryThe Highway Loss Data Institute (HLDI) has evaluated and reported on collision avoidance technologies since 2009. To date, HLDI haspublished more than 80 research reports evaluating collision avoidance technologies. This compendium synthesizes the most recent findings from these analyses and combines findings from individual manufacturers to estimate the combined effect of each technology on thefrequency of claims and the effect of vulnerable, front-end-mounted technologies like curve-adaptive headlights on collision claim severity and overall losses. A weighted average was calculated to estimate the combined effect of each crash avoidance technology on claimfrequencies under each coverage type across manufacturers. With the exception of lane departure warning, the combined effects for allof the technologies are associated with statistically significant reductions in claim frequencies. The only statistically significant increase inclaim frequency was associated with rear cameras under collision coverage. That increase was 0.5 percent. Front automatic emergencybraking (AEB) and rear AEB, technologies that automatically take action for the driver in a crash-imminent situation, have been associatedwith larger reductions in claim frequencies than technologies that rely on the driver to respond to warnings. Curve-adaptive headlights andforward collision warning, both of which are enabled by front-mounted equipment vulnerable to damage in a crash, have been associatedwith increases to claim severities. While the findings indicate that collision avoidance technologies are reducing claim frequencies, onlya fraction of vehicles in the U.S. fleet are equipped with these technologies. Claim frequencies across the entire population of vehicles inthe U.S. will decrease as the proportion of the vehicle population equipped with collision avoidance technologies increases in the comingdecades.Percent change in claim frequency associated with collision avoidancetechnologies by coverage ngsensorsrearcamerarearAEB
IntroductionCollision avoidance technologies have the potential to reduce crashes and related injuries and deaths. An InsuranceInstitute for Highway Safety (IIHS) analysis of police-reported crashes between 2004 and 2008 indicated that, together, forward collision warning, lane departure warning, blind spot monitoring, and curve-adaptive headlights couldprevent or mitigate nearly one-third of crashes reported to police each year (Jermakian, 2011). In 2009, HLDI was thefirst group to document the effects of a collision avoidance technology on motor vehicle crashes when it evaluatedthe Mercedes-Benz Distronic system (HLDI, 2009). Since then, HLDI has published more than 80 research reportsdocumenting the efficacy of various collision avoidance technologies for reducing claim frequencies and insurancelosses. This report summarizes HLDI’s most recent evaluations for the following collision avoidance technologies:forward collision warning (FCW), front automatic emergency braking (AEB), curve-adaptive headlights, lane departure warning (LDW), blind spot warning (BSW), parking sensors, rear camera, and rear AEB (HLDI, 2017a; 2018a-i;2019a-f). Results were combined to estimate the collective effect of each technology on the frequency of claims acrossthe manufacturers and vehicle models examined to date. Collision claim severity and overall loss results were combined across manufacturers and vehicle models only for those technologies mounted on the front of the vehicle andmost susceptible to damage in a crash. MethodsVehiclesHLDI analyses of collision avoidance technologies have examined insurance claim frequencies, severities, and overall losses for 12 manufacturers: Acura, Audi, BMW, Buick, General Motors, Honda, Kia, Mazda, Mercedes-Benz,Nissan, Subaru, and Volvo. Many collision avoidance technologies offered by these manufacturers are not availableas standard equipment and are optional. Consequently, HLDI had to determine which vehicles were equipped withcrash avoidance technologies to evaluate each technology’s effect on claim frequencies, severities, and overall losses.HLDI used the following three methods to determine the presence or absence of collision avoidance technologies forvehicles in a study population: A manufacturer supplied HLDI with vehicle identification numbers (VINs) and the presence or absence ofcollision avoidance technologies for each VIN. This approach was used to analyze the effects of collision avoidance technologies for Acura, Audi, BMW, Buick, General Motors, Mazda, Mercedes-Benz, Nissan, and Volvovehicles. Some collision avoidance technologies are standard on certain vehicle trim levels. On some vehicles from certain manufacturers, the trim level can be identified in the first 10 positions of the VIN, allowing the presenceof an associated collision avoidance technology to be determined. This approach was used to analyze collisionavoidance technologies on the Acura TLX, Honda Accord, Honda Odyssey, Honda Pilot, and Kia Sportage. Some manufacturers explicitly code the presence of collision avoidance technologies in the first 10 positionsof the VIN. This approach was used to analyze collision avoidance technologies for Subaru and some Hondavehicles.Collision avoidance technologiesThis report summarizes the most recent HLDI results for the following collision avoidance technologies:Forward collision warning (FCW) mitigates frontal crashes by using sensors like cameras or radar to detect whenthe vehicle is getting too close to the one in front of it and alerts the driver using an audible, visual, and/or hapticwarning. Some systems also are capable of detecting pedestrians.Front AEB uses the same kinds of sensors as forward collision warning to alert drivers of emergency situations andautomatically applies the vehicle brakes if the driver does not respond to the warning (if presented) or the crashimminent situation.HLDI Bulletin Vol 37, No. 12 : December 20202
Curve-adaptive headlights pivot in the direction of travel based on steering wheel movement and sometimes the vehicle’s speed to better illuminate curved roads at night. Curve-adaptive headlights may use traditional incandescentor halogen lamps or newer types of lights like light-emitting diode (LED) or high intensity discharge (HID) lamps.Lane departure warning (LDW) uses cameras to track the vehicle’s position in the lane and alerts the driver if thevehicle inadvertently strays across the lane markings when the turn signal is not activated. Some systems also supportlane-keeping by directing the vehicle back into the lane using light braking or minor steering adjustments.Blind spot warning (BSW) uses sensors to monitor areas beside the vehicle and alerts the driver when a vehicle isdetected in an adjacent lane blind spot or when a vehicle is swiftly approaching the blind spot.Parking sensors use radar or ultrasonic sensors to detect nearby objects or objects in the vehicle’s path to help driverspark and back up. The system audibly indicates when objects are in close proximity at very low speeds.Rear cameras enhance rear visibility by providing a view of the area directly behind the vehicle in an interior display.Rear cameras visually display surroundings directly to the rear of the vehicle at very low speeds when the vehicle istraveling in reverse.Rear AEB automatically applies the brakes to keep the vehicle from reversing into an object detected by sensors.Other technologiesSome collision avoidance features are only available with other collision avoidance or advanced driver assistancefeatures.Adaptive cruise control (ACC) maintains a set speed and following distance from the vehicle ahead using information from a camera or radar sensor. Frequently, it is present on vehicles equipped with FCW or front AEB.Rear cross-traffic alert (RCTA) issues a warning when the vehicle is reversing and another vehicle approaching fromeither side is detected that may cross its path. RCTA often is enabled by the same radar sensor that enables BSW.Distance alert uses information from a camera or radar to inform the driver about the time interval to the vehicle infront and alerts the driver when the vehicle is closer than a set time interval. This function is sometimes combinedwith FCW or front AEB.Fatigue warning alerts the driver if signs of drowsiness are detected based on steering input and other driver behaviors.Surround view cameras integrate views from multiple cameras including a rear camera to provide the driver with a360-degree, top-down view of the vehicle and its surroundings to assist the driver with parking and other low-speedmaneuvers.Automatic high beams use a camera to detect headlights and taillights from other vehicles and automatically switches between low and high beams to better illuminate the road ahead without blinding other drivers.Manufacturers have adopted different names for the technologies listed above. For simplicity, this report uses theterms above when discussing the results for each manufacturer. Some manufacturers offer multiple versions of thesame collision avoidance technology. The marketing name of the collision avoidance technology is included in theseinstances.HLDI Bulletin Vol 37, No. 12 : December 20203
Insurance dataAutomobile insurance covers damages to vehicles and property in crashes and injuries to people involved in crashes.Different insurance coverages pay for vehicle damage versus injuries, and different coverages may apply dependingon who is at fault. This report discusses results for property damage liability (PDL), collision, bodily injury (BI) liability, personal injury protection (PIP), and medical payment (MedPay) coverages. Exposure was measured in insuredvehicle years. An insured vehicle year is one vehicle insured for 1 year, two vehicles insured for 6 months, etc.Collision avoidance technologies may affect different insurance coverage types differently, so it is important to understand how coverages vary among the states and how this affects inclusion in the analyses. Collision coverageinsures against vehicle damage to an at-fault driver’s vehicle sustained in a crash with an object or other vehicle. Thiscoverage is common to all 50 states. PDL coverage insures against physical damage that at-fault drivers cause to otherpeople’s vehicles and property in crashes. This coverage exists in all states except Michigan, where vehicle damage iscovered on a no-fault basis where each insured vehicle pays for its own damage in a crash, regardless of who is at fault.The insurance coverages that deal with injuries are more complicated. BI liability coverage insures against medical,hospital, and other expenses for injuries that at-fault drivers inflict on occupants of other vehicles or other road users. Although motorists in most states may have BI liability coverage, this information was only analyzed for the 33states with traditional tort insurance systems where the at-fault driver has first obligation to pay for injuries. MedPaycoverage also is sold in the 33 states with traditional tort insurance systems and covers injuries to insured drivers andthe passengers in their vehicles, but not injuries to people in other vehicles involved in the crash. The 17 other stateswithout traditional tort insurance systems employ no-fault injury systems where PIP coverage pays up to a specifiedamount for injuries to occupants of involved-insured vehicles, regardless of who is at fault in a collision. The Districtof Columbia has a hybrid insurance system for injuries and was excluded from each injury analysis.Statistical methodsThe HLDI research discussed in this report used regression analysis to quantify the effect of each collision avoidancetechnology on claim frequencies by comparing vehicles equipped with a collision avoidance technology to vehicleswithout the technology. All regression models included a variable that indicated the presence or absence of a collisionavoidance technology for a specific model year, make, and series vehicle. Other covariates included were: calendaryear; model year; garaging state; vehicle density, defined as the number of registered vehicles per square mile; rateddriver age group; rated driver gender; rated driver marital status; deductible range for collision coverage; and ratedrisk. Additional variables indicating the presence of other collision avoidance technologies were included to betterisolate the effect of the collision avoidance technology of interest. Finally, a variable that combined model year andvehicle series was included to control for vehicle design changes that occurred across model years.Claim frequency, defined as the number of claims per 100 or 1,000 insured vehicle years, was modeled using a Poisson distribution, and claim severity, defined as the average loss payment per claim, was modeled using a Gammadistribution. Both variables were modeled using a logarithmic link function. Estimates for overall losses were derivedfrom the claim frequency and claim severity models. Estimates for claim frequency are presented for collision, PDL,BI liability, PIP, and MedPay coverage types. The frequency of BI liability, PIP, and MedPay claims is for all claims,including those that have been paid and those for which money has been set aside for possible payment in the future,known as claims with reserves. Collision claim severity and overall losses under collision coverage are only reportedfor forward collision warning, front AEB, and curve-adaptive headlights because these technologies are enabled byequipment mounted on the front of the vehicle and more vulnerable to damage in a crash (e.g., HLDI 2016; 2017b).The estimated effect of a crash avoidance technology is presented as a percent change. The percent change in an outcome measure was calculated by subtracting 1 from the exponent of the parameter estimate for the crash avoidancetechnology indicator variable and multiplying the resultant by 100. A percent change less than 0 indicated that thecrash avoidance technology was associated with a reduction in the outcome measure, and a value above 0 indicatedthe technology was associated with an increase in the outcome measure. The percent change can be considered statistically significant when the 95 percent confidence interval does not include 0.HLDI Bulletin Vol 37, No. 12 : December 20204
Combined analysis loss resultsA weighted average was calculated to estimate the combined effect of each crash avoidance technology on claimfrequencies under each coverage type across manufacturers and vehicle models and the combined effect of curveadaptive headlights, forward collision warning, and front AEB on collision claim severity and overall losses. Theweights in the average were proportional to the inverse variance of the respective estimates. Estimates with high variance as indicated by large confidence intervals contributed less than estimates with low variance as indicated by smallconfidence intervals. Wider confidence intervals typically reflected cases with less exposure and/or fewer claims. Theweighted average is presented as a percent change.The weighted average only included estimates from manufacturers or vehicle models where HLDI was reasonablycertain that the model estimates were due to the collision avoidance technology of interest. Some manufacturers offered multiple versions of the same collision avoidance technology. For example, two front AEB systems offered byMazda were included: Smart City Brake and Smart City Brake and Forward Obstruction Warning (or FCW). Eachversion of the technology was included in the weighted average. The marketing name was used to differentiate theversions.Linked featuresSome collision avoidance technologies are only available with other technologies, and the effects of each technologyon insurance claim frequencies cannot be separated. However, in some circumstances it is reasonable to assume thatone technology contributes more to a model estimate than another. FCW addresses front-to-rear crashes, whichmake up a much larger proportion of the crash population than crashes addressed by LDW. Jermakian (2011) estimated that FCW was relevant to about 20 percent of crashes reported to police each year, and LDW was only relevantto 3 percent. Likewise, in separate analyses of FCW and LDW, the proportion of police-reported crashes relevant toFCW was twice the size of the proportion that was relevant to LDW (Cicchino, 2017a; 2018a). Note that these studiesexamined different but comparable passenger vehicle populations. Thus, estimates for FCW that include LDW areassumed to mostly reflect the effect of FCW.FCW, front AEB, and ACC are often enabled by the same radar and available together, but, while FCW and front AEBare typically always on (Reagan, Cicchino, Kerfoot, & Weast, 2018), ACC is used at the driver’s discretion. Hence,estimates of FCW or front AEB that also included ACC were assumed to mostly reflect the effect of FCW and/or frontAEB.BSW systems enabled by radar sensors are often only available with RCTA. Backing crashes like those that occur inparking lots make up a small proportion of police-reported crashes (Cicchino, 2017b), but these low-severity eventsare estimated to contribute to around one-fifth of collision and PDL claims (Wells, Gouse, & Williams, 1991). Hence,it is likely that RCTA, when combined with BSW, would result in larger reductions to insurance claim frequenciesthan BSW alone. Future analyses will reconsider whether the weighted estimate for BSW should include systemswhere BSW is paired with RCTA. Throughout this report the presence of additional technologies is noted when anestimate includes a technology other than the one of interest.Some manufacturers only offered collision avoidance technologies in a large bundle of features. For example, thetechnology package for the 2015–17 model year Acura TLX bundled forward collision warning with pedestrian detection, blind spot warning, lane departure warning, lane-keeping assist, and rear cross-traffic alert. Manufacturers of vehicle models where multiple collision avoidance technologies relevant to many different crash types werebundled are discussed separately.HLDI Bulletin Vol 37, No. 12 : December 20205
Predicted prevalence of safety featuresVehicle feature information from HLDI was combined with vehicle registration data from IHS Automotive (formerlyR.L. Polk and Company) to estimate the prevalence of each collision avoidance technology in the registered vehiclefleet for calendar years 2019 and 2024. For calendar year 2019, each model year, make, and series with an availablecollision avoidance technology was weighted by the number of registered vehicles to compute the proportion of allregistered vehicles with a collision avoidance technology. A technology was considered available if it was standardor optional equipment. Thirty-year trends in new vehicle registrations and attrition rates were used to estimate thenumber of vehicle registrations for the 2020 calendar year and each subsequent calendar year in the conventional scenario. On average, new vehicle registrations would increase 1.2 percent each calendar year, and attrition rates woulddecline 0.21 percent each model year under the conventional scenario.The global pandemic caused by COVID-19 is also likely to affect the availability of new vehicles, new vehicle salesand consequently future levels of ADAS penetration. While the full effect of COVID-19 on the economy and vehiclesales, remains to be seen, an alternative scenario (recession scenario) was included to demonstrate how a recessionmay impact the future prevalence of features. This scenario was based on the annual changes to new vehicle registrations from the 2007-09 recession, and the subsequent recovery from 2009-12. Results from this alternative scenario(recession scenario) are presented alongside the traditional scenario where future new vehicle registrations are basedon a 30-year past trend. The future is uncertain, and future new vehicle registrations may behave completely differently from the prior recession. Availability of collision avoidance technology in the 2020 calendar year and eachsubsequent calendar year was estimated several different ways as described in HLDI 2020b. ResultsFigure 1 summarizes the effects of collision avoidance technologies on claim frequencies under five coverage typescombined across manufacturers and vehicle models. The numerical values of the point estimates and the associatedconfidence intervals are shown in Appendix A. Many collision avoidance technologies were associated with reductionsin the frequency of claims under each coverage type, and more than two-thirds of the reductions were statisticallysignificant. There were only two technologies associated with increased claim frequencies. Increased claim frequencieswere estimated for lane departure warning under BI liability coverage and for rear cameras under collision coverage.The increase associated with the rear cameras under collision coverage was the only statistically significant increase.Figure 1: Percent change in claim frequency associated with collision avoidance technologies by coverage -40%HLDI BulletinFCW Vol 37, No. 12 : December ensorsrearcamerarearAEB6
Figure 2 shows the proportion of registered vehicles in the U.S. with various collision avoidance technologies in2019 and the estimated proportion of registered vehicles with the technologies in 2024 under the conventional andrecession scenarios. Under the traditional scenario, most systems are estimated to see increases of over 20 percentage points by 2024. Adaptive headlights are an exception, with an estimated increase in fitment of only 7 percent by2024. Fitment rates are expected to be between 1 percent (adaptive headlights) and 5 percent (front AEB) lower by2024 under the recession scenario compared with the conventional scenario. More than 60 percent of the registeredvehicle population is expected to be equipped with rear cameras by 2024 under both scenarios. Rear parking sensorswould be estimated to approach 50 percent fleet penetration by 2024 under the conventional scenario. Front AEB isestimated to increase from 8 percent of the registered vehicle population in 2019 to between 25 and 30 percent in2024. This increase is associated with a voluntary commitment by vehicle manufacturers, brokered by IIHS and theNational Highway Traffic Safety Administration, to equip vehicles with the feature by 2022.Figure 2: Percent of registered vehicles equipped with various collisionavoidance technologies in 2019 and estimated for 202470%201920242024 (recession)60%50%40%30%20%10%0%HLDI Bulletinrearcamera Vol 37, No. 12 : December eadlights7
Forward collision warning (FCW)Claim frequencyFCW alerts the driver when the system determines that the vehicle is rapidly approaching another vehicle ahead.HLDI examined FCW systems offered on Audi, BMW, General Motors, Honda Accord, Honda Odyssey, MercedesBenz, and Volvo vehicles. Some of the FCW systems were only available with LDW and/or ACC. FCW reduced thefrequency of PDL and collision claims for every manufacturer except BMW (Figure 3). Combined across manufacturers, FCW was associated with a significant 9.0 percent reduction in the frequency of PDL claims and a significant3.1 percent reduction in the frequency of collision claims.Figure 3: Percent change in PDL and collision claim frequency associated withthe presence of %HLDI BulletinAudiBMW(with LDW) Vol 37, No. 12 : December rdOdysseyBenz(with LDW) (with LDW)Touring(with LDW) (with ACC)(with LDW, ACC)Volvo(with ACC,DistanceAlert)weightedaverage8
FCW reduced the frequency of MedPay claims for each manufacturer and reduced the frequency of BI liability andPIP claims for most manufacturers and vehicle models (Figure 4). Across manufacturers the technology was associated with a significant 17.4 percent reduction in the frequency of BI liability claims, a significant 19.6 percent reduction in the frequency of MedPay claims, and a significant 10.0 percent reduction in the frequency of PIP claims.Figure 4: Percent change in BI liability, MedPay, and PIP claim frequency associated with BMW(with zMotorsAccordTouring(with LDW) (with ACC)(with LDW) (with LDW)(with LDW, ACC)Volvo(with ACC,DistanceAlert)weightedaverageCollision claim severity and overall lossesFCW was associated with a reduction in the frequency of vehicle damage claims but not always a reduction in claimseverity. As illustrated in Figure 5, the severity of collision claims for vehicles with FCW increased for some manufacturers and vehicle models but not for others. The difference in claim severity changes for the two Honda Accordsmerits comment. The system described as “Honda Accord (with LDW)” is enabled by a camera-based sensor mounted behind the windshield, while the system described as “Honda Accord Touring (with LDW, ACC)” is enabled by aradar-based sensor mounted in the front grill. The camera-based sensor, due to its location, is much less likely to bedamaged than the radar-based sensor, and, because the camera-based sensor is mounted to the windshield, it wouldlikely be covered under comprehensive coverage and not collision. Forward Collision Warning was associated witha significant 2.1 percent increase in collision claim severity. Overall losses under collision coverage significantly decreased 1.2 percent for vehicles equipped with FCW.Figure 5: Percent change in collision claim severity and overall losses associated with FCW20%claim severityoverall losses10%0%-10%-20%HLDI BulletinAudiBMW(with LDW) Vol 37, No. 12 : December rdOdysseyBenz(with LDW) (with LDW)Touring(with LDW) (with ACC)(with LDW, ACC)Volvo(with ACC,DistanceAlert)weightedaverage9
Front automatic emergency braking (AEB)Claim frequencyFront AEB applies the vehicle’s brakes if the vehicle is rapidly approaching an object ahead and the driver does not respond. HLDI examined front AEB systems offered on Acura, Audi, BMW, General Motors, Honda (Sensing), Mazda,Mercedes-Benz, Nissan, Subaru, and Volvo vehicles. Some front AEB systems were only available with LDW, ACC,fatigue warning, and/or distance alert. Front AEB significantly reduced the frequency of collision claims for Audivehicles with Pre Sense Front City, BMW vehicles with LDW and FCW, General Motors vehicles, Honda Sensingvehicles, Mercedes-Benz vehicles, Nissan vehicles, and Subaru vehicles (Figure 6). Across manufacturers, front AEBwas associated with a significant 3.0 percent reduction in collision claim frequency. Front AEB was also associatedwith a significant 14.4 percent reduction in PDL claim frequency. Across manufacturers, PDL frequency reductionsranged from 3.6 (Audi Pre Sense Front) to 27.3 (BMW with LDW, ACC, FCW).Figure 6: Percent change in PDL and collision claim frequency associated withthe presence of front ACC)HLDI BulletinAudiAudiPre Sense Pre SenseFrontFrontCityBMW(withLDW,FCW) Vol 37, No. 12 : December HondaSensing(withLDW,ACC)MazdaSmartCityBrakeMazda Mercedes- NissanSmartBenzCity(withBrakeACC)(withFCW, ACC)Subaru(withLDW,ACC)Volvo weighted(withaverageLDW,ACC,Distance Alert,Fatigue Warning)10
The presence of front AEB was associated with reductions in the frequency of BI liability claims between 3.3 and 37.4percent for each manufacturer or vehicle model (Figure 7). Reductions in the frequency of MedPay or PIP claimsalso were observed for most manufacturers. When manufacturers were combined front AEB was associated with asignificant 24.4 percent reduction in BI liability claim frequency, a significant 5.7 percent reduction in MedPay claimfrequency and a significant 3.3 percent reduction in PIP claim frequency.Figure 7: Percent change in BI liability, MedPay, and PIP claim frequency associatedwith the presence of front e Sense Pre W,ACC)MazdaSmartCityBrakeMazda Mercedes- NissanSmartBenzCity(withBrakeACC)(withFCW, ACC)Subaru(withLDW,ACC)Volvo weighted(withaverageLDW,ACC,Distance Alert,Fatigue Warning)Collision claim severity and overall lossesFront AEB had inconsistent effects on collision claim severity and overall losses across each manufacturer and vehiclemodel (Figure 8). Front AEB did not significantly reduce collision claim severity. Front AEB significantly reduced overall losses under collision coverage by 2.9 percent.Figure 8: Percent change in collision claim severity and overall losses associated with thepresence of front AEB20%claim severityoverall losses10%0%-10%-20%-30%Acura(withACC)HLDI BulletinAudiAudiPre Sense Pre SenseFrontFrontCityBMW(withLDW,FCW) Vol 37, No. 12 : December HondaSensing(withLDW,ACC)MazdaSmartCityBrakeMazda Mercedes- NissanSmartBenzCity(withBrakeACC)(withFCW, ACC)Subaru(withLDW,ACC)Volvo weighted(withaverageLDW,ACC,Distance Alert,Fatigue Warning)11
Curve-adaptive headlightsClaim frequencyCurve-adaptive headlights are designed to help drivers see better at night on straight and curved
This approach was used to analyze collision avoidance technologies for Subaru and some Honda vehicles. Collision avoidance technologies This report summarizes the most recent HLDI results for the following collision avoidance technologies: Forward collision warning (FCW) mitigates frontal crashes by using sensors like cameras or radar to detect when the vehicle is getting too close to the one .