Transcription
Oracle Fusion MiddlewareUnderstanding Stream AnalyticsE93172-03April 2019
Oracle Fusion Middleware Understanding Stream Analytics,E93172-03Copyright 2018, 2019, Oracle and/or its affiliates. All rights reserved.Primary Author: Oracle CorporationThis software and related documentation are provided under a license agreement containing restrictions onuse and disclosure and are protected by intellectual property laws. Except as expressly permitted in yourlicense agreement or allowed by law, you may not use, copy, reproduce, translate, broadcast, modify,license, transmit, distribute, exhibit, perform, publish, or display any part, in any form, or by any means.Reverse engineering, disassembly, or decompilation of this software, unless required by law forinteroperability, is prohibited.The information contained herein is subject to change without notice and is not warranted to be error-free. Ifyou find any errors, please report them to us in writing.If this is software or related documentation that is delivered to the U.S. Government or anyone licensing it onbehalf of the U.S. Government, then the following notice is applicable:U.S. GOVERNMENT END USERS: Oracle programs, including any operating system, integrated software,any programs installed on the hardware, and/or documentation, delivered to U.S. Government end users are"commercial computer software" pursuant to the applicable Federal Acquisition Regulation and agencyspecific supplemental regulations. As such, use, duplication, disclosure, modification, and adaptation of theprograms, including any operating system, integrated software, any programs installed on the hardware,and/or documentation, shall be subject to license terms and license restrictions applicable to the programs.No other rights are granted to the U.S. Government.This software or hardware is developed for general use in a variety of information management applications.It is not developed or intended for use in any inherently dangerous applications, including applications thatmay create a risk of personal injury. If you use this software or hardware in dangerous applications, then youshall be responsible to take all appropriate fail-safe, backup, redundancy, and other measures to ensure itssafe use. Oracle Corporation and its affiliates disclaim any liability for any damages caused by use of thissoftware or hardware in dangerous applications.Oracle and Java are registered trademarks of Oracle and/or its affiliates. Other names may be trademarks oftheir respective owners.Intel and Intel Xeon are trademarks or registered trademarks of Intel Corporation. All SPARC trademarks areused under license and are trademarks or registered trademarks of SPARC International, Inc. AMD, Opteron,the AMD logo, and the AMD Opteron logo are trademarks or registered trademarks of Advanced MicroDevices. UNIX is a registered trademark of The Open Group.This software or hardware and documentation may provide access to or information about content, products,and services from third parties. Oracle Corporation and its affiliates are not responsible for and expresslydisclaim all warranties of any kind with respect to third-party content, products, and services unless otherwiseset forth in an applicable agreement between you and Oracle. Oracle Corporation and its affiliates will not beresponsible for any loss, costs, or damages incurred due to your access to or use of third-party content,products, or services, except as set forth in an applicable agreement between you and Oracle.
ContentsPreface12AudienceviDocumentation AccessibilityviRelated DocumentsviConventionsviiOverview of Oracle Stream AnalyticsAbout Oracle Stream Analytics1-1Why Oracle Stream Analytics?1-2How Does Oracle Stream Analytics Work?1-2Getting to Know Artifacts in Oracle Stream AnalyticsUnderstanding Different Types of Connections2-1Understanding Streams2-2Understanding References2-2Understanding Geo Fences2-3What is a Manual Geo Fence?2-3What is a Database-based Geo Fence?2-3Understanding Pipelines2-3Understanding Dashboards2-4Understanding Cubes2-4Understanding Stream Analytics Patterns2-5What is the Spatial: Speed Pattern?2-6What is the Geo Code Pattern?2-6What is the Interaction: Single Stream Pattern?2-6What is the Interaction: Two Stream Pattern?2-6What is the Spatial: Point to Polygon Pattern?2-7What is the Proximity: Single Stream Pattern?2-7What is the Proximity: Two Stream Pattern?2-7What is the Proximity: Stream with Geo Fence Pattern?2-7What is the Direction Pattern?2-7iii
3What is the Geo Fence Pattern?2-7What is the Geo Fence Filter: Inside Pattern?2-8What is the Reverse Geo Code: Near By Pattern?2-8What is the Reverse Geo Code: Near By Place Pattern?2-8What is the Correlation Pattern?2-8What is the Quantile Pattern?2-8What is the Detect Duplicates Pattern?2-8What is the Change Detector Pattern?2-8What is the W Pattern?2-9What is the ‘A’ Followed by ‘B’ Pattern?2-9What is the Top N Pattern?2-9What is the Bottom N Pattern?2-9What is the Up Trend Pattern?2-9What is the ‘A’ Not Followed by ‘B’ Pattern?2-10What is the Down Trend Pattern?2-10What is the Union Pattern?2-10What is the Fluctuation Pattern?2-10What is the Inverse W Pattern?2-10What is the Eliminate Duplicates Pattern?2-10What is the Detect Missing Heartbeat Pattern?2-11What is the Left Outer Join Pattern?2-11Understanding Shapes2-11Understanding Target2-11Understanding the Predictive Model2-11Understanding Custom JARs2-12Understanding Export and Import2-12Overview of the Components of a PipelineUnderstanding Query Stage3-1What is Filter?3-2What is Correlation?3-2What is Summary?3-2What is Group By?3-2What is Range?3-3What is Evaluation Frequency?3-4Understanding Rules3-4Understanding Rule Stage3-4Understanding Pattern Stage3-5Understanding Custom Stage3-5Understanding Scoring Stage3-5iv
Understanding Query Group3-5What is Query Group Stage: Stream?3-5What is Query Group Stage: Table?3-5Understanding the Live Output Table3-6Understanding Visualizations3-7What is a Bar Type of Visualization?3-8What is a Line Type of Visualization?3-8What is An Area Type of Visualization?3-8What is a Stacked Bar Type of Visualization?3-8What is a Spatial Type of Visualization?3-8What is a Pie Chart?3-9What is a Bubble Chart?3-9What is a Thematic Map?3-9What is a Scatter Chart?3-9Understanding the Topology Viewer3-9What is Immediate Family?3-9What is Extended Family?3-10Understanding Expression Builder Functions3-10What are Bessel Functions?3-11What are Conversion Functions?3-11What are Date Functions?3-12What are Geometry Functions?3-12What are Interval Functions?3-13The YM Interval Functions3-13What are Math Functions?3-14What are Null-related Functions?3-16What are Statistical Functions?3-16What are String Functions?3-18v
PrefacePrefaceUnderstanding Oracle Stream Analytics describes what is Oracle Stream Analyticsand how it works. It explains the artifacts and components of a Stream Analyticspipeline.Topics: Audience Documentation Accessibility Related Documents ConventionsAudienceThis document is intended for users who are looking to build pipelines in OracleStream Analytics.Documentation AccessibilityFor information about Oracle's commitment to accessibility, visit the OracleAccessibility Program website at http://www.oracle.com/pls/topic/lookup?ctx acc&id docacc.Accessible Access to Oracle SupportOracle customers who have purchased support have access to electronic supportthrough My Oracle Support. For information, visit http://www.oracle.com/pls/topic/lookup?ctx acc&id info or visit http://www.oracle.com/pls/topic/lookup?ctx acc&id trs if you are hearing impaired.Related DocumentsDocumentation for Oracle Stream Analytics is available on Oracle Help Center.Also see the following documents for reference: Understanding Oracle Stream Analytics Quick Installer for Oracle Stream Analytics Known Issues in Oracle Stream Analytics Spark Extensibility for CQL in Oracle Stream Analytics Using Oracle Stream Analyticsvi
PrefaceConventionsThe following text conventions are used in this document:ConventionMeaningboldfaceBoldface type indicates graphical user interface elements associatedwith an action, or terms defined in text or the glossary.italicItalic type indicates book titles, emphasis, or placeholder variables forwhich you supply particular values.monospaceMonospace type indicates commands within a paragraph, URLs, codein examples, text that appears on the screen, or text that you enter.vii
1Overview of Oracle Stream AnalyticsOracle Stream Analytics allows for the creation of custom operational dashboards thatprovide real-time monitoring and analyses of event streams in an Apache Spark basedsystem. Oracle Stream Analytics enables customers to identify events of interest intheir Apache Spark based system, execute queries against those event streams in realtime and drive operational dashboards or raise alerts based on that analysis. OracleStream Analytics runs as a set of native Spark pipelines.Topics: About Oracle Stream Analytics Why Oracle Stream Analytics? How Does Oracle Stream Analytics Work?About Oracle Stream AnalyticsStream Analytics is an in-memory technology for real-time analytic computations onstreaming data. The streaming data can originate from IoT sensors, web pipelines, logfiles, point-of-sale devices, ATM machines, social media, or from any other datasource. Oracle Stream Analytics is available as a managed service in Oracle Cloudand as an on premises installation.Oracle Stream Analytics is used to identify business threats and opportunities byfiltering, aggregating, correlating, and analyzing high volume of data in real time.More precisely, Oracle Stream Analytics can be used in the following scenarios: Build complex event processing pipelines by blending and transforming data fromdisparate transactional and non-transactional sources. Perform temporal analytics based on time and event windows. Perform location-based analytics using built-in spatial patterns. Detect patterns in time-series data and execute real-time actions. Build operational dashboards by visualizing processed data streams. Use Machine Learning to score current event and predict next event. Run ad-hoc queries on results of processed data streams.Some industry specific examples include: Detecting real-time fraud based on incoming transaction data. Tracking transaction losses and margins in real-time to renegotiate with vendorsand suppliers. Improving asset maintenance by tracking healthy operating parameters and proactively scheduling maintenance.1-1
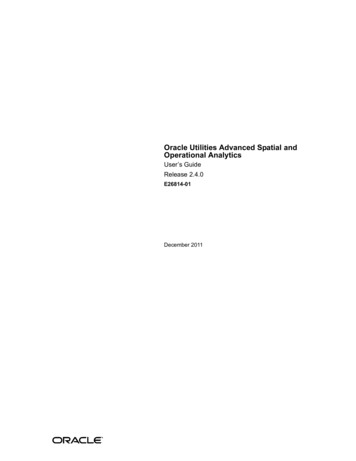
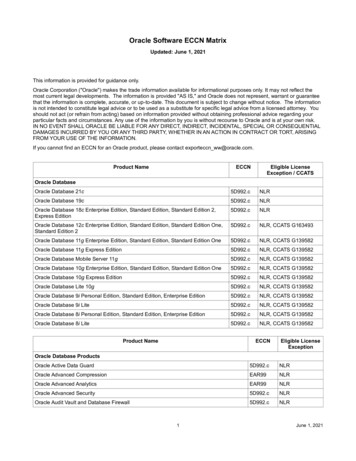
Chapter 1Why Oracle Stream Analytics? Improving margins by continuously tracking demand and optimizing markdownsinstead of randomly lowering prices. Readjusting prices by continuously tracking demand, inventory levels, and productsentiment on social media etc. Marketing and making real-time offers based on customer location and loyalty. Instantly identifying shopping cart defections and improving conversion rates. Upselling products and services by instantly identifying customer’s presence oncompany website. Improving asset utilization by tracking average time it takes to load and unloadmerchandise. Improving turnaround time by preparing dock and staff based on estimated arrivaltime of fleet. Revising schedule estimates based on actual time to enter and exit loading zones,and so on.Why Oracle Stream Analytics?Various reasons and advantages encourage you to use Oracle Stream Analyticsinstead of similar products available in the industry.SimplicityAuthor powerful data processing pipelines using self-service web-based tool in OracleStream Analytics. The tool automatically generates a Spark pipeline along with instantvisual validation of pipeline logic.Built on Apache SparkOracle Stream Analytics can attach to any version-compliant Yarn cluster runningSpark and is first in the industry to bring event-by-event processing to SparkStreaming.Enterprise GradeOracle Stream Analytics is built on Apache Spark to provide full horizontal scale outand 24x7 availability of mission-critical workloads. Automated check-pointing ensuresexact-once processing and zero data loss. Built-in governance provides fullaccountability of who did what and when to the system. As part of management andmonitoring, Oracle Stream Analytics provides a visual representation of pipelinetopology/relationships along with dataflow metrics to indicate number of eventsingested, events dropped, and throughput of each pipeline.How Does Oracle Stream Analytics Work?Stream Analytics starts with ingesting data from Kafka with first-class support forGoldenGate change data capture. Examining and analyzing the stream is performedby creating data pipelines.A data pipeline can query data using time windows, look for patterns, and applyconditional logic while the data is still in motion. The query language used in StreamAnalytics is called Continuous Query Language (CQL) and is similar to SQL. But CQL1-2
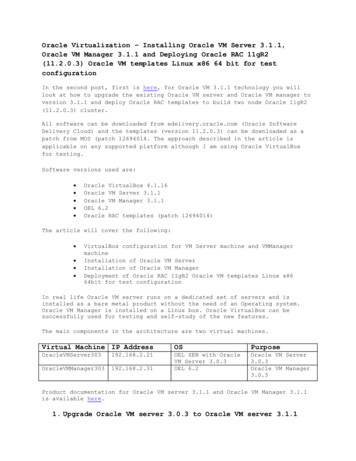
Chapter 1How Does Oracle Stream Analytics Work?includes additional constructs for pattern matching and recognition. Though CQL isdeclarative, there is no need to write any code in Stream Analytics. The web-basedtool automatically generates queries and the Spark Streaming pipeline. Once data isanalyzed and situation is detected, the pipeline can terminate to trigger BPMworkflows in Oracle Integration Cloud or save results into a Data Lake for deeperinsights and intelligence using Oracle Analytics Cloud.The following diagram illustrates the architecture of Stream Analytics:The analyzed data is used to build operational dashboards, trigger workflows, and it’ssaved to Data Lakes for business intelligence and ad-hoc queries.1-3
2Getting to Know Artifacts in Oracle StreamAnalyticsStream Analytics has various artifacts like connections, references, streams, targets,and many more. You create pipelines using these artifacts.Topics Understanding Different Types of Connections Understanding Stream Understanding Reference Understanding Geo Fence Understanding Pipeline Understanding Dashboard Understanding Cube About Stream Analytics Patterns Understanding Shape Understanding Target Understanding PMML Understanding Custom Jar Understanding Export and ImportUnderstanding Different Types of ConnectionsA connection is a very basic artifact and the first entity that you need to create in theCatalog. It is a collection of metadata (such as URLs, credential and the like) requiredto connect to an external system. A connection is the basis for creation of sources(Streams, References or Geo Fences) and Targets.It is possible to reuse the same connection to create multiple sources and/or targets.In other words, it can be reused to access different resources in the same system: forexample different Kafka topics in the same Kafka cluster, or different database tablesin the same Oracle database.Kafka ConnectionA Kafka connection has just a single parameter, the Zookeeper server URL above allthe standard properties (name, description, tags) of catalog objects.The Zookeper URL is of the format host:port. If the port is not provided by the user, thesystem will assume the default Zookeeper port, i.e. 2181. Authentication to Kafka isnot supported in this release.2-1
Chapter 2Understanding StreamsOracle Database ConnectionTo connect to an Oracle database, you must provide the following parameters: Service name/SID hostname port username passwordOracle Coherence ConnectionOracle Stream Analytics can use Oracle Coherence cache as a reference to look updata to enrich a stream that is being processed.JMS ConnectionOracle Stream Analytics can use JMS as a source of streaming data.Understanding StreamsA stream is a source of dynamic data. The data is flowing, it is not static or frozen. Forexample, stock prices of a particular company can be considered as a stream as thedata arrives in every second or even more frequently. Another example of streamingdata is the position (geographical location) of vehicles (e.g. trucks) which again canchange continuously as each vehicle is moving. Each vehicle reports its own positionto a central system periodically, e.g. every second, and the central system receivesthe position messages as a stream.Streams can be transmitted using different network protocols, messaging systems aswell as using many different message formats.To create a Kafka stream, you must create a Kafka connection first, and then selectthat connection in the stream creation wizard. In addition to the connection, the userneeds to specify the Kafka topic that represents the stream of data.Understanding ReferencesA reference is a source of static data that provides contextual information about theevent data. There are several different types of references, such as a reference to adatabase table, or to coherence cache.References are used to enrich data that arrives from a Stream. Referring back to theprevious example, the order stream contains order events and each event contains aproduct Id and a customer Id. Assume that there are two database tables, eachcontaining information about the products and the customers, respectively. Aftercreating two references, one for the products table and one for the customer table,Oracle Stream Analytics can use these references to enrich the incoming streams withinformation from these tables, such as product name, manufacturer, customer name,address, etc.If references take their data from a database table, a caching mechanism can beapplied. (You can use the Coherence cache directly.) By turning on caching (a2-2
Chapter 2Understanding Geo Fencesconfiguration option of the reference), it is possible to add a caching layer in betweenthe pipeline and the database table. This improves the performance of accessing staticdata, at the price of higher memory consumption by the pipeline. Once the data isloaded into cache, the reference fetches data from the cache only. Any update on thereference table does not take effect if expiration policy is set to "Never".Understanding Geo FencesA geo fence is a virtual boundary in a real world geographical area. This virtualboundary can be used to find object position with respect to the geo fence.For example, the object position can be: Near to geo fence Exit geo fence Based on Stay Duration in geo fence Enters geo fence Present inside geo fenceWhat is a Manual Geo Fence?User-created geo fences are called as manual geo fences. You can create, edit, andupdate manual geofence using the built-in map editor. Only polygon geo fences areallowed.What is a Database-based Geo Fence?Geo fences for which you import geometry from database are known as databasebased geo fences. Geo fence geometry can be seen in Geo Fence Editor. Thestandard create, delete and update operations using geo fence editor are not allowedin database-based geo fence. Polygon and circular geo fences are supported.Understanding PipelinesA pipeline defines the pipeline logic and is a sequence of data processing stages. Astage can be one of the following types – Query, Pattern, Rule, Query Group, Custom,Scoring.A pipeline starts with a stream stage, which is the only default stage. You cannotremove the default stage. A stage can have one or more children of any type such asQuery, Pattern, Rule, and so on. That is, the pipeline does not have to be linear. Youcan have multiple branches in accordance with your use case logic. Optionally, abranch can end with one or more targets. You cannot add other stages to a target.You can edit any stage in your pipeline at any time. The changes affectingdownstream stages are propagated automatically.Draft PipelinesPipelines in the draft state possess the following characteristics: Are visible only to the owner2-3
Chapter 2Understanding Dashboards Can be edited Work only when the pipeline editor is open. When you exit the Pipeline editor orclose your browser, the draft pipeline is removed from the Spark cluster. Do not send events to a downstream target even if a target is configuredA newly created pipeline is in draft state. This is where you can explore your streamsand implement the business logic. You do not have to do the implementation all atonce; the pipeline will not run between your editing sessions.Published pipelinesPipelines in the published state possess the following characteristics: Are visible to any user Cannot be edited Will continue to run in the Spark cluster even after you exit the pipeline Send events to a downstream targetAfter you are done with the implementation and satisfied, you can add a target andpublish your pipeline. The published pipeline runs continually on the Spark Cluster.If you want to edit a published pipeline, you must unpublish it first.Understanding DashboardsDashboards are a collection of inter-related visualizations based on a commonunderlying theme. For example, a Sales dashboard shows observations related tovarious sales-related activities such as quarterly sales, prospective customers, and soon. Dashboards enables the users to have a single page view of all the important andcorrelated analysis that provides meaningful insights and assists in the decisionmaking process.A dashboard is first class citizen of the catalog. Any user with appropriate privilegescan build the dashboards just by assembling the outcomes of the different pipelinestages without writing a single line of code. Dashboards display the live data.Oracle Stream Analytics consists of more than one data pipeline stages where eachstages outcome serves as input to the next stage. At the end of every stage,supporting inline visualizations enable you to visualize the result of the active stage. InOracle Stream Analytics, you can visualize the outcome of the various applicationstages at a single place.Combining dashboards with cube, users can create visualizations based on the dataexploration activities performed in the analytics section of Oracle Stream Analytics.You can include these visualizations in the dashboards. With the dashboard feature,user can create mashup like showcases where both operational and analyticsvisualizations are intermixed to present the complete picture of the underlyingbusiness operation.Understanding CubesA cube is a data structure that helps you quickly analyze data related to businessproblems on multiple dimensions. Oracle Stream Analytics cubes are powered byDruid, which is a distributed, in-memory OLAP data store.2-4
Chapter 2Understanding Stream Analytics PatternsOracle Stream Analytics pipelines enable users to perform realtime data processing onthe streaming data. Whereas, cube is the mechanism by which users can performinteractive analysis on the historical data. For this purpose, the pipeline outputs theprocessed data into the Kafka streams which in turn feeds the cube. Using cubes,users can carry out univariate, bivariate, and multivariate data analysis. Cube enablesthe users to carry out data exploration on the historical data with a rich set of 30visualizations. These visualizations ranges from simple table, line, bar to the advancedvisualizations such as sankey, boxplot, maps, and so on. Users can save the result ofthese cube explorations and make them available on dashboards that are embeddedwith Oracle Stream Analystics visualizations. This collaboration of dashboards andcubes serves both operational and strategic analytics needs of the business users.The visualizations available in the cubes also have a rich set of look and feel relatedproperties for enhancing the value of the results of exploratory data analysis.Understanding Stream Analytics PatternsThe visual representation of the event stream varies from one pattern type to anotherbased on the key fields you choose.A pattern provides you with the results displayed in a live output stream based oncommon business scenarios.The following table lists the categories of patterns:CategoryPatternEnrichmentReverse Geo Code: Near ByLeft Outer JoinOutlierFluctuationInclusionUnionLeft Outer JoinMissing Event'A' Not Followed by 'B'Detect Missing EventSpatialProximity: Stream with Geo FenceGeo FenceSpatial: SpeedInteraction: Single StreamReverse Geo Code: Near ByGeo CodeSpatial: Point to PolygonInteraction: Two StreamProximity: Two StreamDirectionReverse Geo Code: Near By PlaceProximity: Single StreamGeo FilterFilterEliminate DuplicatesFluctuation2-5
Chapter 2Understanding Stream Analytics PatternsCategoryPatternState'A' Not Followed by 'B'Inverse WDetect Missing EventW'A' Followed by 'B'FinanceInverse WWTrend'A' Not Followed by 'BTop NChange DetectorUp TrendDetect Missing EventDown Trend'A' Followed by 'B'Detect DuplicatesBottom NShape DetectorInverse WWStatisticalCorrelationQuantileWhat is the Spatial: Speed Pattern?This pattern lets you get the output average speed over the selected window range ofa moving object.What is the Geo Code Pattern?When analyzing data, you may encounter situations where you need to obtain thelatitude and longitude of a moving object based on street address, zip code, address,etc.You can use this pattern to get geographic coordinates (like latitude and longitude) foran address.What is the Interaction: Single Stream Pattern?This pattern lets you get interaction of an object with every other object in the samestream.What is the Interaction: Two Stream Pattern?Two shapes are said to interact with each other if any part of the shape overlaps. Iftwo shapes interact, the distance between them is zero.You can use this pattern to get interaction of an object in one stream with objects inanother stream.2-6
Chapter 2Understanding Stream Analytics PatternsWhat is the Spatial: Point to Polygon Pattern?Using this pattern you can get an object shape based on geographical coordinates,fixed length and breadth of and object.For example, if you know the length and breadth of a ship, you can get the shape orgeofence of the ship using its position coordinates, where the coordinates keepchanging as the ship moves.What is the Proximity: Single Stream Pattern?You can use this pattern to get proximity of each object with every other object in astream.For example, if there is a single stream of flying airplanes and the distance buffer isspecified as 1000 meters, the output in the table shows planes that are less than 1000meters apart.What is the Proximity: Two Stream Pattern?You can use this pattern to get the proximity between objects of two streams.The distance buffer acts as a filter in this pattern stage. For example, if there is a driverand passenger stream, you can get the proximity of each passenger with every otherdriver using a filter criteria of ‘within a distance of 1 km’.What is the Proximity: Stream with Geo Fence Pattern?You can use this pattern to get proximity of an object with a virtual boundary or geofence.For example, if you have certain stores in the city of California, you can sendpromotional messages as soon as the customer comes into a proximity of 1000meters from any of the stores.What is the Direction Pattern?You can use this pattern to get the direction of a moving object.For example, you can evaluate the direction of a moving truck.What is the Geo Fence Pattern?You can use this pattern when you want to track the relation of an object with a virtualboundary called geo fence.Relations can be Enter, Exit, Stay, or Near with respect to a geo fence. For example,you can trigger an alert when an object enters the geo fence. You can also analyze astream containing geo-location data. It helps in determining how events are related toa polygon in a geo fence.The geo-location can be: Near to Geo Fence2-7
Chapter 2Understanding Stream Analytics Patterns Exiting Geo Fence Staying within Geo Fence for a specified duration Entering Geo FenceWhat is the Geo Fence Filter: Inside Pattern?You can use this pattern to track objects inside one or more geo fences.For example, if users move from one geographical location to another, you can sendpromotional messages to the users when they are inside a specified geo fence.What is the Reverse Geo Code: Near By Pattern?You can use this to obtain nearest place for the specified latitude/longitude orgeographical coordinates.What is the Reverse Geo Code: Near By Place Pattern?This pattern lets you obtain the near by location with granular information like city,country, street etc. for the specified latitude and longitude.What is the Correlation Pattern?You can use this pattern if you need to identify correlation between two numericparameters. An output of 0 implies no correlation, 1 is positive correlation, and -1implies negative correlation.What is the Quantile Pattern?You should use this pattern if you need to calculate the value of quantile function. Forexample, when asked for the 3rd quantile of student scores, it could return a value of80 to imply 75% of students scored less than 80.What is the Detect Duplicates Pattern?The Detect Duplicates pattern detects duplicate events in your stream according to thecriteria you specify and within a specified time window. Events may be partially or fullyequivalent to be considered duplicates.You can use this pattern to understand how many duplicate events your stream has.For example, when you suspect that your aggregates are offset, you may want tocheck your stream for duplicate events.What is the Change Detector Pattern?The Change Detector pattern looks for changes in the values of your event fields andreports the changes once they occur within a specified range window. For example,and events arrives with value value1 for field field1. If any of the following incomingevents within a specified range window contains a value different from value1, an alertis triggered. You can designate more than one field to look for changes.2-8
Chapter 2Understanding Stream Analytics PatternsYou can use it when you need to be aware of changes in a normally stable value. Forexample, a sensor reading that is supposed to be the same for certain periods of timeand changes i
Built on Apache Spark Oracle Stream Analytics can attach to any version-compliant Yarn cluster running Spark and is first in the industry to bring event-by-event processing to Spark Streaming. Enterprise Grade Oracle Stream Analytics is built on Apache Spark to provide full horizontal scale out and 24x7 availability of mission-critical workloads.