Transcription
Grid Integration of AggregatedDemand Response, Part 2:Modeling Demand Response ina Production Cost ModelMarissa Hummon, David Palchak,Paul Denholm, and Jennie JorgensonNational Renewable Energy LaboratoryDaniel J. Olsen, Sila Kiliccote, Nance Matson,Michael Sohn, Cody Rose, Junqiao Dudley,and Sasank GoliLawrence Berkeley National LaboratoryOokie MaU.S. Department of EnergyNREL is a national laboratory of the U.S. Department of EnergyOffice of Energy Efficiency & Renewable EnergyOperated by the Alliance for Sustainable Energy, LLCThis report is available at no cost from the National Renewable EnergyLaboratory (NREL) at www.nrel.gov/publications.Technical ReportNREL/TP-6A20-58492December 2013Contract No. DE-AC36-08GO28308
Grid Integration of AggregatedDemand Response, Part 2:Modeling Demand Response ina Production Cost ModelMarissa Hummon, David Palchak,Paul Denholm, and Jennie JorgensonNational Renewable Energy LaboratoryDaniel J. Olsen, Sila Kiliccote, Nance Matson,Michael Sohn, Cody Rose, Junqiao Dudley,and Sasank GoliLawrence Berkeley National LaboratoryOokie MaU.S. Department of EnergyPrepared under Task No. SA12.0384NREL is a national laboratory of the U.S. Department of EnergyOffice of Energy Efficiency & Renewable EnergyOperated by the Alliance for Sustainable Energy, LLCThis report is available at no cost from the National Renewable EnergyLaboratory (NREL) at www.nrel.gov/publications.National Renewable Energy Laboratory15013 Denver West ParkwayGolden, CO 80401303-275-3000 www.nrel.govTechnical ReportNREL/TP-6A20-58492December 2013Contract No. DE-AC36-08GO28308
NOTICEThis report was prepared as an account of work sponsored by an agency of the United States government.Neither the United States government nor any agency thereof, nor any of their employees, makes any warranty,express or implied, or assumes any legal liability or responsibility for the accuracy, completeness, or usefulness ofany information, apparatus, product, or process disclosed, or represents that its use would not infringe privatelyowned rights. Reference herein to any specific commercial product, process, or service by trade name,trademark, manufacturer, or otherwise does not necessarily constitute or imply its endorsement, recommendation,or favoring by the United States government or any agency thereof. The views and opinions of authorsexpressed herein do not necessarily state or reflect those of the United States government or any agency thereof.This report is available at no cost from the National Renewable EnergyLaboratory (NREL) at www.nrel.gov/publications.Available electronically at http://www.osti.gov/bridgeAvailable for a processing fee to U.S. Department of Energyand its contractors, in paper, from:U.S. Department of EnergyOffice of Scientific and Technical InformationP.O. Box 62Oak Ridge, TN 37831-0062phone: 865.576.8401fax: 865.576.5728email: mailto:reports@adonis.osti.govAvailable for sale to the public, in paper, from:U.S. Department of CommerceNational Technical Information Service5285 Port Royal RoadSpringfield, VA 22161phone: 800.553.6847fax: 703.605.6900email: orders@ntis.fedworld.govonline ordering: http://www.ntis.gov/help/ordermethods.aspxCover Photos: (left to right) photo by Pat Corkery, NREL 16416, photo from SunEdison, NREL 17423, photo by Pat Corkery, NREL16560, photo by Dennis Schroeder, NREL 17613, photo by Dean Armstrong, NREL 17436, photo by Pat Corkery, NREL 17721.Printed on paper containing at least 50% wastepaper, including 10% post consumer waste.
ForewordThis report is one of a series stemming from the U.S. Department of Energy (DOE) DemandResponse and Energy Storage Integration Study. This study is a multi-national-laboratory effortto assess the potential value of demand response (DR) and energy storage to electricity systemswith different penetration levels of variable renewable resources and to improve ourunderstanding of associated markets and institutions. This study was originated, sponsored, andmanaged jointly by the Office of Energy Efficiency and Renewable Energy and the Office ofElectricity Delivery and Energy Reliability.Grid modernization and technological advances are enabling resources, such as DR and energystorage, to support a wider array of electric power system operations. Historically, thermalgenerators and hydropower in combination with transmission and distribution assets have beenadequate to serve customer loads reliably and with sufficient power quality, even as variablerenewable generation like wind and solar power become a larger part of the national energysupply. While DR and energy storage can serve as alternatives or complements to traditionalpower system assets in some applications, their values are not entirely clear. This study seeks toaddress the extent to which DR and energy storage can provide cost-effective benefits to the gridand to highlight institutions and market rules that facilitate their use.The project was initiated and informed by the results of two DOE workshops; one on energystorage and the other on DR. The workshops were attended by members of the electric powerindustry, researchers, and policymakers, and the study design and goals reflect theircontributions to the collective thinking of the project team. Additional information and the fullseries of reports can be found at www.eere.energy.gov/analysis/.iiiThis report is available at no cost from the National Renewable Energy Laboratory (NREL) at www.nrel.gov/publications.
AcknowledgmentsThe authors would like to thank the following individuals for their valuable input and commentsduring the analysis and publication process: Mark O’Malley, Brendan Kirby, Elaine Hale, TrieuMai, Nate Blair, Keith Searight, Erik Ela, Chunlian Jin, Di Wu, and Michael Kintner-Meyer.Any errors or omissions are solely the responsibility of the authors.ivThis report is available at no cost from the National Renewable Energy Laboratory (NREL) at www.nrel.gov/publications.
Executive SummaryIntroductionRenewable integration studies have evaluated many challenges associated with deploying largeamounts of variable wind and solar generation technologies. These studies can evaluateoperational impacts associated with variable generation, benefits of improved wind and solarresource forecasting, and trade-offs between institutional changes, including increasingbalancing area cooperation and technical changes such as installing new flexible generation.Demand response (DR) resources present a potentially important source of grid flexibility andcan aid in integrating variable generation; however, integration analyses have not yetincorporated these resources explicitly into grid simulation models as part of a standard toolkitfor resource planners.Part 1 of this report, “Load Availability Profiles and Constraints for the WesternInterconnection,” examines the potential for different types of commercial and residentialbuilding, municipal, and industrial non-manufacturing loads to provide bulk power systemservices [1]. Industrial manufacturing loads were examined and quantified by Starke et al. [2].These include energy, capacity, and operating reserves. Their abilities to provide energy andoperating reserve services are represented by a set of hourly availabilities for each service,including some additional resource constraints specific to individual end-use types. The servicesare defined in Table ES-1. Historically, applications for DR have been limited and used primarilyfor emergencies and peak shaving. As such, their capabilities are often assessed only for a fewselect times of the year. This assessment quantifies the DR resource potential throughout the yearand can thereby be used in scenarios with substantial deviations of electricity supply fromhistorical norms, such as cases with high levels of wind and solar generation.Table ES-1. Description and Physical Requirements of the Products Modeled in This StudyReserves ProductsProductTypeGeneral DescriptionPhysical RequirementsHow FastTime toLength oftoFullyResponseRespondRespondHow Often CalledEnergyShed or shift energyconsumption over time5 minutes 1 hour10minutes1–2 times per daywith 4–8 hournotificationRegulationResponse to randomunscheduled deviations inscheduled net load30secondsEnergyneutral in15minutes5 minutesContinuous withinspecified bid periodFlexibilityAdditional load following5 minutesreserve for large unforecasted wind/solar ramps1 hour20minutesContinuous withinspecified bid period 30minutes 10minutes Once per dayContingency Rapid and immediate1 minuteresponse to a loss in supplyvThis report is available at no cost from the National Renewable Energy Laboratory (NREL) at www.nrel.gov/publications.
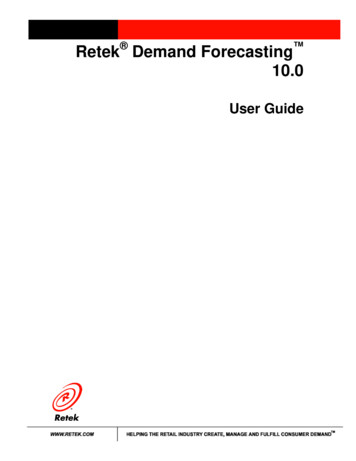
This report (Part 2) implements DR resources in the commercial production cost modelPLEXOS. Production cost models are utility planning tools commonly used in renewableintegration analyses because they can mimic many of the near real-time decisions and conditionsfaced by power system operators. Further, they output a number of useful metrics, such asestimates of different types of operational costs and power plant emissions.The DR resource assessment detailed in Part 1 has been conducted in a large area across thewestern United States. In order to explore the methodology, we model a subset of the westernUnited States, the Colorado test system. The Colorado system has been used in several previousstudies on the performance and value of storage [3] and concentrating solar power [4]. The workdescribed here demonstrates an approach to modeling DR in production cost models and how itsavailability to power system operators can reduce operational costs and improve generatorutilization.ApproachOur approach assumes that DR providers submit their capabilities to power system operators,and subsequently are dispatched to minimize the overall cost of generation in a manner similar toconventional generators but including the various operational constraints of the individual DRresources. It also allows DR resources to provide operating reserves in addition to energy, andthereby be fully co-optimized alongside generators in providing bulk power system services.We assume that DR can provide energy services by either shedding load or shifting its usebetween different times. In addition to energy, the modeling considers DR resources capable ofproviding operating reserves. Operating reserves include frequency regulation, contingencyreserve, and flexibility (or ramping) reserve. Frequency regulation manages short-term variationsin demand due to unpredicted changes in the net of load, wind, and solar generation.Contingency reserve addresses large power plant or transmission line failures. Finally, flexibilityreserve is a proposed service that responds to large and unexpected wind and solar ramp events.Figure ES-1. Residential water heating DR in Public Service of Colorado (upper): Hourly capacityprovision for (a) spring and (b) summer; hourly marginal price of energy and operatingreserves (lower)viThis report is available at no cost from the National Renewable Energy Laboratory (NREL) at www.nrel.gov/publications.
The production cost model runs a chronological hourly simulation of the power system to assessthe operational value of DR. Calculating operational value is approached two ways. First, wecompare the total costs of production between scenarios. By making incremental changes to thesystem, changes to production costs can be attributed to the addition of new resources ordifferences in operational practices. Changes in production costs represent the total operationalvalue to the system as a whole, irrespective of how value is distributed to different entities.Second, we examine the short-run marginal costs of production. In regions served by anindependent system operator or regional transmission organization, marginal costs equate tomarket clearing prices and indicate the expected revenue that resources would earn as marketparticipants. Outside these regions, marginal costs relate to a vertically integrated utility’savoided cost for providing the associated service.ResultsThere are significant variations in the availabilities of different types of DR resources in theColorado test system. Table ES-2 shows that the average availability for energy and operatingreserves as well as the energy available through load shedding during the top 20 load hours(which is a rough estimate for the DR capacity value). The assumed DR resource can provide upto 113 MW of capacity (roughly 2% of peak load) and shift 135 GWh of energy. It can also meetabout 33% of the need for frequency regulation, 19% of spinning contingency reserve, and 85%of flexibility reserve. These numbers represent the annual average response that could beachieved for individual grid services but does not include co-optimization. For DR resources thatcan provide multiple grid services, providing one grid service incurs a lost opportunity forproviding another grid service, which is accounted for by constraining the simulation of DR inthe production cost model.viiThis report is available at no cost from the National Renewable Energy Laboratory (NREL) at www.nrel.gov/publications.
Table ES-2. Availability of Demand Response to Provide Energy, Operating Reserves (Regulation,Contingency, and Flexibility) in the Colorado Test System, and Capacity During the Top 20 Hoursof Greatest DemandDemand ResponseResourceEnergyOperating ReservesMean [MW]Capacity% of ontFlexMean [MW]10.310.310.38.82.523.955.1Residential WaterHeating1.815.71.81.81.81.50.43.41.3Commercial Cooling2.110.70.11.60.20.10.40.68.2Commercial Heating2.23.8-------Commercial Lighting--1330.80.75.8-Commercial Ventilation--1.13.43.40.90.86.6-Municipal Pumping1.72.1------2.1Wastewater Pumping1.51.6------1.5Outdoor rehouses0.20.3------0.3Agricultural Pumping1749.9025.6006.3036.6Data Residential CoolingAll DR ResourcesImplementing these resources into the Colorado test system leads to 7.9 million in totaloperational savings. This is higher than the 5.4 million in total revenue based on what theresources could earn in a market setting. The difference stems largely from price-suppressioneffects, as entry of DR into the market results in lower overall market-clearing prices. Most ofthe revenue comes from the provision of operating reserves, with only 21% coming from energytransactions. This is partly due to the fact that energy provision entails a number of constraintsrelated to the timing of load recovery (which can occur prior to or following a curtailment). Forinstance, thermal loads must maintain temperature tolerances, limiting the time differencebetween a load shed and a load recovery and limiting energy price arbitrage value.viiiThis report is available at no cost from the National Renewable Energy Laboratory (NREL) at www.nrel.gov/publications.
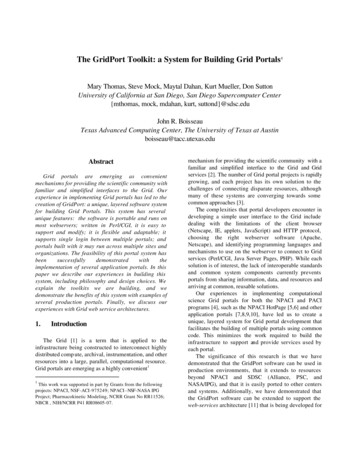
Figure ES-2. Average annual revenue (left axis) from the day-ahead market per (a) total enabledcapacity and (b) annual availability for each type of demand response resource in the Coloradotest system. Annual DR resource availability (right axis) is expressed as the (a) annual availabilityfactor or as (b) total annual availabilityThe value of these resources is driven by their availabilities and the coincidence of theiravailability to times of high production costs. Some resources have a nearly constant availableresponse capacity, while those of others are highly seasonal. For instance, residential coolingavailability, during peak demand hours, is much greater than that of residential water heating, yetthe average availability of residential cooling is less than that of residential water heating.ixThis report is available at no cost from the National Renewable Energy Laboratory (NREL) at www.nrel.gov/publications.
The annual availability factor is the sum of the maximum capacity available during each timeperiod divided by the peak available capacity times the number of time intervals (i.e., total hoursper year). This is similar to capacity factor, which is a measure of the power plant actual energyproduction compared to the possible energy production if the plant operated at maximumcapacity during all time periods. The value of DR, normalized to dollars per peak enabledcapacity ( /kW), closely tracks the availability factor, as shown in Figure ES-2a. Peak-enabledcapacity represents the maximum response capability across all hours of the year.The value of DR can also be measured by the cumulative availability across the year ( /MW-h),as shown in Figure ES-2b. The cumulative availability is the fraction of electricity from anaggregation of end uses that is flexible through DR. This metric reflects the correlation of eachresource’s availability to times of high market prices for operating reserves as well as its abilityto take advantage of large energy price differences across hours of the day. Those resources withlower correlations and more constraints on energy shifting will tend to have lower values on acumulative availability basis. Figure ES-2 only shows the revenue from each grid service, whichneglects other electricity production cost savings such as avoided start-up costs.DiscussionThis study has investigated the abilities of different types of end-use loads to provide bulk powersystem services, including energy, capacity, and operating reserves in the western United States,and then implemented them in a Colorado test system model. Parts 1 and 2 of this report seriesprovide a framework for incorporating DR in renewable integration analysis. However,additional work is necessary to verify many of the study assumptions.Thus far, the analysis has been conducted sequentially, rather than iteratively. First, the resourceassessment has been conducted without full understanding of the economic value of differentresource types. In practice, more valuable resources will have greater incentives to offer theircapabilities to the power system. Second, the resulting commitment and dispatch of the DRresources through the production cost modeling has not been tested against detailed examinationsof the resources’ capabilities. Because we are modeling the aggregate response capabilities ofmany individual providers, it is not clear how many customers need to be enrolled in order tomeet aggregated response utilization or whether the initial assumptions make efficient use ofthose enrolled.Finally, the total operational savings found through the production cost modeling ( 7.9 million)is comparable in size to what the resources might earn as capacity resources. Capacity marketclearing prices and costs for avoided capacity (i.e., the annual carrying cost of a combustionturbine) are in the range of 77/kW-year [5] and 210/kW-year [6]. We assume that DR canprovide 113 MW of capacity, which has a capacity value between 8.7 million and 23.7million. Future efforts will assess the capacity credit of DR and investigate more thoroughlycapacity value alongside operational value.xThis report is available at no cost from the National Renewable Energy Laboratory (NREL) at www.nrel.gov/publications.
Table of Contents123Introduction . 1Production Cost Modeling and Demand Response . 22.1 Production Cost Modeling: Energy and Operating Reserves . 22.2 Modeled Grid Services Provided by Demand Response . 42.3 Modeling Aggregated Demand Response. 52.3.1 Production Cost Modeling Approach . 52.3.2 Simulation of Energy Shifting . 92.3.3 Co-Optimization of Energy and Reserves . 11Results . 133.13.23.33.4Colorado Test System . 13Base Case Results (No DR Resources) . 16Demand Response Resources in the Test System . 17Examples of Demand Response Performance . 213.4.1 Commercial Lighting . 213.4.2 Municipal Wastewater Pumping . 223.4.3 Residential Water Heating . 243.5 Operational Value of Demand Response . 253.5.1 System Value . 253.5.2 Value of Individual DR Products . 284 Conclusion . 35References . 37Appendix . 40Additional Examples of Demand Response Performance in the Test System . 40Residential Cooling. 40Residential Heating . 42Commercial Cooling . 43Commercial Heating . 45Data Centers . 46Agricultural Pumping. 48Municipal Pumping. 49Refrigerated Warehouse. 50Commercial Ventilation . 51Outdoor Lighting . 53Seasonal Daily Average Energy and Reserve Availability and Provision . 54Marginal Price Duration Curves for Reserves. 57xiThis report is available at no cost from the National Renewable Energy Laboratory (NREL) at www.nrel.gov/publications.
List of FiguresFigure 1. Example of the (a) unit commitment and (b) economic energy dispatch from aproduction cost model .3Figure 2. Enabled demand response capacity is defined as the capacity of the end use that isequipped/enrolled to respond to a signal or instruction to reduce load .8Figure 3. Maximum availability of energy, contingency, and flexibility for demand responsefrom commercial cooling resources in Public Service Colorado on August 1–3 .9Figure 4. Example of the (a) total load from an illustrative end use and the portion of that loadavailable for demand response activities and (b) the constrained availability of DRcapacity for charging and generation .10Figure 5. System price duration curve for (a) energy and (b) operating reserves in the basecase of the Colorado test system .16Figure 6. Comparison of the (left axis) hourly capacity available from DR by sector and (rightaxis) hourly system load DR availability is the maximum available from each DR resourceacross the energy and ancillary service markets .21Figure 7. Commercial lighting DR in PSCo: Mean (a) daily and (b) hourly provision ofcapacity .22Figure 8. Commercial lighting DR in PSCo (upper): Hourly capacity provision for (a) springand (b) summer; hourly marginal price of operating reserves (lower) .22Figure 9. Wastewater pumping DR in PSCo: Mean (a) daily and (b) hourly provision ofcapacity .23Figure 10. Wastewater pumping DR in PSCo (upper): Hourly capacity provision for (a) springand (b) summer; hourly marginal price of energy and operating reserves (lower) .23Figure 11. Residential water heating DR in PSCo: Mean (a) daily and (b) hourly provisionof capacity .24Figure 12. Residential water heating DR in PSCo (upper): Hourly capacity provision for (a)spring and (b) summer; hourly marginal price of energy and operating reserves (lower) .25Figure 13. Mean increase in the daily load profile for spring and summer when DR providesenergy. Negative numbers are a reduction in total system load, positive numbers are anincrease in load. .25Figure 14. Reserve provision (a) regulation, (b) contingency, and (c) flexibility for the basecase and when DR resources are available in the system for reserves .26Figure 15. Annual average revenue per unit of generation or reserves for each DR resource .30Figure 16. Average annual revenue (left axis) from the day-ahead market per (a) total enabledcapacity and (b) annual availability for each type of demand response resource in theColorado test system .32Figure 17. Illustration of the DR available capacity, scaled by the enabled rated capacity for(a) residential cooling and (b) residential water heating in the Colorado test system .33Figure 18. Residential cooling demand response in PSCo: Mean (a) daily and (b) hourlyprovision of capacity .41Figure 19. Residential cooling demand response in PSCo: (upper) Hourly capacity provisionfor (a) spring and (b) summer and (lower) hourly marginal price of energy and operatingreserves .41Figure 20. Residential heating demand response in the Northwest: Average (a) daily and (b)hourly provision of capacity; the daily capacity is zero between mid-June and late-August,when residences do not use electricity for heating .42xiiThis report is available at no cost from the National Renewable Energy Laboratory (NREL) at www.nrel.gov/publications.
Figure 21. Residential heating demand response in the Northwest: (upper) Hourly capacityprovision for April 15–April 18 and (lower) hourly marginal price of energy and operatingreserves .43Figure 22. Commercial cooling demand response in PSCo: Mean (a) daily and (b) hourlyprovision of capacity .44Figure 23. Commercial cooling demand response in PSCo: (upper) Hourly capacity provisionfor (a) spring and (b) summer and (lower) hourly marginal price of energy and operatingreserves .44Figure 24. Commercial heating demand response in WACM: Mean (a) daily and (b) hourlyprovision of capacity .
Demand Response, Part 2: Modeling Demand Response in a Production Cost Model Marissa Hummon, David Palchak, Paul Denholm, and Jennie Jorgenson National Renewable Energy Laboratory Daniel J. Olsen, Sila Kiliccote, Nance Matson, Michael Sohn, Cody Rose, Junqiao Dudley, and Sasank Goli Lawrence Berkeley National Laboratory Ookie Ma