Transcription
MARKETOUTLOOK2022
MARKETOUTLOOK2022A message from the CEOExecutive SummaryGlobal TrendsAfricaChina & Asia PacificEurope & CISLatin AmericaMiddle EastNorth AmericaBonus Chapter: Cargo Market Outlook34711152327303337
MESSAGE FROM ARJAN MEIJER“CONNECTIVITY IS AT THE CORE OFGLOBAL TRADE”When the pandemic finallybegan to fade, people hopedthey could relive the good olddays of 2019. Yet the falloutfrom covid is preventing aquick return to those boomtimes. High inflation, supplychain disruptions andstaff shortages are hittingeveryone hard. Aviation isfeeling those effects too,and they’re delaying theindustry’s recovery.Airlines that couldn’t fight thecovid storm perished. Withfewer seats, the escalatingprice of crude oil and jet fuel,huge pent-up demand forair travel, and the UkraineRussia conflict, airfaresbegan to rise. The pilotshortage in the USA and staffshortages in Europe forcedmany flights to be cancelledin high season. That has hadan impact on ticket pricesand is discouraging many3people from flying.Yet air travel connectspeople and is an enginethat drives global trade.Such connectivity powersdevelopment and progress.Fewer people flying producesweaker economic activity andlower growth rates. Right now,airlines have a lot on theirplates. They are restructuringto keep connectivity levelswhile sustaining their marginsby rehiring staff, addinggreener airplanes, andinvesting in training.The global trends in lastyear’s market outlookremain solid: digitalizationand work-from-home aredriving people away from bigurban centers and reducingdemand for corporate travel.Environmental pressuresare stronger than ever, andnew products are beingcreated to achieve net-zeroemission commitments.Regionalization isrestructuring supply chainstrategies. These things areencouraging consumers andindustry players to be moreprudent in how they managetheir resources.This has tremendousimplications for the types ofaircraft that will fly in thisnew, emerging environment.Regional aviation is key inpaving the way for a moresustainable and connectedaviation industry.I hope you enjoy readingour Market Outlook 2022in which we examine thepresent to predict the futuredirection of commercialaviation.Arjan MeijerPresident & CEOEmbraer Commercial Aviation
EXECUTIVESUMMARY
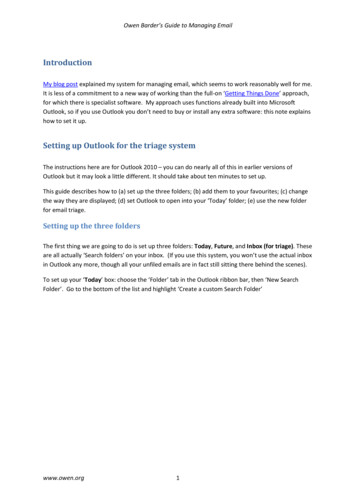
Executive Summary /AIR TRANSPORT DEMAND FORECAST:RPK GROWTH RATES BY REGIONTHE UP TO 150-SEAT MARKETWorld passenger traffic is expected to grow at an average annual rateof 3.2% (CAGR) between its pre-pandemic level at the end of 2019 and2041. The rate is a notable deceleration compared to pre-pandemicgrowth rates for the next two decades, a reflection of the effects ofthe pandemic itself, expected deceleration of the global economy, andeffects of the Russia-Ukraine conflict.We maintain our forecast that global RPKs will return to 2019 levels in2024, driven by a prolonged pandemic recovery period and by changesin industry dynamics.Over the next 20 years, Asia Pacific (including China) will show thestrongest growth rate, increasing its RPKs by 4.3% annually. This will befollowed by Latin America (4.0%), Africa (3.8%), the Middle East (3.2%),Europe (2.3%, including CIS) and North America (2.0%).WORLDWIDE AIR TRANSPORT DEMAND GROWTH: 2019-2041WORLDWIDE AIR TRANSPORT DEMAND GROWTH: 2019-2041CAGR 2019-20403,8%4,0%4,3%3,2%2,0%North America2,3%EuropeMiddle EastAfricaLatin America Asia Pacific& CaribbeanThis information is property of Embraer and cannot be used or reproduced without written etAnalysisSource(s): EmbraerMarket Outlook2022World RPKs will reach 17.3 trillion by 2041. Asia Pacific will be thelargest market by then, with 42% of global traffic. Combined, Europeand North America will generate 38% of total air transport demand.5Embraer foresees world demand for 10,950 new aircraft with up to150-seats over the next 20 years with a market value of USD 650billion. Replacement of ageing aircraft will account for 57% of all newdeliveries while 43% will be used to grow markets.THE JET SEGMENTSmaller aircraft will drive worldwide demand for 8,670 jets up to 150seat capacity. Of these, 42% will support market growth and 58% willreplace ageing aircraft. The trend to smaller aircraft reflects overalllower demand growth, traffic patterns favoring short-haul versus longhaul, an increasing need for flexibility, connectivity, and efficiency, andfleet and network transition to a decarbonized industry through newtechnology.JETS UP TO 150 - NEW DELIVERIES / SHARE OF TOTALWORLDWIDE8,670100%ASIA PACIFIC2,23025.7%EUROPE & CIS2,32026.8%MIDDLEEAST3303.8%LATIN AMERICA7508.7%AFRICA3003.5%NORTH AMERICA2,74031.6%
Executive Summary /THE TURBOPROP SEGMENTShort-haul operations will drive worldwide demand for 2,280turboprops, mostly focused in Asia Pacific, Europe, and NorthAmerica.TP - NEW DELIVERIES / SHARE OF TOTALWORLDWIDE2,280100%ASIA PACIFIC96042.1%EUROPE & CIS50021.9%MIDDLEEAST401.8%LATIN AMERICA1807.9%6AFRICA2008.8%NORTH AMERICA40017.5%
GLOBALTRENDS
Global Trends /THE EMERGENCE OF A NEW AIRTRANSPORT SECTORTHE WORLD CHANGES, AIR TRANSPORT MUST ADAPTThe fallout from the global pandemic is transforming airtransportation. We’re in new territory, again.Today’s air transport system evolved from a profound change in globaldynamics. The rise of China, the fall of the Berlin Wall, and the adventof the Internet created the conditions for globalization to transformthe world economy. A completely new air transport model had to bedeveloped to support the economies of that new environment.In 1992, the U.S. introduced its ‘Open Skies’ policy under which afirst new bilateral was signed with the Netherlands. This removedrestrictions on gateway access in both markets so that any U.S. carrierand any Dutch carrier was permitted to fly between any point in theUSA and any point in the Netherlands. It also removed capacity,frequency and price controls. It paved the way for the creation ofalliances and the development of global hubs. New passengerdemand beyond the hubs completely changed the demand curve.Airlines had to evolve their strategies to the new landscape.An efficient air transport system was essential for regions andcountries to better capture the opportunities of an economy infull transformation. Deregulation was the tool that accelerated theemergence of a new air travel model. In Europe, for example, theLiberalization Act created the opportunity for Low Cost Carriers torapidly expand across the continent.Trends are emerging with new patterns of demand that will giverise to a new air transport model. The forces of regionalization,the opposite of globalization, digitalization of commerce andconsumerism in our daily lives, and the push to greater environmental82020ALLIANCESHUBSLIBERALIZATIONLOW COST AIRLINESA NEW AIR TRANSPORT MODELWILL EMERGEresponsibility in every sector of the economy mark the beginning of anew era in air transport.The Russia-Ukraine conflict has profoundly changed the geopoliticallandscape, contributed to the slowdown of globalization, and furtherdisrupted supply chains. It almost certainly will accelerate the shiftfrom global to regional sourcing that had emerged from the ChinaU.S. trade war and pandemic and climate-related events. Greaterregionalization means that countries will pursue strategic autonomy,prioritizing investment and growth of their own economies. Thateconomic growth depends on an efficient air transport system. Inturn, that efficiency increasingly depends on internal and externalconnectivity.It’s still too early to tell how digitalization will change the worldsocially, economically, and the way we live. Yet we all know howvital the digital world was in helping us endure quarantines andlockdowns. Nearly three years after the pandemic struck, we’reseeing its effects in our daily lives and in business. Corporatetravelers, for example, may not be quick to return to the skies.
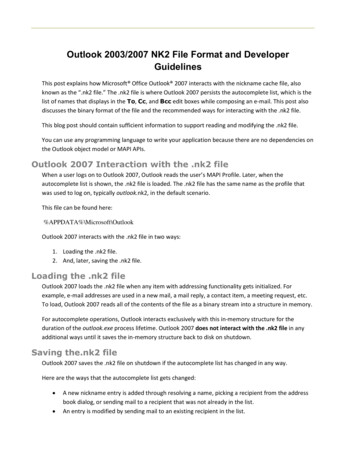
Global Trends /REGIONAL SEGMENT TO LEADTHE TECH REVOLUTIONDespite pent-up demand, companies realized tremendous savingsby replacing travel with digital meetings. Travel is the third-highestcontrollable corporate expense after salaries and sales & marketingcosts. Those savings went straight to the bottom line.Regional Aviation will have a key role in the path to a low-carbonindustry. New programs will tend to focus on smaller capacityaircraft to refine applications for new technologies.But it is the environment that has the most focus among industrystakeholders. The 2050 target is set and there is a clear roadmap toreach emissions and sustainability goals in the medium and long terms.Technology, Air Traffic Control, SAF availability, economic contributions– all of these are mapped yet not all are resolved.HIGH-LEVEL MAP OF THE MOST PROMISING TECHNOLOGIES PER EACH SEGMENT (2025-2050) 100kmThe new post-pandemic environment is leading towards weakerdemand for more expensive air travel. From 2022 to 2030, airlines willneed to adapt their fleet strategies to satisfy the new demand profile,build a path to sustainability, and be ready for a low-carbon future.NEW TRENDS NEW DYNAMIC INDUSTRY TRANSITIONNEW TRENDS NEW DYNAMIC INDUSTRY Requires HigherLevel ofConnectivityDigitalizationNew TravelDynamicsMatch capacityto demandEnvironmentAir Travel willbe moreExpensiveD M x Pa x TbNewDemand CurveA new airtransport modelwill build a pathto sustainable airtravelconnectivityReduced AirTravel DemandD M x P a x T b , where D Demand, M market sizing parameter that represents underlying population and interaction betweencities, P average price of air travel, T total trip time, reflecting changes in frequency, a&b price and time elasticities ofdemand.91-9 PAX 10,000kmrange requirements10-19 PAX20-49 PAX50-99 PAXFull electric100-149 PAX150 PAXWide-bodiesAll of the technologiesto play their part in theregional segmentHybrid-electricThis information is property of Embraer and cannot be used or reproduced without written permission.COMMERCIALAVIATIONHIGH-LEVEL MAP OF THE MOST PROMISINGTECHNOLOGIES PER SEGMENT (2025-2050)COMMERCIALAVIATIONH2 Fuel cell(L)H2 / dual fuel combustion100% Sustainable Alternative FuelsThe current world fleet-in-service is unprepared for the transition tonew technologies. It is dominated by large narrow-bodies. From 2022to 2030, airlines will need to adopt more flexible fleets, adding more80 to 120-seat jets to better match capacity to demand and ensure ahigh degree of network connectivity.This information is property of Embraer and cannot be used or reproduced without written permission.Airlines will need to adapt to serving fewer high-fare businesspassengers by matching capacity to demand while still offering asufficient number of daily flights.
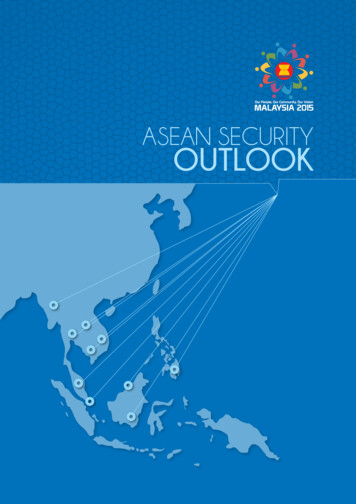
Global Trends /FIS UNPREPARED FOR TECHNOLOGICAL TRANSITIONFIS UNPREPARED FOR TECHNOLOGICALTRANSITIONNetwork adaptationwill be requiredNetwork adaptation will be requiredFISBacklog110832022-2030Fleet adjustments to better connect networks.New aircraft required for a low-carbon future.1138Average 292611282015132219109This information is property of Embraer and cannot be used or reproduced without written permission.COMMERCIALAVIATIONSource: Cirium,2022 Cirium, 2022Source:From 2030 to 2050, new zero-emissions aircraft will be added toairline fleets. Regional aviation will play a key role in operating theseaircraft and will drive the air travel sector to sustainable connectivity.TOWARDS A SUSTAINABLE AIR TRAVELTOWARDS A SUSTAINABLE AIR e AgeSource: Cirium, 202231Source: Cirium, 202210597643TP35 J35J50J80J100J120J140J170J20011282015132219109This information is property of Embraer and cannot be used or reproduced without written permission.COMMERCIALAVIATION
AFRICAChefchaouen, Morocco
Africa // Sustainability in aviation to bring opportunities in Africa: Replacing aging aircraftby more efficient and sustainably powered aircraft is key for Africa to achieve itsnet-zero Economic & Traffic Growth CaribbeanCaribbeanAfrica-AfricaAfrica-AfricaNew Deliveries 2022-2041Up to 150-Seat Jets:TurboProps:200150-210 Seat -EuropeFLEET IN SERVICE - UP TO 1502019:76012AFRICAN ORIGINATED MARKETS PROFILE - %60%50%50%40%40%30%30%20%20%10%10%0%0%Origin & Destination Share (%)/ All set to grow: The up to 150-seat fleet supports achieving healthy loadfactors on thin routes, boosting connectivity with more frequencies, andintroducing new destinations.Between 2010 and 2019, carriers from the Middle East and Europegrew their share and accounted for a high proportion of daily highdensity African O&D traffic flown. A trend to greater regionalizationmay reduce the Africa Europe share. However, geopolitical forcesassociated with the Russia-Ukraine conflict may bring new businessCOMMERCIALopportunities to African countries as Russia seeks export marketsCOMMERCIALAVIATIONAVIATIONbeyond the northern hemisphere.00000 0 0 1 1 -5 5 -10 0 -5 50 -10 00 -30 00 -8 0 0 0a. a. b. 1b. 1- c. 5 . 5-1 d. 10 10- . 50 50-1 100 00-3300 00-h8. 8 . 80chd. e e. f. f. 1 g. g. ers(PDEW)Source: Sabre100%100%90% 90%80% 80%70% 70%60% 60%50% 50%40% 40%30% 30%20% 20%10% 10%0% 0%Origin & Destination Share (%)/ Regional aircraft powers business in Africa: In 2019, 85% of markets withmore than 3 daily frequencies were operated by up to 150-seat aircraft.Since 2010, 94% of new markets with at least one daily frequency werelaunched with aircraft in this same segment.While the global trends of reshoring and deglobalization can reduceAfrican manufacturing jobs, the environmental agenda promotinggreen energy may benefit Africa because of the continent’s abilityproduce hydrogen and solar energy.Origin & Destination Share (%)Origin & Destination Share (%)KEY MESSAGESa.
AFRICAN ORIGINATED2010 MARKETS PROFILE - 2019Africa-Middle EastAfrica-Latin America& CaribbeanAfrica-AfricaAfrica-Asia PacificAfrica-North Americad.10-5005e.0-10Africa-Europe00f. 10-30003g.per day each way Source:(PDEW)Sabre0-80h. 8002019100%90%80%70%60%50%40%30%20%10%1. a0%Origin & Destination Share (%)Origin & Destination Share in & Destination Share (%)Africa-China00000008801-5 . 5-10 10-5 0-10 0-30b.c.05 f. 100 g. 30 0 h. 00de0003-5 11-5 . 5-1-80 . 8000-110a.b. per dayceach00Passengerswayhd. (PDEW)e. 5.f 103g.Passengers per day each way (PDEW)African aviation has enormous potential to grow intra-regionalmarkets in the future. Access to air travel is still not for the masses.Implementation of partnership initiatives on the continent canchange that by opening new routes, with more flight frequencies,more direct flights, and lower fares.The use of small aircraft was borne from Africa’s lack ofinfrastructure. However, the current fleet distribution seems idealfor improving the continent’s connectivity. Of all new marketsestablished in Africa between 2012 and 2019, 54% were operated withaircraft with 150 seats or fewer. That number grows to 84% if only newintra-African markets are considered.In 2019, about 80% of intra-African markets were flown by up to 150seat aircraft. Those same aircraft served 85% of those markets withmore than 3 daily frequencies. By comparison, intra-North Americanumbers were, respectively, 78% and 75%; intra-LATAM 69% and63%; intra-Europe 30% and 44%; and intra-China 30% and 17%.13100%90%80%70%60%50%40%30%20%10%0%a. 1This information is property of Embraer and cannot be used or reproduced without written permission.Africa /COMMERCIALAVIATIONThis information is property of Embraer and cannot be used or reproduced without written permission.0COMMERCIALAVIATIONAIRCRAFTSIZE DOMINANCEIN INTRA-AFRICANMARKETS2019Aircraftsize dominancein Intra-AfricanmarketsUp to 65 seats65-90 seats14790-110 seats110-130 seats114130-150 seats51b.5c.-10-50e.010150-180seats1050d.30-0f. 1Passengers per 180-210day eachseatsway (PDEW)Widebody00003g.0-80h.00 8315531513927190Source: Sabre45 of the 48 new markets opened between 2011 and 2019 with morethan three daily frequencies were flown with up to 150-seat aircraft.Of the new markets with one or more flights, 94 % started operationswith aircraft in that segment.The African commercial fleet is in a sweet spot to transition torenewable-energy powered airplanes because of the average aircraftsize and age. New propulsion technology will initially target regionalaircraft (55% of the total African fleet). 57% of the fleet in thissegment is 21 years of age or older.
COMMERCIALAVIATIONThis information is property of Embraer and cannot be used or reproduced without written permission.NORTH AMERICAAfrica FleetProfileAFRICAFLEETPROFILEAircraft in Service6005004003002001000TPsRJs (Up to90 Seats)CrossoverJets11%43%RJs19%Crossover Jets 150 seats NBWBNB55%15%WB 20 yr old 20 yr old57%Source: Cirium Fleet Analyzer - May, 2022Source: Cirium Fleet Analyzer as of May, ofileAverage AircraftSize SIZEAvrg Acft Size11330010590# Mkts25060293100Source: Sabre14401805001008020015012064a. 1b. 1-3Daily Frequencyc. 3200Avrg Acft Size#Mkts350This information is property of Embraer and cannot be used or reproduced without written permission.COMMERCIALAVIATIONMedina, Morocco
CHINA& ASIA PACIFICHo Chi Minh, Vietnam
China & Asia Pacific /KEY MESSAGES/ GDP and RPK growth forecasts for APAC are one of the strongest until 2041,but the Russia-Ukraine conflict puts recovery at risk, with increasinginflation and further destabilization of supply-chains./ Still immense potential for connectivity: a huge portion of domestic andintra-regional markets remain underserved with less than one dailyflight, while many pockets of growth are still untouched. Companies willneed to rethink their fleet strategy to exploit these opportunities withoutcompromising profit./ To achieve sustainability goals, governments are requiring airlines to furthermaximize operational and fleet fuel efficiency in the short-term, while assertingthe economic importance of connectivity.Economic & Traffic Growth 2019-2041GDPRPK3.6%4.3%New Deliveries 2022-2041Up to 150-Seat Jets:2,230TurboProps:960150-210 Seat NBs:6,765FLEET IN SERVICE - UP TO 1502019:1,768162041:3,346After the vaccine rollout, the world saw more optimistic scenariosthroughout 2022 and forecasted better economic perspectives for thefuture. The sustainability movement has developed clearer goals andstronger momentum, while supply-chains are still fighting to solve theproblems caused by continuous disruptions, evaluating a more ‘justin-case’ strategy instead of the traditional ‘just-in-time.’But what will be the future of Asia-Pacific, the roaring economic tigerthat was chained during the pandemic?A projected 3.6% GDP CAGR between 2019 and 2041 indicates theregion is only behind China in economic potential. Transportationlinks and connectivity are fundamental to satisfy the expected CAGRgrowth in RPKs of 4.3%.The consumer map is being redrawn. Over 3 billion people areprojected to join the consumer class by 2030, gradually spendingmore on leisure, communication, and transportation. E-commercehas grown more than any other retail channel, while already-strongAsian brands gained even more share, which is reinforcing the trendto reshoring and nearshoring. Among all of these trends, governmentsand private companies will face the same challenge: maximizeresiliency, efficiency, and sustainable connectivity.The Russia-Ukraine conflict is dampening recovery with increasingfuel-prices, commodity shortages, airspace restrictions, and puttingfurther pressure on supply chains. For Asia, this is reflected inincreasing inflation and calls for central banks to review monetary,fiscal, climate, and debt policies to reduce stagflation risks.
20161284Sri LankaPakistanMongoliaRussian w ZealandNepalBangladeshThailandCore inflationAirlines in Australia and the Pacific Islands took strategic action toincrease connectivity. They added 100-seat jets to make that capacitysegment the highest growing (26%) since 2019. The number of 70-seatturboprops has more than doubled since 2010, giving passengersbetter access to secondary markets.FLEET IN SERVICE EVOLUTIONCOMMERCIALAVIATIONTarget rangerce: CEIC (accessed on 4Source:March 2022)Central BankCentralBankNews.info.CEICand(accessedon 4News,March2022) and Central Bank News, CentralBankNews.info.e: Inflation and core inflation are for the latest month available between December 2021 and February 2022.Note: Inflation and core inflation are for the latest month available between December 2021 and February 2022.The Asia-Pacific aviation industry has a critical role to play in thischallenge. For a strong economic backbone, domestic marketsmust be rethought, built around a strategy that withstands cyclicalvariations and allows financially healthy growth yet withoutcompromising net-zero emission goals. Because of increaseddigitalization, development of secondary markets and hub-feedingwill be essential to connect the growing number of people livingin urban areas (up to 55% in the coming years). Connectivity isfundamental to the economic power of Asia’s top 250 cities.These new connectivity requirements and opportunities must alsoconsider the necessity for infrastructure improvements. In countriessuch as India and Vietnam, major hubs are becoming heavily17Australia and Pacific IslandsFleet in service evolution250Number of aircraft in service (2010 100%)InflationSingaporeAustraliaRepublic of rated, limiting further market expansion if no regional airportinvestments are to be made. As economies fully recover and themiddle-class increases, the lack of regional infrastructure becomesmore 3201420152016Jets up-to-1502017NB20182019202020212022WBSource: SabreEven with these additions, over 50% of all intra-regional markets stilloffer less than one daily flight, an indication of the untapped potentialof low-density markets. More regional jets and turboprops wouldopen new routes, with lower risk and historically higher yields.This information is property of Embraer and cannot be used or reproduced without written permission.Inflation surpassed targets in many countries in the regionThis information is property of Embraer and cannot be used or reproduced without written permission.INFLATION SURPASSED TARGETS IN MANY COUNTRIES IN THE REGIONPercentageMMERCIALATIONChina & Asia Pacific /
China & Asia Pacific leAverage AircraftSizeSIZEAvrg Acft Size131300# Mkts2502001501000806860327155a. 1120100845014040113Avrg Acft Size#Mkts350200b. 1-3c. 3Daily FrequencyCOMMERCIALAVIATIONDomestic and intra-regional airline traffic increased steadily from2010 to 2019 thanks to the expansion of LCCs, yet connectivity is stillan issue. Over 40% of intra-regional markets have less than one dailyflight served with aircraft with an average of 117 seats. Airlines haveample opportunity to optimize operations. India, as the top economicperformer, should open new routes to connect secondary marketsand bypass congested hubs, adding nonstop flights and frequencieswith higher-yielding fares.ASIAASIA SUB CONTINENT (SAARC)FREQUENCY PROFILE VS AVERAGE AIRCRAFT SIZEFrequency Profile vs Average Aircraft SizeSource: Sabre#Mktsabre MI, 2022Avrg Acft Size250129200# MktsOn sustainability, Australia’s domestic aviation emissions are beingaddressed by safeguard mechanisms and the Emissions ReductionFund. The government’s ERF incentivizes businesses to cut the volumeof greenhouse gases they create through upgrading equipment andimproving productivity. This applies to airlines that could further upgradetheir fleets for newer, more fuel-efficient, right-sized 040Avrg Acft SizeAUSTRALIA & PACIFIC200a. 1b. 1-3c. 30Daily FrequencySource: Sabre MI, 2022SAARCAmong all Asia-Pacific regions, SAARC countries have traditionallyled GDP and RPK growth projections. GDP is projected to grow5.0% CAGR while RPK growth is even more optimistic, 6.4% CAGR,between 2019 and 2041. India, Bangladesh, and Nepal are currentlythe top economic performers.18Source: SabreIndia is taking steps towards SAF production so that it can developpotential markets without compromising the aviation industry’s zeroemissions goals. The country is well-positioned to be a leading SAFproducer given its access to feedstocks and low-cost solar energy.India could get a good head start on economic development andemission reduction. Airports are expected to monitor their carbonemissions and lead the way with green initiatives. Airlines shouldfocus on operational efficiency and a well-developed fleet strategy.This information is property of Embraer and cannot be used or reproduced without written permission.ASIAThis information is property of Embraer and cannot be used or reproduced without written permission.CIAL
China & Asia Pacific /ASEANMany markets are still underserved - over 200 of have less thanone daily flight using an aircraft with an average of 116 seats. Bothsmaller jets and high-capacity turboprops could fully unlock thispotential while increasing operating margins.Air transport has played an important role for ASEAN countries inaccelerating and integrating economies since the Sectoral IntegrationCOMMERCIALProtocol for Air Travel was announced in 2004. Air connectivityAVIATIONpromotes trade and tourism, major economic drivers, which wereASIAheavily impact by restrictions imposed by countries during theSOUTHEAST ASIA (ASEAN)pandemic.FREQUENCY PROFILE VS AVERAGE AIRCRAFT SIZEFrequency Profile vs Average Aircraft Size#Mkts8078767411727010Source: Sabre MI 20196896664862720102011201220132014Yield (cents/km)Source: Sabre1920152016Load Factor (%)20172018201960This information is property of Embraer and cannot be used or reproduced without written permission.YIELDYieldAND ion inINAsia-Pacific# Mkts30012166350OMMERCIALVIATION13Avrg Acft Size400250116200150100127367239294500a. 1b. 1-3c. 3180160140120100806040200Avrg Acft SizeCapacity, measured in ASKs, grew robustly from 2012 (346.92 b)to 2019 (604.19 b). Yields, conversely, declined by 40% in the sameperiod even though load factors remained steady at approximately73.2%.Daily FrequencySource: SabreSustainability targets pose new challenges. The aviation industry isrequired to have higher fuel and flight efficiency by 2030. It mustdevelop decarbonizing technologies in order to transition to 2050’szero-emission goals as described in the ASEAN State of ClimateChange Report.
China & Asia Pacific /Chinadensity markets. Lower demand second and third-tier cities are yetto be targeted.Air travel in China has boomed in the past decade. The numberof new O&Ds in 2019 was 62% higher than in 2010. Moreover, thenumber of high-volume O&Ds (greater than 100 PDEWs) was 149%higher in the same period. However, China adopted a point-to-pointstrategy to expand its air network. Although it may be easier tomanage, point-to-point brings disadvantages in connectivity andsustainability.The Chinese government has been supporting development ofthe western region and expansion of service to markets that sit athigh elevations. These are thin routes that require specific aircraftperformance capabilities. Regional aircraft seem ideal to fly thesenew routes and meet these requirements with high frequency, highpayload, and healthy load factors.b. 5-50%c. 50-95%d. 7%7,6%AfricaAsia PacificSource: SabreChina13,6%16,6%CISEurope6,0%LatinAmerica &Caribbean17,5%Middle East8,6%NorthAmericaO&D Region of OriginCOMMERCIALAVIATION100%Source: SabreChina has focused its efforts on increasing air connectivity locally.Compared to 2010, domestic O&Ds grew 92.5% in 2019 whileinternational O&Ds grew 52.7%. High-volume O&Ds, however,grew evenly (about 150%) for both. From these high-volume O&Ds,domestic markets accounted for 88.4% of the total. Of the remaining11.6%, O&Ds related to Asia Pacific accounted for 73.8%, NorthAmerica 11.7%, Europe 8.4%, and the CIS 3.3%.There is still plenty of room for China to explore thin routes byincentivizing demand in lower-volume PDEW markets. In 2019, about83% of China’s domestic network was concentrated in mid or high-20CHINAChinaDOMESTICPDEW CLASS DISTRIBUTIONIntra-regional PDEW Class Distribution83% of Markets90%h. 80080%g. 300-80070%f. 100-30060%e. 50-10050%40%d. 10-5030%c. 5-1020%b. 1-510%a. 10%China-originating O&Ds across the globe also changed from 2010 to2019. Asia Pacific surpassed North America and Europe to becomethe region with the most O&Ds. Africa and the CIS surpassed LatinAmerica.The four regions with the highest O&D growth were CIS (111%), AsiaPacific (83%), Africa (76%) and Latin America (49%). These werefollowed by the Middle East (36%), North America (34%) and Europe(33%).This information is property of Embraer and cannot be used or reproduced without written permission.Number of O&Dsa. 5%Number of MarketsfliesP2PmoreTHANP2P thanTHEthe restof theOFworldCHINA FLIES ChinaMORERESTTHE WORLDShare of connecting PAX in intra-regional O&Ds:This information is property of Embraer and cannot be used or reproduced without written permission.COMMERCIALAVIATION
China & Asia Paci
Source(s): Embraer Market Analysis THE JET SEGMENT JETS UP TO 150 - NEW DELIVERIES / SHARE OF TOTAL Smaller aircraft will drive worldwide demand for 8,670 jets up to 150-seat capacity. Of these, 42% will support market growth and 58% will replace ageing aircraft. The trend to smaller aircraft reflects overall