Transcription
Understanding and AddressingGlobal Insurance Protection GapsApril 2018
UNDERSTANDING AND ADDRESSING GLOBAL INSURANCE PROTECTION GAPSThe Geneva AssociationThe Geneva Association is the leading international insurance think tank for strategically important insurance and riskmanagement issues. The Geneva Association identifies fundamental trends and strategic issues where insurance playsa substantial role or which influence the insurance sector. Through the development of research programmes, regularpublications and the organisation of international meetings, The Geneva Association serves as a catalyst for progress inthe understanding of risk and insurance matters and acts as an information creator and disseminator. It is the leadingvoice of the largest insurance groups worldwide in the dialogue with international institutions. In parallel, it advances—in economic and cultural terms—the development and application of risk management and the understanding ofuncertainty in the modern economy.The Geneva Association membership comprises a statutory maximum of 90 chief executive officers (CEOs) from theworld’s top insurance and reinsurance companies. It organises international expert networks and manages discussionplatforms for senior insurance executives and specialists as well as policymakers, regulators and multilateral organisations.Established in 1973, The Geneva Association, officially the ‘International Association for the Study of InsuranceEconomics’, is based in Zurich, Switzerland and is a non-profit organisation funded by its Members.www.genevaassociation.org@TheGenevaAssoc
Understanding and AddressingGlobal Insurance Protection GapsKai-Uwe Schanz, Senior Advisor, The Geneva AssociationUnderstanding and Addressing Global Insurance Protection Gaps1
UNDERSTANDING AND ADDRESSING GLOBAL INSURANCE PROTECTION GAPSThe Geneva AssociationTalstrasse 70, CH-8001 Zurich Tel: 41 44 200 49 00 Fax: 41 44 200 49 iation.orgPhoto credits:Cover page—ShutterstockApril 2018Understanding and Addressing Global Insurance Protection Gaps The Geneva AssociationPublished by The Geneva Association (The International Association for the Study of Insurance Economics), Zurich.2www.genevaassociation.org@TheGenevaAssoc
ContentsAcknowledgements4Foreword51. Management summary62. Size and nature of insurance protection gaps92.1. Natural catastrophes92.2. Cyber142.3. Healthcare162.4. Pensions213. Root causes—A comparative analysis253.1. The demand side253.2. The supply side294. Remedies—Towards a multi-stakeholder effort324.1. The contribution of insurers324.2. The role of governments344.3. The role of public-private partnerships (PPPs)365. Conclusions386. References39Understanding and Addressing Global Insurance Protection Gaps3
UNDERSTANDING AND ADDRESSING GLOBAL INSURANCE PROTECTION GAPSAcknowledgementsThis publication is an output of the Protection Gap research programme of The Geneva Association guided by ChristianMumenthaler, Group CEO of Swiss Re, and Markus Riess, CEO of Ergo Group.We are very much indebted to the members of the Working Group that was established in support of our Protection Gapresearch activities, namely: Manuel Aguilera (MAPFRE), Arne Holzhausen (Allianz), Thomas Holzheu (Swiss Re), GiselaPlassmann (Ergo Group) and Clarence Wong (Swiss Re).In addition, we would like to thank Petra Löw from Munich Re NatCatSERVICE for sharing historical data on naturalcatastrophe protection gaps globally and for different country income groups. Based on this data, we were able toperform genuinely original analyses.4www.genevaassociation.org@TheGenevaAssoc
ForewordIn November 2014, The Geneva Association published its maiden research report on ‘TheGlobal Insurance Protection Gap—Assessment and Recommendations’. This report offered asummary of major protection gaps in non-life and life insurance, their root causes as well asrecommendations for potential remedies.Anna Maria D’HulsterSecretary General,The Geneva AssociationThe topic’s relevance is unabated. Risk exposures, driven by digitisation, urbanisation andclimate change as well as value accumulation and concentration, tend to outgrow insurancepremiums, leaving individuals, households, firms and the public sector alike underinsured.It is well documented that on average only one third of economic disaster losses areinsured. In other areas too, from agriculture to term life, people buy less insurance thanis economically beneficial. In addition, the digital transformation of modern economiescreates a major gap between cyber risk exposure and available risk management andtransfer options. The fact that cyber premiums account for less than one per mille of globalinsurance premiums speaks volumes.The root causes and prevalence of insurance protection gaps vary widely across the globe,reflecting different stages of economic development as well as social, institutional andcultural peculiarities. Insurance protection gaps are most striking in developing and emergingmarkets where combined insurance premiums still fall significantly short of these countries’and regions’ share in global GDP.Against this backdrop, The Geneva Association offers an updated quantification of protectiongaps in the areas of natural catastrophe, cyber, healthcare and pension risk. These areas werechosen due to the availability of relatively recent global data. In addition, we put forward acomparative taxonomy of root causes, distinguishing between high-, middle- and low-incomecountries in order to enhance the understanding of insurance protection gaps as a functionof economic stages of development. Finally, we discuss potential remedies and contributionsfrom insurers, governments and private-public partnerships. Insurers have a vital role to playin this mix of solutions—as well-capitalised risk absorbers, as facilitators of cost-efficient risktransfer and diversification, and as enablers of more risk-conscious behaviours.We hope that this publication will encourage stakeholders to discuss insurance protectiongaps and potential remedies in a more holistic way, with a clear view of commonalities anddifferences across various lines of business and country income groups.Understanding and Addressing Global Insurance Protection Gaps5
1. Management summaryThe most appropriate definition of insurance protectiongaps is the difference between the amount of insurancethat is economically beneficial and the amount ofcoverage actually purchased. This gap is smaller than thebroader risk protection gap which describes the differencebetween total losses and insured losses. Defined asabove, the insurance protection gap is hard to measureand subjective. Therefore we replace it by an indicatorcomparing covered loss to total economic loss. This figure,however, needs to be put into perspective, as a certainlevel of risk retention makes economic sense.Protection gaps differ widely in terms of size, nature anddynamics, depending on the line of business and thegeneral maturity of the insurance market. Historically,uninsured natural disaster losses were at the root of theprotection gap discussion and they are still among thosethat make the headlines most frequently and spur themost intense debates.No progress in shrinking the natural catastropheprotection gap in lower income countriesAccording to Munich Re, the natural catastropheprotection gap (uninsured losses as a share of total losses)has narrowed steadily over the past 30 years, from 78 percent to 70 per cent, and from 0.3 per cent to 0.2 per centof the world’s GDP. Despite this gratifying global trend, theprotection gap remains massive, with only about 30 percent of catastrophe losses insured. In addition, this globaltrend masks huge differences between the various countryincome groups. Progress in terms of shrinking the gap hasbasically been limited to high- and upper middle-incomecountries, where the shortfalls decreased markedly by 12and 11 percentage points to their current average levelsof 55 per cent and 86 per cent respectively. Alarmingly,there was hardly any progress in lower middle- andlower-income countries, with protection gaps persisting inexcess of 95 per cent. Those countries remain extremelyvulnerable, with average annual catastrophe-induced GDPexceeding the global average by a significant multiple.Using a Monte Carlo simulation tool for a sample of 30countries and extrapolating the results, Swiss Re projectsthe future protection gap at more than USD 150 billionp.a. or about 0.25 per cent of global GDP.6www.genevaassociation.orgThe cyber protection gap is estimated at about 90 percent—in the face of major hurricane-like economic lossscenariosThe least researched protection gap is cyber risk.Estimating the cost of cyber incidents is challenging.Reported figures are likely to understate the extent ofdamage caused as affected institutions often have neitheran incentive nor an obligation to disclose incidents. Somestudies put the annual global economic cost of cyberincidents at around USD 400 billion, almost 0.5 percent of global GDP and almost twice the average annualamount of natural disaster losses.Current annual gross premiums for global cyber insuranceare estimated at USD 3 to 3.5 billion, about 1.5 permille of global non-life insurance premiums, accordingto Lloyd’s. Swiss Re expects the global cyber insurancemarket to grow briskly to USD 18 billion by 2025;however, this would still be less than 1 per cent of theglobal non-life insurance market. A comparison of thecurrent cumulative global damage from cyber incidentswith today’s cyber premiums generated by the insuranceindustry suggests that virtually all cyber losses remainuninsured and, from a macro perspective, insurance-basedtransfer of cyber risk still lacks any real relevance. Lloyd’srecently attempted to quantify the cyber risk protectiongap, based on modelled economic loss scenarios of upto USD 53 billion (i.e. equivalent to losses from a majorhurricane) and protection gaps of about 90 per cent.Healthcare—out-of-pocket expenses amount to about 2per cent of global GDPIt is even more challenging to quantify the healthcareprotection gap, primarily on account of the institutionaland legal complexity of healthcare systems as well as thehuge differences in the quality and availability of healthcareservices. Out-of-pocket expenses (OOP), i.e. the shareof the expenses that the insured must pay directly to thehealthcare provider, without reimbursement by a thirdparty such as an insurer or the government, can serve as avery rough indicator of healthcare protection gaps. Whenpeople incur copayments or fees for healthcare services, theamount of such OOP expenses in relation to income canreach financially catastrophic proportions for the individualor the household.@TheGenevaAssoc
World Health Organization research shows thatcatastrophic expenditure can occur in all countries at allstages of development. In most OECD countries, healthsystems and financial risk-pooling mechanisms havebeen developed over several decades. Nonetheless, evenin these countries some households are threatened bycatastrophic payments. In general, health systems thatrequire lower OOP provide a higher level of protection tothe poor against catastrophic spending—spending whichremains low in countries where OOP represents less than20 per cent of total national health expenditure.The macroeconomic proportions of OOP are sizeable. Acrossthe various country income groups defined by the WorldBank the GDP share of total national OOP ranges from1.8 to 2.4 per cent. This ratio is just an illustration of thehealthcare protection gap and could even be compared withthe natural catastrophe protection gap’s long-term annualaverage GDP share of 0.3 per cent globally. In light of risinglevels of income per capita and unabated medical inflation,the healthcare protection gap is set to grow further.Some estimates put the global pension savings gap at morethan USD 100 trillion, about 1.5 times the world’s GDPAs funding shortfalls are accumulated over time, theheadline proportions of the ‘pension savings gap' are evenmore staggering. It is defined as the difference betweenthe present value of the yearly lifetime income neededto sustain a reasonable standard of living, and the actualamount that is saved for retirement plus the presentvalue of pay-as-you-go (PAYG) benefits. Based on a targetreplacement rate of 70 per cent, defined as the percentageof a worker's pre-retirement income that is paid out bypension programmes on retirement, Aviva has quantifiedpension savings gaps for the European Union. The gapsshow how much more people retiring between 2017 and2057 would need to save each year to meet the 70 percent target replacement rate level. The analysis suggeststhat European Union citizens may need to save an extraEUR 2 trillion p.a. to close the pension savings gap—equivalent to around 13 per cent of EU GDP in 2016.In 2016, The Geneva Association estimated the globalpension gap to be USD 41 trillion, after taking into accountPillar I (PAYG) entitlements. Excluding any Pillar I benefits,the gap amounts to more than USD 100 trillion.The most recent estimate of current and projected futurepension gaps was undertaken by the World EconomicForum. In 2015, the retirement savings gap for Australia,Canada, China, India, Japan, Netherlands, the U.K. andU.S., based on a 70 per cent income replacement targetlevel, is estimated at around USD 70 trillion (includingPillar I benefits). This gap is roughly equal to 1.5 timesthe 2015 GDP of these countries. Extrapolating this ratioto the rest of the world would yield an illustrative globalpensions savings gap of more than USD 110 trillion.Why individuals and businesses buy less insurance than iseconomically beneficialThe reasons for insurance protection gaps lie with bothdemand- and supply-side factors affecting the demand forand the provision of insurance services. In addition, theyvary for various stages of economic development.On the demand-side, affordability remains a relevantobstacle primarily in developing and emerging insurancemarkets, as shown in this report. In addition, numerousempirical studies suggest that a lack of awareness, as aresult of poor financial literacy or general education, playsan important role in explaining underinsurance, even incountries with higher levels of per-capita income.Product appeal and service quality are of great importance,especially in advanced insurance markets, and they includethe ease of buying insurance cover and the rising customerexpectations in the wake of digitisation.Policyholder trust in the context of insurance protectiongaps is particularly relevant for developing and emergingmarkets, which are frequently characterised by relativelyweak legal and regulatory systems for enforcing paymentof valid claims.Cultural and social factors can also help to understandinsurance protection gaps, ranging from differences in riskaversion to factors attributed to religion, as shown by variousempirical analyses focusing on low-income countries.Behavioural biases are of more general relevance. Morerecently, behavioural factors have emerged as explanationsfor apparent demand anomalies in insurance. One exampleis loss aversion, i.e. individuals being more sensitive to smallUnderstanding and Addressing Global Insurance Protection Gaps7
MANAGEMENT SUMMARYlosses than large gains. In insurance, the premium is acertain and near-term expense, whereas the claim benefitis uncertain and distant and is therefore perceived as apotential loss.However, insurance protection gaps do not only reflectdemand-side issues. Equally important are insurancemarket imperfections that hold back insurance supply.Transaction costs are one of the most prominent examples.In non-life insurance, for example, about 30 cents of eachdollar premium are generally absorbed by distribution andgeneral administrative expenses. Even though it reflectsits complexity, this fact dents the economic appeal ofinsurance, especially in low-income countries.In addition, imperfect and asymmetric information is along-standing feature of today’s insurance markets. Itcan explain insurance protection gaps as it is set to leadto adverse selection, i.e. ‘poor’ risks being more likely topurchase cover. Another structural reason for inefficientinsurance markets is moral hazard, i.e. the probabilityof a person assuming more risks because someoneelse is carrying the cost of those risks. Also, dauntingaccumulation scenarios such as in cyber insurance presentso far unresolved challenges.Furthermore, institutional parameters, such as the legaland regulatory environment, are major determinantsof insurance supply. In many developing and emergingmarkets, the legal environment (e.g. a proper contractlaw) is still weak, and rules are frequently not enforceable.In addition to an effective legal framework, a soundregulatory framework is required to enable a stableinsurance market and protect policyholders.Last but not least, certain risks do not meet the mostfundamental criteria of insurability and are considereduninsurable from a commercial viability point of view.Effective remedies require a concerted effortAny comprehensive and promising approach to narrowinginsurance protection gaps requires a multi-stakeholdereffort. The collaboration of private-sector insurers and localgovernments is of particular importance.The optimal configuration of this multi-stakeholder mixdepends on the maturity of insurance markets and the8www.genevaassociation.orgspecific nature of protection gaps. In advanced economies,there is a limited need but significant capacity for heavygovernment involvement, for example in the full absorptionof natural catastrophe risks. In developing markets, the trendis one of low risk transfer and management capabilities incombination with massive protection gaps. In this case,governments may need to play a strong enabling and guidingrole, albeit against the backdrop of limited fiscal leeway.In general, governments can help improve the availabilityof retail and wholesale insurance by introducingcompulsory schemes which create sufficiently large riskcommunities and risk pools.In addition, many public sector entities are increasinglyutilising new forms of sovereign risk transfer in order torelieve their balance sheets, especially from natural disasterlosses. Countries in Africa, the Caribbean and the Pacifichave always been particularly exposed to extreme weatherevents such as hurricanes, droughts and floods, but inrecent years this exposure has grown further on the back ofpopulation growth, urbanisation dynamics, overexploitationof natural resources, environmental degradation andchanging climate and weather patterns.As a complement to improving risk transfer, protectiongaps also need to be addressed through the prevention andreduction of losses. Government-sponsored building codes,for example, have proved essential for establishing andenforcing risk-reduction measures.Also, in many advanced insurance markets, governmentsstep in as insurers or reinsurers of last resort for certain riskswhich defy the most fundamental criteria of insurability.Under such circumstances government backstop programmescan facilitate private sector insurance solutions which atleast could offer partial coverage, e.g. against catastrophicterrorism and, potentially, cyber security scenarios.Having said all this, insurers have to step up their game.For example, irrespective of an economy’s stage ofdevelopment, digital and mobile technologies can go along way in addressing protection gaps by simultaneouslypromoting affordability, awareness and product appeal. Onthe back of unprecedented data availability and quality,technology also facilitates the product innovation that isgenerally needed to expand risk pools. Technology mightultimately even help to expand the limits of insurability.@TheGenevaAssoc
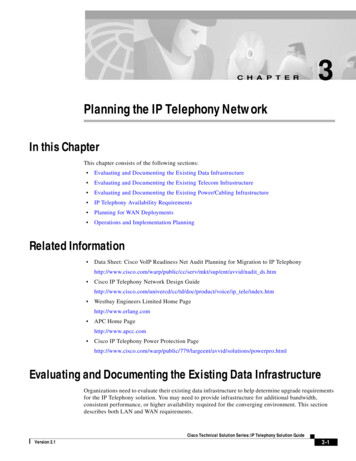
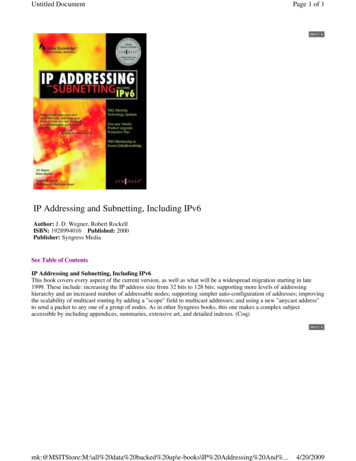
2. Size and nature of insuranceprotection gaps2.1. Natural catastrophesDefining the natural catastrophe protection gapFigure 1: Insured versus uninsured natural catastrophelosses, 1980-2017, in USD billion400In property catastrophe insurance, the overall protectiongap is generally referred to as the share of uninsured lossesto total economic losses. The insurance protection gap,however, is smaller as the full insurance of all economiclosses is neither desirable nor economically plausible.There are rational economic reasons for not fully insuring.Insureds usually retain some risks according to theirrisk appetite, risk bearing capability and cost-efficiencyconsiderations. Individuals may use savings or credit linesas substitutes for insuring high-frequency/low-severitylosses. In addition, Mossin (1968) suggests that it is notoptimal to buy full insurance due to the transaction costs.Furthermore, insurers implement deductibles to mitigatemoral hazard, translating into lower sums insured. Also,institutional factors such as extensive social securitybenefits reduce the need for individuals to take out privateinsurance. Therefore, the most appropriate definition ofinsurance protection gaps is the difference between theamount of insurance that is economically beneficial—taking into account some rational self-insurance oralternative ways of risk transfer—and the amount ofcoverage actually purchased.For the purpose of this study we focus on the propertycatastrophe protection gap only and ignore generalproperty risk, such as fire, water damage, burglary andbusiness interruption.Quantifying the natural property catastropheprotection gapFigure 1 shows the difference between insured andeconomic losses since 1980. In absolute terms, accordingto the Munich Re NatCatSERVICE, the global catastropheprotection gap in the record catastrophe year of 2017amounted to about USD 195 billion, or approximately59 per cent of total economic losses of USD 330 billion,compared with the average value of about 70 per centsince 2000 (see also Figure 3).300200100019801985199019952000200520102015 Overall losses (in 2016 values) Of which insuredSource: Munich Re (2018)A closer examination of the current protection gap byregion and by perilFrom 1980 to 2017, an estimated USD 4.6 trillion ofeconomic losses were recorded globally as a result ofnatural disaster events. About USD 1.2 trillion wereindemnified through insurance and approximately USD3.4 trillion remained uninsured, according to the MunichRe NatCatSERVICE.As revealed by Figure 2, the share of uninsured propertycatastrophe losses varies significantly by region and peril.In Emerging Asia, the protection gap exceeds 90 per centfor all three major perils (storms, floods and earthquakes).In Latin America, the protection gap is most pronouncedfor flood risk. In the mature markets of Western Europe,North America and Japan, storm risk is covered muchmore broadly than the other two perils (see Figure 2).Understanding and Addressing Global Insurance Protection Gaps9
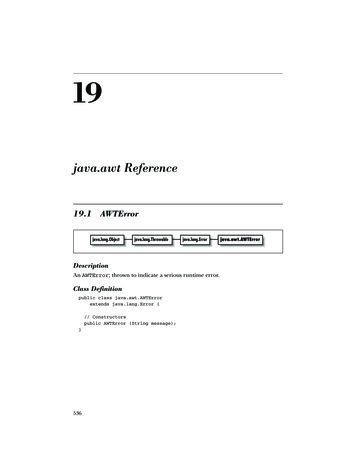
SIZE AND NATURE OF INSURANCE PROTECTION GAPSFigure 2: The average natural catastrophe protection gapby region and peril, aJapanEmergingAsiaLatinAmerica Storm Flood EarthquakeSource: Munich Re NatCatSERVICEFigure 2 shows that the protection gap is a globalphenomenon and not just a developing world issue.Coverage gaps are equally pronounced in many advancedeconomies. The April 2016 Kumamoto earthquakes in theKyushu region of Japan, for example, caused economiclosses of about USD 32 billion, with a protection gap ofUSD 25 billion. The insurance shortfall was even moredramatic in Italy, where the tremors that hit the centralpart of the country in August and October 2016 resultedin combined economic losses of USD 6 billion, of whicha mere 3.4 per cent was insured (Munich Re (2018)). Inthe U.S. too, there are major pockets of underinsurance.For example, just over 10 per cent of homes in Californiahave earthquake insurance. In addition, in 100-year U.S.floodplains, only about half of the homes are insuredagainst floods (Kousky and Kunreuther (2017)).basically limited to high- and upper middle-incomecountries (with GDP per capita of more than USD 12,235;and between USD 3,956 to USD 12,235, respectively, asdefined by the World Bank). These two country groupsrecorded protection gap reductions of 12 and 11 percent, respectively. This major success story does warrantmore dedicated research into its determinants, not leastin order to derive lessons applicable to lower middleand lower-income countries (with a GDP per capitaof USD 1,006 to USD 3,955; and less than USD 1,006,respectively). In these countries there was no progresswhatsoever, with protection gaps stuck at more than 95per cent (see Figure 3).These findings help to understand why global policy effortsin the areas of disaster risk reduction and mitigation focuson lower- and lower middle-income countries.Figure 3: The natural catastrophe protection gap (uninsuredlosses as a share of total losses) for different country incomegroups, 10-year moving averages, 1989-2016100%80%60%40%20%0Low income Lower-middle Upper-middle High incomegroupgroupincome group income groupWorld 1989-1998 1999-2008 2009-2016Economic vulnerability as a function of GDP per capitaSource: Munich Re NatCatSERVICEFigure 3 is based on data from the Munich ReNatCatSERVICE. It illustrates the importance ofdistinguishing between high-, upper middle-, lowermiddle- and low-income countries when discussingnatural catastrophe protection gaps. Globally, the gaphas narrowed steadily over the past three decades from78 to 70 per cent (based on 10-year moving averages).However, gratifying as this trend may be, it does maskhuge differences between income groups in differentcountres. Progress, in terms of shrinking the gap, wasFigure 4 shows, on a logarithmic scale and based on10-year moving averages, the share of uninsured disasterlosses in GDP over the same period of time and for thesame country income groups. Over the past three decades,the share of worldwide uninsured losses in global GDPhas decreased from 0.31 to 0.19 per cent. For high-incomecountries, the share fell from 0.20 to 0.13 per cent. Uppermiddle-income countries show a reduction from 0.21to 0.11 per cent. Lower middle-income countries displayno clear trend, with shares hovering around 1 per cent,10www.genevaassociation.org@TheGenevaAssoc
indicating a significantly higher macro-economic relevanceof uninsured losses compared to wealthier countries. Thisis particularly true for low-income countries, with averageuninsured disaster losses amounting to around 15 percent of GDP in the 1990s and 2000s before showing areduction to about 3 per cent more recently, but this stillshows an enormous degree of vulnerability as a result ofunderinsurance.of building codes and early warning/disaster responsesystems, for example.Figure 4: Uninsured natural catastrophe losses as a share ofGDP for different country income groups, 10-year movingaverages, 1989-2016Figure 5: Average impact of disasters (total losses as a shareof GDP) by region, 1950-2014Latin America and the Caribbean display the highest levelof vulnerability for both small and non-small states. Froman income per capita perspective, upper middle-incomesmall states and low income non-small states are mostvulnerable (see figures 5 and 6).16.5%15.0100.0013.5.Damages GDP (%)Logarithmic scale1210.001.000.1010.59.07.56.04.53.00.011.5Low income Lower-middle Upper-middle High incomegroupgroupincome group income groupWorld0.0Latin America& CaribbeanSouthAsiaEast Asia &Pacific 1989-1998 1999-2008 2009-2016Middle East& NorthAfricaNorthAmericaEurope &CentralAsia Non-small states Small statesSource: Munich Re NatCatSERVICEThe IMF (2016) shows that small developing states aredisproportionately vulnerable to natural disasters. The IMFmembership includes 34 small developing states, categorisedas countries with a population less than 1.5 million thatare not advanced market economies or high-income oilexporting countries (as defined by the World Bank). Abouthalf of the group are lower or lower-middle income states.SubSaharanAfricaSource: IMF (2016)Figure 6: Average impact of disasters (total losses as a shareof GDP) by income per capita, 1950-20041816.515.0Damages GDP (%)13.5.Based on the most widely used database on naturaldisasters (EM-DAT), the IMF calculates that the economiccost of the average natural disaster between 1950 and2014 was equivalent to nearly 13 per cent of GDP for smallstates compared to less than 1 per cent of GDP for largerstates. Natural catastrophes are not only more costly butin some cases also more frequent in small states, partlyreflecting their unfavourable location in the cyclone andhurricane belts on each side of the equator. In addition,if these countries fall into the low-income group, theygenerally lack the scale for the efficient dleincomeLower-middleincomeLow incomeHigh income:non-OECDHighincome:OECD Non-small states Small statesSource: IMF (2016)Understanding and Addressing Global Insurance Protection Gaps11
SIZE AND NATURE OF INSURANCE PROTECTION GAPSProjecting the natural catastrophe protection gapUsing a Monte Carlo simulation tool, Holzheu and Turner(2018) estimate expected losses for a sample of 30 countries,based on information on assets and risks by location.As shown by Figure 7, the world’s biggest economies—the U.S., China and Japan—have the largest expected(modelled) uninsured natural catastrophe risk in absoluteUSD terms. All three countries display large property valuesexposed to peak natural disaster risks such as earthquake,flood and tropical storm.Figure 7: Expected insured and uninsured losses from naturalcatastrophes, in USD billionAnnual expected nat cat property damage wanTurkeyPhilippinesIndonesiaGermanyC
Global Insurance Protection Gap—Assessment and Recommendations'. This report offered a summary of major protection gaps in non-life and life insurance, their root causes as well as recommendations for potential remedies. The topic's relevance is unabated. Risk exposures, driven by digitisation, urbanisation and