Transcription
Q2Quarterly Market ReviewSecond Quarter 2022
Quarterly Market ReviewSecond Quarter 2022This report features world capital market performance and aOverview:timeline of events for the past quarter. It begins with a globaloverview, then features the returns of stock and bond assetMarket Summaryclasses in the US and international markets.World Stock Market PerformanceThe report also illustrates the impact of globally diversifiedportfolios and features a quarterly topic.US StocksInternational Developed StocksEmerging Markets StocksFixed IncomeQuarterly Topic: Three Crucial Lessons forWeathering the Stock Market’s Storm2
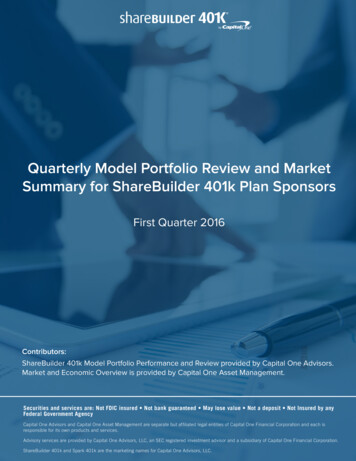
Quarterly Market SummaryIndex returnsUS StockMarketInternationalDevelopedStocksQ2 dMarketex USUS 32.3%4.6%4.6%2020 Q22009 Q22009 Q22009 Q32001 Q32008 Q4-22.8%-23.3%-27.6%-36.1%-5.9%-4.1%2008 Q42020 Q12008 Q42008 Q42022 Q12022 Q1Since Jan. 2001AverageQuarterly ReturnBestQuarterWorstQuarterPast performance is not a guarantee of future results. Indices are not available for direct investment. Index performance does not reflect the expenses associated with the management of an actual portfolio.Market segment (index representation) as follows: US Stock Market (Russell 3000 Index), International Developed Stocks (MSCI World ex USA Index [net dividends]), Emerging Markets (MSCI Emerging Markets Index [netdividends]), Global Real Estate (S&P Global REIT Index [net dividends]), US Bond Market (Bloomberg US Aggregate Bond Index), and Global Bond Market ex US (Bloomberg Global Aggregate ex-USD Bond Index [hedgedto USD]). S&P data 2022 S&P Dow Jones Indices LLC, a division of S&P Global. All rights reserved. Frank Russell Company is the source and owner of the trademarks, service marks, and copyrights related to the RussellIndexes. MSCI data MSCI 2022, all rights reserved. Bloomberg data provided by Bloomberg.3
Long-Term Market SummaryIndex returns as of June 30, 2022US StockMarketInternationalDevelopedStocks1 YearEmergingMarketsStocksGlobalRealEstateUS BondMarketSTOCKSGlobalBondMarketex 1.54%2.66%5 Years10 YearsPast performance is not a guarantee of future results. Indices are not available for direct investment. Index performance does not reflect the expenses associated with the management of an actual portfolio.Market segment (index representation) as follows: US Stock Market (Russell 3000 Index), International Developed Stocks (MSCI World ex USA Index [net dividends]), Emerging Markets (MSCI Emerging Markets Index [netdividends]), Global Real Estate (S&P Global REIT Index [net dividends]), US Bond Market (Bloomberg US Aggregate Bond Index), and Global Bond Market ex US (Bloomberg Global Aggregate ex-USD Bond Index [hedged toUSD]). S&P data 2022 S&P Dow Jones Indices LLC, a division of S&P Global. All rights reserved. Frank Russell Company is the source and owner of the trademarks, service marks, and copyrights related to the RussellIndexes. MSCI data MSCI 2022, all rights reserved. Bloomberg data provided by Bloomberg.4
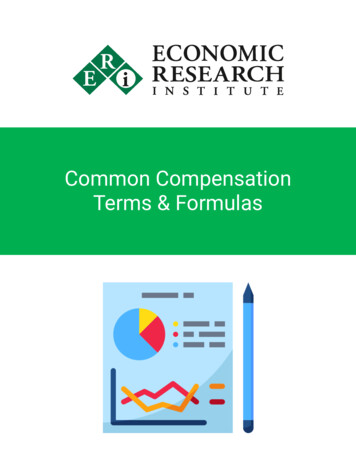
World Stock Market PerformanceMSCI All Country World Index with selected headlines from Q2 20221 YEAR (Q3 2021–Q2 2022)400Last 3months350Q2 2022300Jun 30380Sep 30Dec 31Mar 31Jun 30360340320300Mar 31Apr 30“US GDP Drops 1.4%as Economy Shrinksfor First Time sinceEarly in Pandemic”“Eurozone InflationSoars to 7.5%,Raising Pressureon EuropeanCentral Bank”“Dow Tumbles Nearly1,000 Points asStocks Extend Selloff”“US Mortgage RatesHit 5% for First TimeSince 2011”May 31“US Inflation HitsFour-Decade High;Energy, Food CostsRose Sharply”“Stocks ExtendLosing Streak to5 Weeks”“Fed Lifts InterestRates by HalfPoint in BiggestHike Since 2000”“Europe Moves to Sanction RussiaAgain, Closing In on Oil Embargo”“Stock Market Risesas S&P 500, NasdaqAdd More Than 6%for Week”“CBO ProjectsInflation, EconomicGrowth to Cool ThisYear and Next”“Small BusinessesLose Confidencein US Economy”“US Retail Sales Grew 0.9% in April;Spending Rose for Fourth Straight Month”Jun 30“Markets Post Worst FirstHalf of a Year in Decades”“Fed Raises Rates by 0.75Percentage Point, LargestIncrease Since 1994”“Bond Slide Deepens; 10-Year US TreasuryYield Settles at Highest Level since 2011”“Tech Sector Has Worst Startto a Year since 2002”“Mortgage-Application Index Falls toLowest Level in 22 Years”“World Bank Warns ofStagflation Risk”These headlines are not offered to explain market returns. Instead, they serve as a reminder that investors should view daily events from a long-term perspective and avoid makinginvestment decisions based solely on the news.Graph Source: MSCI ACWI Index [net dividends]. MSCI data MSCI 2022, all rights reserved.It is not possible to invest directly in an index. Performance does not reflect the expenses associated with management of an actual portfolio. Past performance is not a guarantee of future results.5
World Stock Market PerformanceMSCI All Country World Index with selected headlines from past 12 monthsLONG TERM (2000–Q2 2022)400300200Last 12months100SHORT TERM (Q3 2021–Q2 0202022380360340320300Jun 30Sep 30Mar 31“S&P 500 Falls IntoCorrection Territoryas Russian TroopsEnter UkraineRegion”“Biden to Nominate JeromePowell for Second Termas Fed Chairman”“Eurozone InflationHits Decade Highas Bottlenecks Bite”“US Oil Tops 75 forFirst Time since 2018”Dec 31“Nasdaq Drops 2% asInvestors Flee Shares ofHigh-flying Stocks andBond Yields Lurch Higher”“US Orders for DurableGoods Hit a Record”“Stocks Rocket Back toFinish Higher AfterBeing Down at Least1,000 Points”“Fed’s Powell SaysEconomy No Longer NeedsAggressive Stimulus”“In a Wild Year for Markets,Stocks Pull Off Big Gains”Jun 30“US Mortgage RatesHit 5% for FirstTime Since 2011”“Gas Prices ShootUp at FastestRate on Record”“Fed Raises InterestRates for First TimeSince 2018”“US Inflation Reached 7.9% inFebruary; Consumer PricesAre Highest in 40 Years”“Fed RaisesRates by 0.75PercentagePoint, LargestIncreaseSince 1994”“CBO ProjectsInflation,EconomicGrowth to CoolThis Year andNext”“Stocks ExtendLosing Streakto 5 Weeks”“Bond SlideDeepens; 10Year US TreasuryYield Settles atHighest Levelsince 2011”“Mortgage-ApplicationIndex Falls to LowestLevel in 22 Years”These headlines are not offered to explain market returns. Instead, they serve as a reminder that investors should view daily events from a long-term perspective and avoid makinginvestment decisions based solely on the news.Graph Source: MSCI ACWI Index (net dividends). MSCI data MSCI 2022, all rights reserved.It is not possible to invest directly in an index. Performance does not reflect the expenses associated with management of an actual portfolio. Past performance is not a guarantee of future results.6
US StocksSecond quarter 2022 index returnsThe US equity market posted negative returns for theRanked Returns (%)quarter and underperformed both non-US developedand emerging markets.Large ValueValue outperformed growth.-12.21Small ValueSmall caps underperformed large caps.REIT indices underperformed equity market indices.-15.28Large Cap-16.67Marketwide-16.70Small Cap-17.20Small GrowthLarge GrowthWorld Market Capitalization—US-19.25-20.92Period Returns (%)* AnnualizedAsset ClassQTRYTD1 Year3 Years*5 Years*10 Years*Large Value-12.21-12.86-6.826.877.1710.5060%Small Value-15.28-17.31-16.286.184.899.05Large Cap-16.67-20.94-13.0410.1711.0012.82US Market 37.6 Small Cap-17.20-23.43-25.204.215.179.35Small Growth-19.25-29.45-33.431.404.809.30Large Growth-20.92-28.07-18.7712.5814.2914.80Past performance is not a guarantee of future results. Indices are not available for direct investment. Index performance does not reflect the expenses associated with the management of an actual portfolio.Market segment (index representation) as follows: Marketwide (Russell 3000 Index), Large Cap (Russell 1000 Index), Large Value (Russell 1000 Value Index), Large Growth (Russell 1000 Growth Index), Small Cap (Russell2000 Index), Small Value (Russell 2000 Value Index), and Small Growth (Russell 2000 Growth Index). World Market Cap represented by Russell 3000 Index, MSCI World ex USA IMI Index, and MSCI Emerging Markets IMIIndex. Russell 3000 Index is used as the proxy for the US market. Dow Jones US Select REIT Index used as proxy for the US REIT market. Frank Russell Company is the source and owner of the trademarks, service marks,and copyrights related to the Russell Indexes. MSCI data MSCI 2022, all rights reserved.7
International Developed StocksSecond quarter 2022 index returnsDeveloped markets outside of the US posted negativeRanked Returns (%)returns for the quarter, outperforming the US andLocal currencyunderperforming emerging markets.Value outperformed growth.-5.86Value-12.36Small caps underperformed large caps.-8.45Large Cap-14.66-11.37GrowthSmall CapWorld Market Capitalization—International Developed-17.25-11.28-17.94Period Returns (%)Asset Class29%InternationalDeveloped Market 18.1 trillionUS currency* AnnualizedQTRYTD1 Year3 Years*5 Years*10 Years*Value-12.36-11.00-10.281.131.264.42Large 3-23.371.553.616.04Small Cap-17.94-23.87-23.021.972.166.70Past performance is not a guarantee of future results. Indices are not available for direct investment. Index performance does not reflect the expenses associated with the management of an actual portfolio.Market segment (index representation) as follows: Large Cap (MSCI World ex USA Index), Small Cap (MSCI World ex USA Small Cap Index), Value (MSCI World ex USA Value Index), and Growth (MSCI World ex USA GrowthIndex). All index returns are net of withholding tax on dividends. World Market Cap represented by Russell 3000 Index, MSCI World ex USA IMI Index, and MSCI Emerging Markets IMI Index. MSCI World ex USA IMI Index is usedas the proxy for the International Developed market. MSCI data MSCI 2022, all rights reserved. Frank Russell Company is the source and owner of the trademarks, service marks, and copyrights related to the Russell Indexes.8
Emerging Markets StocksSecond quarter 2022 index returnsEmerging markets posted negative returns for theRanked Returns (%)quarter, outperforming the US and non-USLocal currencydeveloped markets.US currency-7.38Value outperformed growth.Value-10.83-8.07Small caps underperformed large caps.Large Cap-11.45-8.74Growth-12.04-12.30Small CapWorld Market Capitalization—Emerging Markets-16.41Period Returns (%)Asset Class* AnnualizedQTRYTD1 Year3 Years*5 Years*10 Years*12%Value-10.83-13.89-18.59-0.971.251.46Large Cap-11.45-17.63-25.280.572.183.06EmergingMarkets 7.4 trillionGrowth-12.04-21.07-31.181.882.924.54Small Cap-16.41-20.03-20.725.783.484.31Past performance is not a guarantee of future results. Indices are not available for direct investment. Index performance does not reflect the expenses associated with the management of an actual portfolio.Market segment (index representation) as follows: Large Cap (MSCI Emerging Markets Index), Small Cap (MSCI Emerging Markets Small Cap Index), Value (MSCI Emerging Markets Value Index), and Growth (MSCIEmerging Markets Growth Index). All index returns are net of withholding tax on dividends. World Market Cap represented by Russell 3000 Index, MSCI World ex USA IMI Index, and MSCI Emerging Markets IMI Index. MSCIEmerging Markets IMI Index used as the proxy for the emerging market portion of the market. MSCI data MSCI 2022, all rights reserved. Frank Russell Company is the source and owner of the trademarks, service marks,and copyrights related to the Russell Indexes.9
Fixed IncomeSecond quarter 2022 index returnsInterest rates increased across all maturitiesin the US Treasury market for the quarter.The yield on the 5-Year US Treasury Noteincreased 59 basis points (bps) to 3.01%. Theyield on the 10-Year US Treasury Noteincreased 66 bps to 2.98%. The yield on the30-Year US Treasury Bond increased 70 bpsto 3.14%.On the short end of the yield curve, the1-Month US Treasury Bill yield increased 111bps to 1.28%, while the 1-Year US TreasuryBill yield increased 117 bps to 2.80%. Theyield on the 2-Year US Treasury Noteincreased 64 bps to 2.92%.In terms of total returns, short-term corporatebonds returned -1.94% and intermediate-termcorporate bonds returned -3.92%.1The total return for short-term municipal bondswas 0.08% and -1.30% for intermediate-termmunicipal bonds. Within the municipal fixedincome market, general obligation bondsoutperformed revenue bonds, returning-2.51% vs. -3.37%, respectively.2US Treasury Yield Curve (%)Bond Yield Across Issuers (%)Yield to MaturityYield to 033.552.983.041.000.001Y5Y10Y30Y10-Year USTreasuryState andLocalMunicipalsAAA-AACorporatesPeriod Returns (%)Asset ClassA-BBBCorporates*AnnualizedQTRYTD1 Year3 Years** 5 Years** 10 Years**ICE BofA US 3-Month Treasury Bill Index0.100.140.170.631.110.64ICE BofA 1-Year US Treasury Note Index-0.48-1.27-1.440.531.100.73FTSE World Government Bond Index 1-5 Years (hedged to USD)-0.95-3.30-3.790.041.081.22Bloomberg Municipal Bond Index-2.94-8.98-8.57-0.181.512.38FTSE World Government Bond Index 1-5 Years-4.28-7.69-9.90-2.02-0.57-1.05Bloomberg U.S. Aggregate Bond Index-4.69-10.35-10.29-0.930.881.54Bloomberg U.S. TIPS Index-6.08-8.92-5.143.043.211.73Bloomberg U.S. High Yield Corporate Bond 42-2.940.501.65Bloomberg U.S. Government Bond Index Long1. Bloomberg US Corporate Bond Index.2. Bloomberg Municipal Bond Index.One basis point (bps) equals 0.01%. Past performance is not a guarantee of future results. Indices are not available for direct investment. Index performance does not reflect the expenses associated with the management of anactual portfolio. Yield curve data from Federal Reserve. State and local bonds, and the Yield to Worst are from the S&P National AMT-Free Municipal Bond Index. AAA-AA Corporates represent the ICE BofA US Corporates, AAAAA rated. A-BBB Corporates represent the ICE BofA Corporates, BBB-A rated. Bloomberg data provided by Bloomberg. US long-term bonds, bills, inflation, and fixed income factor data Stocks, Bonds, Bills, and Inflation (SBBI)Yearbook , Ibbotson Associates, Chicago (annually updated work by Roger G. Ibbotson and Rex A. Sinquefield). FTSE fixed income indices 2022 FTSE Fixed Income LLC, all rights reserved. ICE BofA index data 2022 ICEData Indices, LLC. S&P data 2022 S&P Dow Jones Indices LLC, a division of S&P Global. All rights reserved.10
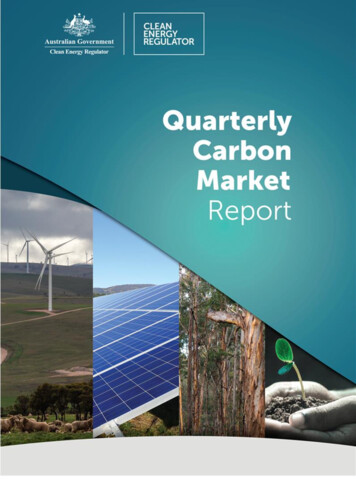
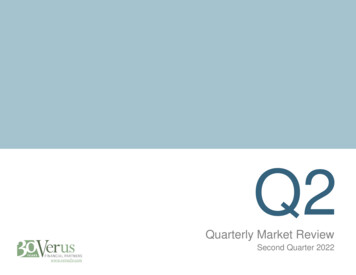
Three Crucial Lessons for Weatheringthe Stock Market’s StormSecond Quarter 2022Marlena Lee, PhDGlobal Head of Investment SolutionsInvestors can always expect uncertainty. While volatile periods like the one we’reexperiencing now can be intense, investors who learn to embrace uncertainty mayoften triumph in the long run. Reacting to down markets is a good way to derailprogress made toward reaching your financial goals.1. A recession is not a reason to sellAre we headed into a recession? A century of economic cycles teaches us we maywell be in one before economists make that call.But one of the best predictors of the economy is the stock market itself. Markets tendto fall in advance of recessions and start climbing earlier than the economy does. Asthe below shows, returns have often been positive while in a recession.Here are three lessons to keep in mind during periods of volatility that can help youstick to your well-built plan. And if you don’t have a plan, there’s a suggestion forthat too.Growth of 100, 1926–2021 1,000,000 100,000 10,000 1,000 1001926 192919371945 194819531957 1960196919731980 19811990200120072020Past performance is no guarantee of future results.In US dollars. Recessions shaded in green. Stock returns represented by Fama/French Total US Market Research Index, provided by Ken French and available data library.html. This value-weighed US market index is constructed every month, using all issues listed on the NYSE, AMEX, or Nasdaq withavailable outstanding shares and valid prices for that month and the month before. Exclusions: American depositary receipts. Sources: CRSP for value-weighted US market return. Rebalancing:Monthly. Dividends: Reinvested in the paying company until the portfolio is rebalanced. Growth of wealth shows the growth of a hypothetical investment of 100 in the securities in theFama/French US Total Market Research Index from July 1926 through December 2021.11
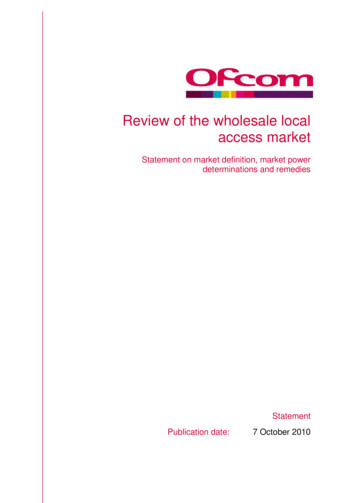
Three Crucial Lessons for Weatheringthe Stock Market’s StormWhether accompanied by recessions or not, market downturns can be unsettling.But over the past century, US stocks have averaged positive returns over oneyear, three-year, and five-year periods following a steep decline.(continued from page 11)A year after the S&P 500 crossed into bear market territory (a 20% fall from themarket’s previous peak), it rebounded by about 20% on average. And after fiveyears, the S&P 500 averaged returns over 70%.1Annual US Stock Return in excessof 1-month Treasury BillAll the dots in the upper left quadrant in the chart below are years where the USeconomy contracted but US stocks still outperformed less-risky Treasury bills. It’sa great illustration of the forward-looking nature of markets. If you’re worried,other investors are too, and that uncertainty is reflected in stock prices.Fama/French Total US Market Research Index ReturnsJuly 1, 1926–December 31, 202180%1-YearAverage Cumulative60%68.8%3-YearAverage Cumulative5-YearAverage urn After10% Market DeclineReturn After20% Market DeclineReturn After30% Market DeclineAnnual Real GDP GrowthPast performance is no guarantee of future results.Indices are not available for direct investment. Their performance does not reflect the expensesassociated with the management of an actual portfolio. In USD. Annual GDP growth rates obtainedfrom the US Bureau of Economic Analysis. GDP growth numbers are adjusted to 2012 USD terms toremove the effects of inflation. Data provided by Fama/French. Eugene Fama and Ken French aremembers of the Board of Directors of the general partner of and provide consulting services to,Dimensional Fund Advisors LP. Please see “Appendix Descriptions” for a description of theFama/French index data.Results shown during periods prior to each index’s index inception date do not represent actualreturns of the respective index. Other periods selected may have different results, including losses.Backtested index performance is hypothetical and is provided for informational purposes only toindicate historical performance had the index been calculated over the relevant time periods.Backtested performance results assume the reinvestment of dividends and capital gains.Past performance is no guarantee of future results.Market declines or downturns are defined as periods in which the cumulative return from a peak is-10%, -20%, or -30% or lower. Returns are calculated for the 1-, 3-, and 5-year look-ahead periodsbeginning the day after the respective downturn thresholds of -10%, -20%, or -30% are exceeded. Thebar chart shows the average returns for the 1-, 3-, and 5-year periods following the 10%, 20%, and30% thresholds. For the 10% threshold, there are 29 observations for 1-year look-ahead, 28observations for 3-year look-ahead, and 27 observations for 5-year look-ahead. For the 20%threshold, there are 15 observations for 1-year look-ahead, 14 observations for 3-year look-ahead,and 13 observations for 5-year look-ahead. For the 30% threshold, there are 7 observations for 1-yearlook-ahead, 6 observations for 3-year look-ahead, and 6 observations for 5-year look-ahead. Peak is anew all-time high prior to a downturn. Data provided by Fama/French and available data library.html. Fama/French Total US MarketResearch Index: 1926–present: Fama/French Total US Market Research Factor and One-Month USTreasury Bills. Source: Ken French website.12
Three Crucial Lessons for Weatheringthe Stock Market’s Storm(continued from page 12)We believe that staying invested puts you in the best position to capture therecovery. If you take risk out of your portfolio, it should be a strategic, not tactical,choice. We believe the only good reason to sell out of a stock portfolio now—solong as it’s diversified and low-cost—is because you learned something aboutyour risk tolerance or your investment goals have changed.2. Time the market at your perilWhen stocks have declined, it might be tempting to sell to stem further losses.You might think, “I’ll sit out until things get a bit better.” But by the time marketsare less volatile, you’ll have often missed part of the recovery. Yes, it stings towatch your portfolio shrink, but imagine how you’ll feel when it’s stuck while themarket rebounds.Big return days are hard to predict, and you really don't want to miss them. If youinvested 1,000 in the S&P 500 continuously from the beginning of 1990 throughthe end of 2020, you would have 20,451. If you missed the single best day,you’d only have 18,329—and only 12,917 if you missed the best five days. 2History shows the stock market tends to rebound quickly. The same can’t be saidfor individual stocks or even entire sectors. (How many railroad stocks do youown?) So, while investing means taking on some risk for expected reward,investors should mitigate risks where they can. Diversification is a top riskmitigation tool, along with investing in fixed income and having a financial plan.3. It may be a good time to reassess your portfolio and your planWe saw many fads crop up through the pandemic, from baking to puppyadoption. Did you experiment with one of the pandemic investment fads—FAANGs or meme stocks or dogecoin? If so, it may be time to put those fads inthe rearview.Do you know the names of all the stocks you own? Then you probably own toofew. How much of your portfolio sits outside the US? Because about half theglobal market is comprised of foreign stocks. If you only invest in the S&P 500,you’re missing half of the investment opportunity set. A market-cap-weightedglobal portfolio is a better starting point than chasing segments of the market thathave outperformed in the past few years.And if you want to outperform the market, allow decades of academic research tolight the way. Portfolios focused on small caps, value stocks, and more profitablecompanies have had higher returns over the long run. The portfolio I use isinvested across more than 10,000 global equities in over 40 countries.Beyond a well-designed portfolio, one of the best ways to deal with volatilemarkets and disappointing returns is to have planned for them. A financial advisorcan help you develop a plan that bakes in the chances you’ll experience somemarket lows. And they can help you find the confidence to weather the currentstorm and get to the other side.A sound approach to investing—through a plan, a well-designed portfolio, and anadvisor—is the ultimate self-care during these rough markets. Your future self willthank you.This piece first appeared in MarketWatch with the title “Follow these 3 cruciallessons for weathering the stock market’s storm.”1. S&P data 2022 S&P Dow Jones Indices LLC, a division of S&P Global. All rights reserved. Indices are not available for direct investment.2. Past performance, including hypothetical performance, is no guarantee of future results. Growth of 1,000 is hypothetical and assumes reinvestment of income and no transaction costs or taxes. The analysisis for illustrative purposes only and is not indicative of any investment. S&P data 2022 S&P Dow Jones Indices LLC, a division of S&P Global. All rights reserved. Indices are not available for direct investment.Diversification neither assures a profit nor guarantees against loss in a declining market. Past performance is not a guarantee of future results.The information in this material is intended for the recipient’s background information and use only. It is provided in good faith and without any warranty or representation as to accuracy or completeness.Information and opinions presented in this material have been obtained or derived from sources believed by Dimensional to be reliable and Dimensional has reasonable grounds to believe that all factualinformation herein is true as at the date of this material. It does not constitute investment advice, recommendation, or an offer of any services or products for sale and is not intended to provide a sufficient basison which to make an investment decision. Before acting on any information in this document, you should consider whether it is suitable for your particular circumstances and, if appropriate, seek professionaladvice. It is the responsibility of any persons wishing to make a purchase to inform themselves of and observe all applicable laws and regulations. Unauthorized reproduction or transmitting of this material isstrictly prohibited. Dimensional accepts no responsibility for loss arising from the use of the information contained herein.This material is not directed at any person in any jurisdiction where the availability of this material is prohibited or would subject Dimensional or its products or services to any registration, licensing or other suchlegal requirements within the jurisdiction.Investments involve risks. The investment return and principal value of an investment may fluctuate so that an investor’s shares, when redeemed, may be worth more or less thantheir original value. Past performance is not a guarantee of future results. There is no guarantee strategies will be successful.Dimensional Fund Advisors LP is an investment advisor registered with the Securities and Exchange Commission. Investment products: Not FDIC Insured Not Bank Guaranteed May Lose ValueDimensional Fund Advisors does not have any bank affiliates.13
2000 Index), Small Value (Russell 2000 Value Index), and Small Growth (Russell 2000 Growth Index). World Market Cap represented by Russell 3000 Index, MSCI World ex USA IMI Index, and MSCI Emerging Markets IMI Index. Russell 3000 Index is used as the proxy for the US market. Dow Jones US Select REIT Index used as proxy for the US REIT market.