Transcription
ReportArizona State Freight Plan(ADOT MPD 085-14)Performance and Condition of Arizona Freight TransportationSystemPrepared for:Arizona Department of TransportationPrepared by:CPCSIn association with:HDR Engineering, Inc.American Transportation Research Institute, Inc.Elliott D. Pollack & CompanyDr. Chris Caplice (MIT)Plan*ET Communities PLLC (Leslie Dornfeld, FAICP)Gill V. Hicks and Associates, Inc.CPCS Ref: 14325May 13, 2016
Report Performance and Condition of Arizona’s Freight Transportation SystemArizona State Freight Plan(ADOT MPD 085-14)Working PaperThis Working Paper presents the condition and performance of Arizona’sfreight transportation system. It provides a system assessment that willinform subsequent phases of the plan including project identification. Italso provides a baseline for future monitoring and evaluation of theArizona’s freight transportation system.AcknowledgementsThe CPCS team would like to thank the Arizona Department ofTransportation (ADOT) for its guidance and input in developing thisWorking Paper.OpinionsUnless otherwise indicated, the opinions herein are those of the authorand do not necessarily reflect the views of ADOT, the Technical AdvisoryCommittee, the Freight Advisory Committee, or the State of Arizona.ContactQuestions and comments on this Working Paper can be directed to:Marc-André RoyProject DirectorT: 1.613.237.2500 x 306mroy@cpcstrans.comDonald LudlowProject ManagerT: 1.202.772.3368dludlow@cpcstrans.com
Report Performance of Arizona’s Freight Transportation SystemArizona State Freight Plan(ADOT MPD 085-14)Table of ContentsEXECUTIVE SUMMARY . IIIACRONYMS / ABBREVIATIONS . XII1 INTRODUCTION . 1INTRODUCTION: CONTEXT. 2PROJECT OBJECTIVES . 3FREIGHT PLAN DEVELOPMENT PHASES . 3PURPOSE OF THIS WORKING PAPER . 4METHODOLOGY . 5LIMITATIONS . 52 APPROACH TO PERFORMANCE MEASURES . 6SIMPLE AND PRACTICAL APPROACH TO PERFORMANCE MEASURES . 7Linking Performance Measures to Objectives . 7Building on ADOT Performance Monitoring and Evaluation . 7Recognizing Quantitative Limitations . 8QUANTIFIABLE PERFORMANCE MEASURES TO ASSESS SYSTEM PERFORMANCE . 8Overall Freight Activity Measure . 8Truck Mobility Performance Measure . 10Annual Hours of Truck Delay Performance Measure . 12Truck Reliability Performance Measure . 14Truck Safety Performance Measure. 15BEYOND QUANTIFIABLE PERFORMANCE MEASURES: VALUE JUDGMENT INDICATORS . 17Collection of Value Judgment Indicators . 18Value Judgment Indicators for the Arizona State Freight Plan . 18Other Uses for Value Judgment Indicators . 20RELATIONSHIP TO MAP-21 . 21COMMUNICATION OF PERFORMANCE MEASURES . 213 ARIZONA FREIGHT SYSTEM CONDITION AND PERFORMANCE ASSESSMENT . 23CONDITION AND PERFORMANCE OF ARIZONA’S FREIGHT TRANSPORTATION SYSTEM . 24Overall Freight Activity . 24INCREASE MOBILITY AND MULTIMODAL ACCESSIBILITY . 31Mobility . 31Multimodal Accessibility . 36INCREASE SAFETY AND SECURITY . 37Safety . 37Freight Security . 40INCREASE SYSTEM EFFICIENCY AND RELIABILITY . 41Efficiency . 41Reliability . 47MINIMIZE NEGATIVE SOCIAL AND ENVIRONMENTAL IMPACTS . 52Social Impacts . 52Environmental Impacts . 52
Report Performance of Arizona’s Freight Transportation SystemArizona State Freight Plan(ADOT MPD 085-14)TOP FREIGHT TRANSPORTATION SYSTEM PERFORMANCE ISSUES . 54APPENDIX A: SUMMARY OF PERFORMANCE MEASURES IN OTHER STATE PLANS . 60
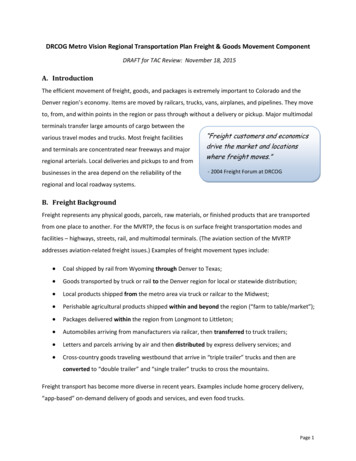
Report Performance of Arizona’s Freight Transportation SystemArizona State Freight Plan(ADOT MPD 085-14)Executive SummaryArizona’s freight transportation system generally provides efficient, reliable, and safe movement ofgoods statewide but experiences some recurring congestion and bottlenecks in and around urbancenters, particularly Phoenix, and non-recurring delays associated with road construction, crashes,and weather events. Despite this overall positive appraisal, system users suggest that travel timesand costs of moving freight in the state are increasing and that conditions are less safe due to trafficcongestion and weather events (e.g. dust storms).This report assesses the condition and performance of thestate’s freight transportation system using a combination ofquantitative and qualitative measures grounded in the FreightPlan’s goal of increasing system performance.The quantitative measures utilize hard data collected by ADOT and other sources while thequalitative measures rely on a survey of more than 50 freight system stakeholders—including systemmanagers (transportation agencies) and system users (Arizona businesses, shippers, carriers). Eachperformance measure relates to one or more of the objectives shown in ES 1-1 that comprise thegoal of increasing system performance.ES 1-1: Focus of the Arizona State Freight Plan’s Performance Measures iii
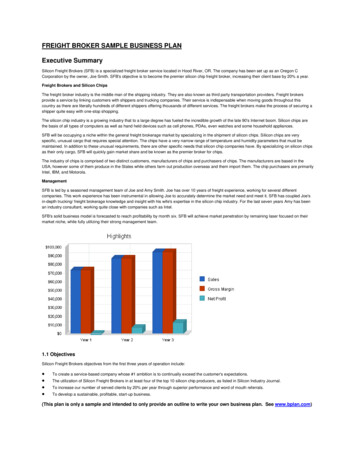
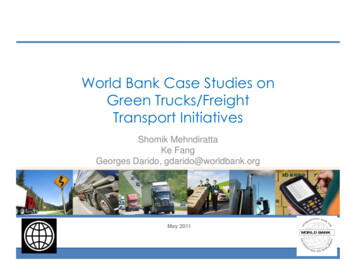
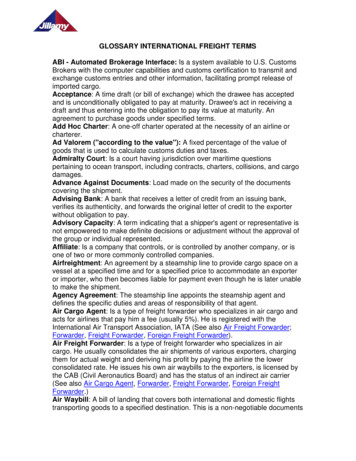
Arizona State Freight PlanReport Performance of Arizona’s Freight Transportation System(ADOT MPD 085-14)Freight Performance MeasuresES 1-2 displays the four system performance goals and the associated quantitative and qualitativeperformance measures. The quantitative performance measures use ADOT data and aresupplemented by qualitative measures or value judgment indicators, which provide insight intotopics for which little or no data are available and extend the usefulness of quantitative performancemeasures.The value judgment indicators were compiled from a survey of ADOT’s Freight Advisory Committee(FAC), which asked survey respondents to compare current performance relative to performancefive years ago. This provides a baseline for the general trend of Arizona’s freight transportationsystem, i.e. performance is getting better, declining, or staying the same. Furthermore, surveyrespondents had the option to cite specific issues to provide a context to their answers.ES 1-2: Value Judgment Indicators Informing Quantitative Performance MeasuresFreight TransportationSystem ObjectivesQuantitative PerformanceMeasureValue Judgment Indicator QuestionsIncreasing Mobility andMultimodal AccessibilityMobility: Truck Travel TimeIndex (TTTI)Mobility: How have freight travel times changed in the last fiveyears?Multimodal Accessibility: How have multimodal options(ability to ship by truck, rail, air) changed relative to five yearsago?Increase SystemEfficiency and ReliabilityEfficiency: Annual Hours ofTruck DelayReliability: Truck PlanningTime Index (TPTI)Efficiency: How have logistics costs due to systeminefficiencies changed in the last five years?Reliability: How has on-time delivery changed in the last fiveyears?Increase Safety AndSecuritySafety: Accident rate per 100million vehicle miles of travelSafety: Total societal cost ofaccidentsSafety: How have incidents and close calls changed in the lastfive years?Security: How has freight security changed in Arizona relativeto five years ago?Minimize Negative Socialand EnvironmentalImpactsN/AEnvironmental/Social: Have negative environmentalexternalities relating to freight activity and transportationdecreased relative to the previous period?Mobility, Reliability and Multimodal AccessibilityES 1-3 and ES 1-4 displays the performance of Arizona’s freight transportation system based onmeasures representing truck mobility and travel times (Truck Travel Time Index or TTTI) and truckreliability (Truck Travel Planning Time Index or TPTI), respectively. Additionally, ES 1-5 and ES 1-6summarize the performance of the Key Commerce Corridors (KCCs) on TTTI and TPTI measures.Overall, relatively few highway segments experience poor performance across TTTI and TPTImeasures, with a few exceptions, and those poor TTTI and TPTI segments largely coincide. Overall,large portions of the Arizona’s roadways and the overwhelming majority of the KCCs are performingwell. iv
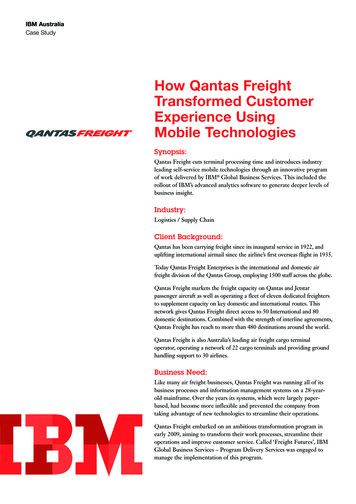
Report Performance of Arizona’s Freight Transportation SystemArizona State Freight Plan(ADOT MPD 085-14)ES 1-3: Truck Travel Time Index v
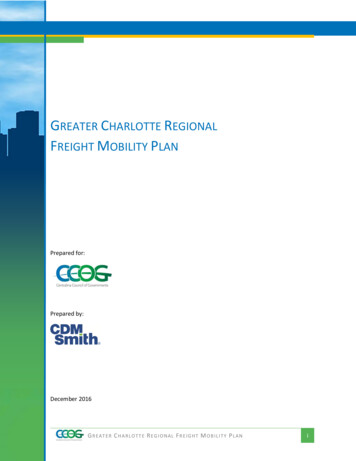
Report Performance of Arizona’s Freight Transportation SystemArizona State Freight Plan(ADOT MPD 085-14)ES 1-4: Truck Planning Time Index vi
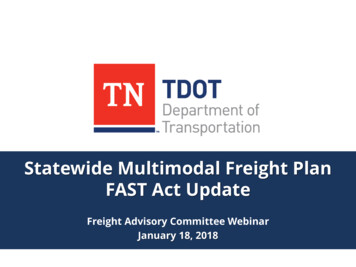
Arizona State Freight PlanReport Performance of Arizona’s Freight Transportation System(ADOT MPD 085-14)ES 1-5: Arizona Key Commerce Corridor TTTI PerformanceRural/Urban andPerformanceRuralKey Commerce Corridor1,375UrbanOverall Key Commerce Corridor (Urban and Rural Combined)CorridorLength(miles)Miles byArea Type1210165Good Rating(% miles)87%80%86%Fair Rating(% miles)10%10%10%Poor Rating(% miles)3%10%4%Fair Rating(% miles)10%8%10%Poor Rating(% miles)3%16%5%ES 1-6: Arizona Key Commerce Corridor TPTI PerformanceRural/Urban andPerformanceRuralKey Commerce Corridor1,375UrbanOverall Key Commerce Corridor (Urban and Rural Combined)CorridorLength(miles)Miles byArea Type1210165Good Rating(% miles)87%76%85%The transportation system is performing well with more than85% of KCC’s rated “good” for both travel time and reliability.The freight plan uses value judgment indicators to assess multimodal accessibility and to supplementthe quantitative assessment of mobility and reliability. When asked about multimodal accessibility,stakeholders most frequently suggested that multimodal options have increased or stayed the samecompared to five years ago. While an increase in the number of options would be the best indicator,multimodal accessibility is leaning in the direction of a more competitive freight transportationsystem.When surveyed, stakeholders suggested that mobility is getting worse relative to five years ago.Similarly, stakeholders suggested that the reliability of the transportation system is getting worse,but respondents provided a greater distribution of responses (across the different groups consulted)compared to the mobility measure. Adding the value judgment indicators suggests that there hasbeen a generally negative trend in performance over time.Value judgment indicators for mobility and reliability suggestthe performance of the freight transportation system is gettingworse relative to five years ago.EfficiencyES 1-7 displays the daily total hours of truck delay by roadway segment. Both truck volumes andoperating delay are accounted for while calculating total hours of daily truck delay. Rural corridorsexperience truck delay during nighttime, which is largely a function of driving conditions (lack oflighting, grades, lack of passing and climbing lanes, adverse environmental and weather conditions),and not necessarily a function of congestion or traffic volume. In urban areas, delay is mostly due to vii
Report Performance of Arizona’s Freight Transportation SystemArizona State Freight Plan(ADOT MPD 085-14)peak period congestion when the overall traffic volume is high. When asked to assess how theefficiency of the transportation system has changed over time, nearly every stakeholder suggestedthat it is getting worse.ES 1-7: Arizona Daily Hours of Truck Delay (2014) viii
Report Performance of Arizona’s Freight Transportation SystemArizona State Freight Plan(ADOT MPD 085-14)Safety and SecurityES 1-8 displays crashes categorized into one of three categories, below average, average, or aboveaverage (based on rural or urban characteristics). The number, weighted by severity, of crashesinvolving trucks per 100 million VMT by all traffic is used to differentiate the predominant locationsof truck-related accidents on Arizona’s transportation system. While Arizona has a good safetyrecord, truck safety remains a significant state, regional and local transportation system issue.ES 1-8: Arizona Safety Performance Measure (Truck Crash Rate, 2014) ix
Report Performance of Arizona’s Freight Transportation SystemArizona State Freight Plan(ADOT MPD 085-14)In response to the safety and security value judgment indicators, stakeholders suggested that thesefactors are largely unchanged, with some suggesting performance has gotten worse. The only reasonprovided for their answer on the safety and security questions was to suggest that traffic is causingsafety to get worse.Social and Environmental ImpactsTransportation officials found it difficult to comment on broad trends relating to social andenvironmental impacts, as these issues are addressed primarily through land use planning, orenvironmental processes. Additionally, none of the benchmarked state freight plans analyzedincluded social impacts performance measures and only a third of recently completed state freightplans included an environmental performance measure. Air quality nonattainment areas are usedas a proxy for environmental impacts, but transportation may not be the sole cause of air qualitynonattainment. Other sectors such as mining (for example, Hayden and Miami), agriculture and landdevelopment also impact air quality. Seven counties in Arizona are classified as nonattainment areasfor various pollutants by the U.S. Environmental Protection Agency.Overall PerformanceOutreach suggested that most users are largely satisfied with the performance of the transportationsystem. Yet, the system faces some specific performance issues which are relevant to this workingpaper, as revealed through consultations with freight transportation system stakeholders: Recurring congestion and bottlenecks in and around urban centers, particularly Phoenix:Peak congestion and associated bottlenecks were identified by virtually all freight sectors asproblematic, and as a barrier to transportation system performance and sectorcompetitiveness.Relevant objectives: System Efficiency and Reliability; System Mobility and MultimodalAccessibility Non-recurring congestion and bottlenecks: Although less frequently cited as an issue,several stakeholders – across most sector groups – noted non-recurring congestion and roadclosures as hindering the reliability of their transportation operations. Cited causes includedroad construction-related lane closures, crashes, and weather events, amongst others.Relevant objectives: System Efficiency and Reliability; System Mobility and MultimodalAccessibilityThe consultations echo the findings of both the quantitative and qualitative performance measures.The performance evaluation reveals that the freight system is performing well, but freightmovement experiences some level of recurring delays and non-recurring delays in both the urbanand rural areas of the state.As evidenced by the TTTI evaluation, only a small percentage of the 1,370 miles of KCC routes havea poor rating. The TPTI evaluation indicates a larger percentage of the system has a poor rating, aresult of the non-recurring delays impacting reliability. The segments experiencing the greatest x
Report Performance of Arizona’s Freight Transportation SystemArizona State Freight Plan(ADOT MPD 085-14)planning time delays are in the rural areas of the state, where alternatives are limited, and detoursare relatively long.Coupling the value judgment indicators and performance measures, the overall freight system isperforming well, but stakeholders suggest a generally decreasing trend in system performancerelative to five years ago. Additionally, stakeholders often suggested issues on similar roadwaysthroughout the value judgment indicators.The results of the quantitative performance measures and the value judgment indicators will beused in subsequent phases of work to identify the locations where freight performance is poor, andhelp inform strategic solutions to address them.This Working Paper focuses on the performance of the roadway system given ADOT’s assetownership over highways and its limited ability to invest in performance of other modes. WorkingPaper 2 contains additional information on non-highway modes. xi
Report Performance of Arizona’s Freight Transportation SystemArizona State Freight Plan(ADOT MPD 085-14)Acronyms / TTIU.S. DOTVMTANNUALIZED AVERAGE DAILY TRAFFICANNUALIZED AVERAGE DAILY TRUCK TRAFFICARIZONA DEPARTMENT OF TRANSPORTATIONAUTOMATIC TRAFFIC RECORDERSAMERICAN TRANSPORTATION RESEARCH INSTITUTECB RICHARDS ELLISCONGESTION MITIGATION AND AIR QUALITYCOUNCIL OF GOVERNMENTSENVIRONMENTAL PROTECTION AGENCYFREIGHT ADVISORY COMMITTEEFEDERAL HIGHWAY ADMINISTRATIONGEOGRAPHIC INFORMATION SYSTEMHIGHWAY PERFORMANCE MONITORING SYSTEMKEY COMMERCE CORRIDORSLOS ANGELES/LONG BEACHLONG RANGE TRANSPORTATION PLANMOVING AHEAD FOR PROGRESS IN THE 21ST CENTURY ACTMULTIMODAL PLANNING DIVISIONMILES PER HOURMETROPOLITAN PLANNING ORGANIZATION100 MILLION VEHICLE MILES TRAVELEDTECHNICAL ADVISORY COMMITTEETRUCK PLANNING TIME INDEXTRUCK TRAVEL TIME INDEXUNITED STATES DEPARTMENT OF TRANSPORTATIONVEHICLE MILES OF TRAVEL xii
Report Performance of Arizona’s Freight Transportation System1Arizona State Freight Plan(ADOT MPD 085-14)IntroductionKey MessagesThe Arizona State Freight Plan will define immediate and long-rangeinvestment priorities for the state’s freight transportation system.This Working Paper is the output of Phase 5 of the Freight Plan. It provides anassessment of the conditions and performance of Arizona’s freighttransportation system and related implications for the competitiveness andgrowth of Arizona’s key freight sectors.Analysis conducted as part of Phase 5’s intermediate steps is used as the basisfor much of this Working Paper, including the identification of theperformance measures used to assess the performance of Arizona’s freighttransportation system. Performance measures are defined to support thePlan’s vision, goals, objectives, policies and strategies.Performance measures, supporting data and analytical approaches werepreviously reviewed and approved for use in the Freight Plan by both ADOTand the Technical Advisory Committee (TAC). 1
Report Performance of Arizona’s Freight Transportation SystemArizona State Freight Plan(ADOT MPD 085-14)Introduction: ContextArizona’s economic potential is supported by the state’s transportation infrastructure, whichconnects sources of production to markets. When transportation infrastructure and relatedservices are efficiently designed and competitively positioned, businesses benefit from lowertransport costs, faster and better transportation services and increased reliability. Thesetransportation benefits in turn contribute to competitiveness and growth of businesses and thebroader region.Effective freight planning and programming can help achieve competitiveness and growth. Yet,fiscal realities are such that Arizona‘s Department of Transportation (ADOT) cannot address alltransportation system needs and constraints. Rather, ADOT must be strategic in defining andprioritizing its investments and system improvements.To this end, ADOT’s Multimodal Planning Division (MPD), is developing Arizona’s State FreightPlan (Freight Plan, or Plan) which will provide strategic guidance to achieve its vision, goals andobjectives. The following vision, goals and objectives have been developed to guide the freightplanning process (Figure 1-1).Vision: Arizona’s freight transportation system enhanceseconomic competitiveness and quality growth througheffective system performance and management.Figure 1-1: Arizona State Freight Plan Goals and ObjectivesSource: CPCS 2
Report Performance of Arizona’s Freight Transportation SystemArizona State Freight Plan(ADOT MPD 085-14)Project ObjectivesThe Freight Plan will define immediate and long-range freight investment priorities and policiesthat will generate the greatest return for Arizona’s economy, while also advancing other keytransportation system goals, including national goals outlined in the Moving Ahead for Progressin the 21st Century Act (MAP-21). It will identify freight transportation facilities in Arizona thatare critical to the State’s economic growth and give appropriate priority to investments in suchfacilities.The Freight Plan will ultimately provide Arizona with a guide for assessing and making soundinvestment and policy decisions that will yield outcomes consistent with the Freight Plan’svision, goals, and objectives, and notably, promote regional economic competitiveness andgrowth. The Freight Plan should also inform broader transportation system planning in Arizona,including future updates to the Long Range Transportation Plan (LRTP).Freight Plan Development PhasesThe State Freight Plan is being developed in 11 phases, organized under three overarchingheadings, as summarized in Figure 1-2. The present Working Paper is the output of Phase 5.Figure 1-2: Phased Approach to the Development of Arizona’s State Freight Plan 3
Report Performance of Arizona’s Freight Transportation SystemArizona State Freight Plan(ADOT MPD 085-14)Purpose of this Working PaperThis Working Paper presents an assessment of the the overall condition and performance ofArizona’s freight transportation system, with respect to the system performance objectives ofthe Freight Plan: 1.) Increase mobility and multimodal accessibility, 2.) Increase safety andsecurity, 3.) Increase system efficiency and reliability, and 4.) Minimize negative social andenvironmental impacts shown in Figure 1-3.Figure 1-3: Improve System Performance Goal and ObjectivesThe assessment of performance presented in this Working Paper uses the performancemeasures previously proposed and subsequently approved by the ADOT Project Manager andTechnical Advisory Committee (TAC). This includes a combination of quantifiable performancemetrics where feasible, failing which, qualitative value judgment indicators are used. ThisWorking Paper focuses on the performance of the roadway system, because Working Paper 2on transportation system assets already outlined the condition of all freight modes.Additionally, the performance of all modes was also assessed in Working Paper 2.This Working Paper highlights the implications of conditionand performance issues on the competitiveness and growthof Arizona’s key freight sectors. 4
Report Performance of Arizona’s Freight Transportation SystemArizona State Freight Plan(ADOT MPD 085-14)The assessment of condition and performance informs the identification and prioritization offreight transportation system improvements in the context of the Freight Plan. The conditionand performance assessment also establishes a baseline to compare freight transportationsystem performance over time.This Working Paper is presented for review and comments by the ADOT Project Manager, the TACand the Freight Advisory Committee (FAC).MethodologyThis Working Paper is informed by a combination of data analysis and consultation with theoperators and asset owners of Arizona’s statewide multimodal freight system. Additionally, thisWorking Paper consolidates and builds upon the previous phases, especially the Phase 2Inventory of State Freight Transportation Assets and the Phase 3 Economic Context WorkingPaper outlining Arizona’s economy and key economic sectors.The draft performance measures, data, and approaches for the freight transportation systemevaluations were presented and submitted to ADOT and the TAC in an interim Phase 5document.LimitationsThis Working Paper is in many cases informed by data and input provided by third parties. CPCS hasverified this information to the extent possible through analysis and cross-checking with othersources but cannot guarantee the accuracy of data received from third parties. 5
Report Performance of Arizona’s Freight Transportation SystemArizona State Freight Plan(ADOT MPD 085-14)2Approach toPerformanceMeasuresKey MessagesThe quantitative performance measures approved for use in the Arizona StateFreight Plan focus on increasing transportation system performance.Additionally, to supplement the quantitative performance measures, theFreight Plan uses qualitative measures to assess variables with limited data.The Arizona State Freight Plan’s approach to performance measures complieswith the freight themes of MAP-21, but U.S. DOT has yet to provide specificguidance on freight performance measures. Therefore, there is uncertaintyregarding whether the proposed performance measures will match futureMAP-21 and FAST Act rulemakings.These measures, data, and approaches are applied to assess the performanceof Arizona’s freight transportation system. 6
Arizona State Freight PlanReport Performance of Arizona’s Freight Transportation System(ADOT MPD 085-14)Simple and Practical Approach to Performance MeasuresBy leveraging ADOT’s existing work on performance measures and recognizing that moreperformance measures do not necessarily produce better outcomes, this approach allows ADOTto measure and track fewer freight transportation system performance measures—with morefocus. These performance measures are practical to measure and use, provide appropriateproxies for the performance parameters that freight transportation system users care about(for example, transit time, logistics cost, reliability), and provide meaningful insight into theconditions and performance of Arizona’s freight transportation system.Linking Performance Measures to ObjectivesIncreasing transportation system performance is one of the goals of the Arizona State FreightPlan, which ultimately enables econo
ES 1-2: Value Judgment Indicators Informing Quantitative Performance Measures Freight Transportation System Objectives Quantitative Performance Measure Value Judgment Indicator Questions Increasing Mobility and Multimodal Accessibility Mobility: Truck Travel Time Index (TTTI) Mobility: How have freight travel times changed in the last five years?