Transcription
Wang et al. Microbiome(2019) ARCHOpen AccessLongitudinal investigation of the swine gutmicrobiome from birth to market revealsstage and growth performance associatedbacteriaXiaofan Wang1†, Tsungcheng Tsai1†, Feilong Deng1,2, Xiaoyuan Wei1, Jianmin Chai1, Joshua Knapp1, Jason Apple1,Charles V. Maxwell1, Jung Ae Lee3, Ying Li2* and Jiangchao Zhao1*AbstractBackground: Despite recent advances in the understanding of the swine gut microbiome at different growthstages, a comprehensive longitudinal study of the lifetime (birth to market) dynamics of the swine gut microbiomeis lacking.Results: To fill in this gap of knowledge, we repeatedly collected a total of 273 rectal swabs from 18 pigs duringlactation (day (d) 0, 11, 20), nursery (d 27, 33, 41, 50, 61), growing (d 76, 90, 104, 116), and finishing (d 130, 146, 159,174) stages. DNA was extracted and subjected to sequencing with an Illumina Miseq sequencer targeting the V4region of the 16S rRNA gene. Sequences were analyzed with the Deblur algorithm in the QIIME2 package. A totalof 19 phyla were detected in the lifetime pig gut microbiome with Firmicutes and Bacteroidetes being the mostabundant. Alpha diversity including community richness (e.g., number of observed features) and diversity (e.g.,Shannon index) showed an overall increasing trend. Distinct shifts in microbiome structure along different growthstages were observed. LEfSe analysis revealed 91 bacterial features that are stage-specific. To validate thesediscoveries, we performed fecal microbiota transplantation (FMT) by inoculating weanling pigs with mature fecalmicrobiota from a growing stage pig. Similar stage-specific patterns in microbiome diversity and structures werealso observed in both the FMT pigs and their littermates. Although FMT remarkably increased growth performance,it did not change the overall swine gut microbiome. Only a few taxa including those associated with Streptococcusand Clostridiaceae were enriched in the FMT pigs. These data, together with several other lines of evidence, indicatepotential roles these taxa play in promoting animal growth performance. Diet, especially crude fiber from corn, wasa major factor shaping the swine gut microbiome. The priority effect, i.e., the order and timing of species arrival,was more evident in the solid feed stages.Conclusions: The distinct stage-associated swine gut microbiome may be determined by the differences in dietand/or gut physiology at different growth stages. Our study provides insight into mechanisms governing gutmicrobiome succession and also underscores the importance of optimizing stage-specific probiotics aimed atimproving animal health and production.Keywords: Swine gut microbiome, Dynamics, FMT, Growth stage and performance* Correspondence: jzhao77@uark.edu; yingli@sicau.edu.cn†Xiaofan Wang and Tsungcheng Tsai contributed equally to this work.1Department of Animal Science, University of Arkansas, Fayetteville, AR, USA2Farm Animal Genetic Resources Exploration and Innovation Key Laboratoryof Sichuan Province, Sichuan Agricultural University, Chengdu, Sichuan, ChinaFull list of author information is available at the end of the article The Author(s). 2019 Open Access This article is distributed under the terms of the Creative Commons Attribution 4.0International License (http://creativecommons.org/licenses/by/4.0/), which permits unrestricted use, distribution, andreproduction in any medium, provided you give appropriate credit to the original author(s) and the source, provide a link tothe Creative Commons license, and indicate if changes were made. The Creative Commons Public Domain Dedication o/1.0/) applies to the data made available in this article, unless otherwise stated.
Wang et al. Microbiome(2019) 7:109BackgroundThe advent of next-generation sequencing has dramatically expanded our understanding of the roles that gutmicrobiome plays in human health and diseases. Giventhe fact that pigs serve as an important protein sourceas well as a biomedical model for diseases in humans,the swine gut microbiome has drawn increasing attention. The correlation between swine gut microbiomeand animal health and production during critical growthstages has been characterized in several studies [1–6].High morbidity (e.g., diarrhea) and mortality rate duringweaning, attributed to various stresses, reduced gut barrier function, and increased pathogen infection, havebeen associated with an imbalanced gut microbiome(dysbiosis) which lead to remarkable losses in the swineindustry. Modulation of the swine gut microbiome viaprobiotics and/or prebiotics to maintain a healthy microbiome has been a promising means of preventing pathogens and promoting beneficial bacteria abundances [7].Particularly, bacterial taxa such as Christensenellaceae,Oscillibacter, Defluviitaleaceae incertae sedis, Cellulosilyticum, and Corynebacterium have been positively relatedto feed efficiency [8], which is critical for the swine industry. Recent studies have also filled some knowledgegaps of the swine gut microbiome, with respect to thebiogeography of the gastrointestinal tract [5], adiposity[3], digestibility [4], and growth performance [6].In addition, some larger scale studies have investigatedthe swine gut microbiome in greater depth. Xiao and colleagues [9] sequenced the fecal metagenomes of 287 pigsfrom France, Denmark, and China and identified 7.7 million non-redundant genes representing 719 metagenomicspecies. Interestingly, 96% of the functional pathwaysfound in the human gene catalogue are present in theswine gut microbiome gene catalogue, confirming the importance of pigs as human biomedical models [9]. Lu et al.[10] analyzed the swine gut microbiomes at weaning, week15, and off-test in over 1000 pigs. They identified twoenterotypes at each time point and found that the ones atthe two later time points were associated with back fatthickness [10]. In another study, De Rodas and colleagues[11] characterized longitudinal changes of the swine gutmicrobiome along different anatomical sites over seventime points. They found that the introduction of solid feedbetween days 21 and 33 had greater overall impact on bacterial community structure than age, solid feed type, andenvironment did [11].Although these studies have remarkably expanded ourunderstanding of the swine gut microbiome, they wereeither cross-sectional or sporadic with large sampling intervals [12, 13]. Many key ecological questions still remain unanswered. For example, how does the swine gutmicrobiome change from birth to market across all thedifferent growth stages? What are the key driversPage 2 of 18shaping the swine gut microbiome during these stages?Which gut microbiota members are residents of theswine GI tract that persist in the gut across age andwhich ones are passengers that only appear for a shortperiod of time? How do these members correlate withanimal health and growth performance? To answer thesequestions, a comprehensive, longitudinal study of theswine gut microbiome spanning every growth stage frombirth to market is imperative.In this study, we addressed several of these importantquestions by characterizing the longitudinal changes inthe swine gut microbiome from farrow to market coveringthe lactation, nursery, growing, and finishing stages. Weobserved significant changes in the swine gut microbiomealong these different stages and identified stage- andgrowth-associated bacterial taxa. To validate our discoveries, we inoculated weaning pigs with mature gut microbiota from a growing stage pig. Similar patterns ofchanges in the swine gut microbiome were observed inthe control group, i.e., pigs without fecal microbiota transplantation (FMT). Although FMT significantly increasedthe growth performance of the pigs, it did not significantlychange the overall gut microbiome structure of the recipients immediately after inoculation, confirming the stagespecificity of the swine gut microbiome likely attributableto gut physiology and diet.MethodsStudy design and animalsAnimal trial 1 (test trial)Pigs were managed according to the Institutional AnimalCare and Use Committee (IACUC) approved protocol#19017. Rectal swabs were collected from 18 pigs(PIC29*380) born from 3 sows (second parity) from theUniversity of Arkansas-Division of Agriculture SwineResearch Unit. Among these pigs, 17 were followedthroughout all the different growth stages. The pigletswere sow fed during lactation till weaning at day (d) 20,when they were transferred to an offsite nursery facility.Piglets were stratified by sow with two littermateshoused in a pen. On d 61, pigs were moved to a growingand finishing facility together with their penmates. Allpigs were fed with a seven-feeding-phase regime including three nursery phases (NP1: d 20–33; NP2: d 33–50;NP3: d 50–61), two growing phases (GP1: d 61–90; GP2:d 90–116), and two finishing phases (FP1: d 116–146;FP2: d 146–174). All diets were antibiotic-free, and dietary nutrients met or exceeded the NRC (2012) recommendation. Individual pig body weight (BW) and rectalswabs were collected on d 0, 11, and 20 during lactation,at the end of each phase during nursery period, in themiddle and the end of each phase during growing/finishing period (Additional file 1: Table S1).
Wang et al. Microbiome(2019) 7:109Animal trial 2 (validation trial)To validate the discoveries from trial 1, a total of 24weaned pigs (PIC29*380) were selected from the University of Arkansas-Division of Agriculture Swine ResearchUnit (IACUC protocol #19024). Pigs were blocked bysow and assigned to one of four pens in an onsite nursery facility (6 pigs per pen). On weaning day (d 21 ofage), half of the pigs (n 12) were treated with fecalmicrobiota transplantation (FMT). For the FMT, freshlydefecated feces from a mature healthy pig from growingstage phase 2 were collected from the anus after rectalmassage and were then transferred into a sterile WhirlPak filter bag with a pore size of 0.33 mm (Nasco FortAtkinson, WI) filled with 20% glycerol in PBS. Bacterialcells were detached from fecal matter after mixing athigh speed for 2 min using a Stomacher 400 (SewardLtd, West Sussex, UK). Filtrates were then transferredinto 50-ml conical tubes and stored at 80 C freezer.Each pig was gavaged with 3 ml filtrates for two consecutive days (d 21 and d 22). Pigs were fed a total of 8feeding phase regimes in this trial: three nursery phases(NP1: d 21–29; NP2: d 29–42; NP3: d 42–61), two growing phases (GP1: d 61–84; GP2: d 84–99), and three finishing phases (FP1: 99–138; FP2: d 138–159; FP3: 159–183). All diets were antibiotic-free and met or exceededNRC (2012) recommendation on nutrient requirementfor each stage of pigs. Individual pig BW and rectal swabwere collected at weaning and at the end of each phase.Sample collection, DNA extraction, and sequencingA total of 273 rectal swabs (Puritan Opti-Swab LiquidAmies Collection & Transport System; Puritan LLC,Guilford, ME) were collected from 17 pigs repeatedlyduring lactation (d 0, 11, 20), nursery (d 27, 33, 41, 50,61), growing (d 76, 90, 104, 116), and finishing (d 130,146, 159, 174) stages in animal trial 1, with two moresamples collected from the 18th pig that died during lactation stage. In trial 2, a total of 246 rectal swabs werecollected from 24 pigs repeatedly at the end of lactation(d 21), nursery (d 22, 23, 29, 42, and 61), growing (d 84and 99), and finishing (d 138, 159, and 183) periods(Additional file 1: Table S1) to validate the findings fromtrial 1. These swabs were stored at 80 C until DNAextraction was performed.A total of 200 μL fecal swab solution was used forDNA extraction with PowerLyzer PowerSoil DNA Isolation Kit (Qiagen, Hilden, Germany) according to themanufacturer’s protocol. Extracted DNA was quantifiedusing NanoDrop (Thermo Fisher Scientific, Wilmington,DE, USA) and diluted to 10 ng/μL with DNase- andRNase-free water. Libraries were constructed accordingto published protocol [14]. Briefly, the V4 region of thebacterial 16S rRNA gene was amplified using universalprimers (F: 5′-GTGCCAGCMGCCGCGGTAA-3′ andPage 3 of 18R: 5′-GGACTACHVGGGTWTCTAAT-3′). Agarose gelelectrophoresis was performed to verify the size ofamplicons. The SequalPrep Normalization Plate Kit(Invitrogen, Carlsbad, CA, USA) was used to clean upand normalize PCR products. Normalized ampliconswere pooled in equal volume, and their quality andquantity were measured with Agilent Bioanalyzer2100 (Agilent, Santa Clara, CA, USA) and quantitative RT-PCR, respectively. Illumina MiSeq 2 250 bppaired-end sequencing (MiSeq Reagent Kit v2, 500cycles, 20% PhiX) was used to sequence pooledamplicons. Negative controls for DNA extraction andPCR amplification and mock community (ZymoBIOMICS Microbial Community Standard (Zymo, Irvine,CA, USA)) were included in each MiSeq run forquality control.Microbiome data analysisIllumina MiSeq fastq reads were imported into theQIIME2 platform (version 2.4) and were processed bythe Deblur program [15], which obtains singlenucleotide resolution based on error profiles within samples. Deblur denoised sequences are usually calledamplicon sequence variants (ASVs), exact sequence variants (ESVs), or sub-operational taxonomic units (subOTUs). In this study, these sequences were assigned tobacterial features, which are synonymous to ASVs, ESVs,and sub-OTUs and sequences between different featuresdiffered at the single-nucleotide level. Deblur generatesunique features that could be compared between different studies. To minimize the effects of sequencing depthon alpha and beta diversity measure, the number ofreads from each sample was rarefied to 4000, which stillyielded an average Good’s coverage of 97.90%. The taxonomy of these features was assigned to the Greengenesreference database (13-8 version) classifier with 99%similarity. A feature table was generated using Qiime2’sqiime vsearch cluster-features-closed-reference command. Determination of alpha and beta diversities andanalysis of similarity (ANOSIM) were also conducted inqiime2. This data analysis pipeline yielded high-qualitysequences as suggested by the eight bacterial taxa fromthe mock communities that were detected in each runwith consistent relative abundance as expected.Permutational multivariate analysis of variance (PERMANOVA) was performed to disclose the factors shaping the dynamics of the swine gut microbiome.PERMANOVA, a distribution-free algorithm, accommodates random effects, repeated measures, and unbalanced datasets [16]. For PERMANOVA analysis, weused the adonis function in the vegan package of R including different independent variables (e.g., age, gender,diet) with default settings (Bray-Curtis distance and 999permutations). We used strata pigID to account for
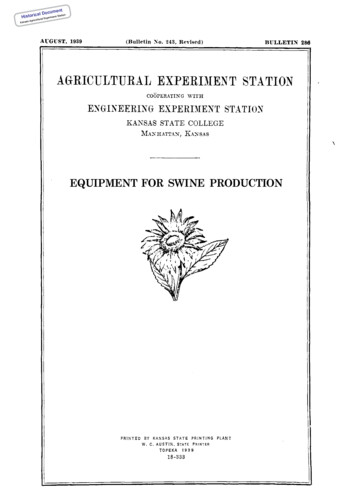
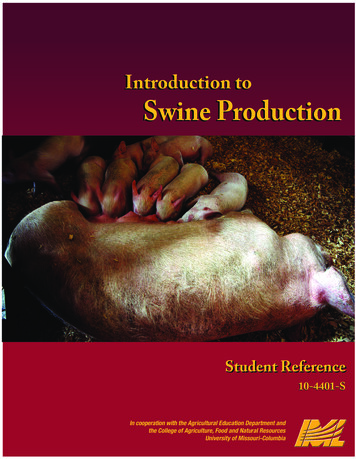
Wang et al. Microbiome(2019) 7:109the random effects of pigs for repeated measures. Stagedependent features were identified by using the lineardiscriminant analysis (LDA) effect size (LEfSe) with default settings (e.g., LDA score 2) [17]. Regressionbased random forest models were developed to identifybacterial features that correlate with growth performance (body weight), using the default settings in the randomForest package in R project [18]. LEfSe was alsoused to identify bacterial features differentially represented between the control and the FMT groups in thevalidation trial.The SparCC algorithm that is able to estimate the correlations from compositional network was used for network analysis. The network was demonstrated by usingthe igraph package in R with edges connecting nodes(bacterial taxa) with a correlation co-efficiency over 0.6or less than 0.6. Clusters were generated based on thebetweenness centrality calculated with the GirvanNewman algorithm [19].Growth performance data analysisData were analyzed using the general linear model ofSAS (Cary, NC) as complete block design with treatmentas a fixed effect. Each individual pig was used as the experimental unit. PDIFF option was used to test differences between least square means of the factor levels.ResultsThe dynamics of the swine gut microbiome from birth tothe marketWe first characterized the dynamics of the swine gutmicrobiome in the test trial by analyzing a total of 273rectal swabs collected from birth (d 0) to market (d174). A total of 2,980,303 high-quality reads from 3358features at the single-nucleotide resolution were generated with an average of 10,916 reads per sample. Afterrarefaction of sample reads to 4000, a total of 3254 features (1,080,000 total reads) from 270 samples were included for downstream analysis of the swine gutmicrobial community dynamics. The other three samples with sequence read number below 4000 were excluded from further analysis.A high microbial diversity including the number of observed bacterial features and the Shannon index was observed in the meconium (d 0), comparable to thediversity of the adult pigs in this study (Fig. 1a, b), aswell as to those of sows from other trials (Additional file1: Figure S1a and b). The high microbial diversitydropped dramatically on day 11 and increased on day 20before weaning. No significant changes in alpha diversitywere observed during the first 4 weeks of the nurserystages, even though solid food was provided postweaning. The overall alpha diversity increased over time starting from the end of the nursery stage, as demonstratedPage 4 of 18by the Shannon index (H′, Fig. 1a) and the number ofobserved features (Fig. 1b) during the observation period(except d 0). No significant changes in community evenness were observed despite the slight increase in the finishing stage (Additional file 1: Figure S1c).Significant shifts in community membership andstructure from lactation, nursery, growing, and finishing stages were observed on the principal coordinateanalysis (PCoA) plots based on Bray-Curtis (Fig. 2a)and Jaccard (Additional file 1: Figure S2a) distances.Day 0 samples were distinct from those of the othertwo lactation time points (day 11 and day 20). Theswine gut microbiomes were different between nursery, growing, and finishing stages when pigs were fedsolid diets (Table 1 and Additional file 1: Table S2),but they were more similar to each other (ANOSIM,nursery vs growing: R 0.425; growing vs finishing: R 0.554, P 0.001 for both) than to the lactationmicrobiomes when the pigs were fed sow milk (ANOSIM, R 0.97, P 0.001 for all solid feed stages vslactation; Table 1 and Additional file 1: Figure S2a).The “core” and stage-associated microbiomesWe next examined the order and timing of bacterial taxaarrival during different stages of the pre-harvest section.At the phylum level, a total of 19 phyla including Firmicutes, Bacteroidetes, Proteobacteria, and Actinobacteriawere observed, with Firmicutes being the most abundantphylum followed by Bacteroidetes across each stage(Additional file 1: Figure S3a). These two phylaaccounted for 70% of the total sequences. At the subOTU level, the top 30 most abundant bacterial featuresare displayed on stacked bar charts. Among these top 30taxa, 11 belong to genus Prevotella, the most diverseand dominant genus throughout most of the stages, especially after the introduction of solid feed (Fig. 3a).The appearance order and timing of the swine gutmicrobiome members are summarized in Fig. 4.Among the top 700 features, 125 features werepresent, based on their average relative abundance,throughout the entire pre-harvest lifetime and are defined as “core” microbiome or residents of the swineGI tract. Features that appeared only at certain stagesare referred to as “stage-associated.” For instance,F250 (Acinetobacter) was observed only at birth (d 0).Feature 20 (Prevotella stercorea) was abundant duringlactation but remarkably decreased in subsequentstages. Feature 7 (Escherichia coli) was present duringthe lactation stage and persisted till the end of nursery phase before phasing out. On the other hand, F3,which is associated with Prevotella copri, dramaticallyincreased at the end of the first nursery phase afterthe introduction of solid food. Other features such asF4 (unclassified Clostridiaceae), 10 (Bacteroidetes
Wang et al. Microbiome(2019) 7:109Page 5 of 18abcdefFig. 1 Longitudinal changes in the swine gut microbiome community diversity (a, c, e) and richness (b, d, f) from birth to market in the test trial(a, b), in the control group (c, d), and fecal microbiota transplantation (FMT) group (e, f) of the validation trial. Lactation, nursery, growing andfinishing stages are depicted in blue, purple, green, and red, respectivelyYRC22), and 27 (Clostridium butyricum), which wererarely observed during lactation and nursery stages, increased rapidly during the growing and finishing stages(Fig. 3a and Additional file 1: Figure S4). Fluctuations inthe relative abundance of bacterial features belonging toother dominant genera such as Megasphaera, Lactobacillus, and Streptococcus were also observed at various timepoints (Fig. 3a and Additional file 1: Figure S4). Finally,features that appeared sporadically at certain stages butdisappeared later are called “passengers” (Fig. 4b).Stage-associated bacterial features were identified byusing LEfSe [17], an algorithm that focuses not only onstatistical significance but also on biological consistency.The abundance of these features is visualized on a heatmap (Fig. 5). Of note, day 0 samples were not included inthe LEfSe analysis since meconium microbiomes were
Wang et al. Microbiome(2019) 7:109Page 6 of 18abcdFig. 2 Longitudinal changes in the swine gut microbiome structure at different growth stages. Principal coordinate analysis (PCoA) plots basedon the Bray-Curtis distances showed distinct clusters in the test trial (a), the control group (b), the fecal microbiota transplantation (FMT) group(c) of the validation trial, and all the groups combined (d). Lactation, nursery, growing, and finishing stages are differentiated by colors (blue,purple, green, and red, respectively) and shapes (square, circle, diamond, and triangle, respectively). The pig donor in the FMT group is indicatedwith a yellow diamond. Samples with same color densities were collected on the same dayremarkably different from the typical lactation microbiomeson day 11 and day 20 and might bias the stage-specific data.LEfSe analysis confirmed most of the observations mentioned above. For example, F20 was classified as a lactationassociated bacterium, whereas F3 was nursery-specific, although both of these taxa belong to the Prevotella genus.Of note, although the core microbiome members persistedthroughout the entire pre-harvest section, their presencealso followed a stage-specific pattern. For example, Megasphaera (F1) and Streptococcus luteciae (F2) were detectedstarting d0 until the end of the study, but their abundancewas relatively low during the lactation stage. Their abundance showed a unimodal pattern: increased startingnursery phase 1, peaked during the end of the nurseryphase 3 and growing stage, and started to decrease thereafter (Fig. 5 and Additional file 1: Figure S4).Network analysis using the SparCC algorithm alsoshowed stage-associated interactions between bacterialfeatures (Fig. 6). Three large clusters within the network were observed with stage-associated featuresconnected to one another. The yellow and green clusters connected nodes (bacterial features) associatedwith the lactation stage and finishing stages, respectively, whereas the pink cluster serves as a bridge connecting these two clusters by two hub nodes, F3(Prevotella copri) and 22 (Peptostreptococcaceae).
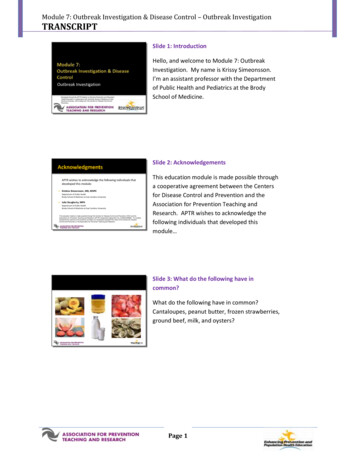
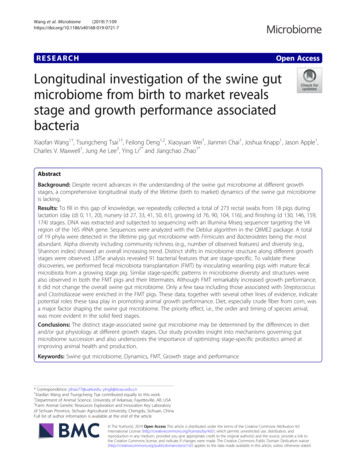
Wang et al. Microbiome(2019) 7:109Page 7 of 18Table 1 Dissimilarities in the swine gut microbiome at differentgrowth stages and meconium (d 0) revealed by analysis ofsimilarity (ANOSIM) based on Bray-Curtis distancesBacterial features enriched in the nursery and growingstages were grouped in this cluster.Group 1Group 2Sample sizeR valuep valueq valueValidation of the stage-associated swine gut .9810.0010.001MeconiumNursery1010.9950.0010.001We next validated the stage-associated swine gutmicrobiome in a second animal trial (i.e., the validation trial). At weaning, we inoculated 12 pigs withmature gut microbiota isolated from a growing stagepig (growing phase 2). When compared to their littermates in the control group, FMT recipients hadgreater average daily gain (ADG) during nurseryphase 2 (0.30 vs 0.25 kg, P 0.087), growing phase 1(0.86 vs 0.76 kg, P 0.042), finishing phase 1 (1.05vs 0.9 kg, P 0.068), and finishing phase 2 (0.98 vs0.81 kg, P 0.018), but not at growing phase 2 (0.75vs 0.96 kg, P 0.042). Although not statistically significant, FMT pigs were 4.9 kg heavier at the end ofthe second trial and their hot carcass weight (HCW)was 7.7 kg heavier than their littermates (P 0.09,Fig. 7).Similar patterns in the development of the gutmicrobiome were also observed in the validation trialin both the control and the FMT groups. AlphaabcFig. 3 Top 30 features in the test trial (a), the control group (b), and the FMT group (c) of the validation trial. Each color represents the relativeabundance of a bacterial taxon on the stacked bar chart.
Wang et al. Microbiome(2019) 7:109Page 8 of 18abFig. 4. a, b Longitudinal occurrence patterns of the swine gut microbiomes. Top 700 features based on averaged relative abundance on each daywere used to summarize the occurrence patterns. Blue circle indicates the presence of a bacterial taxon while a yellow circle shows the absence.Mixed color circles mean transition between “presence” and “absence” during each stage or time period
Wang et al. Microbiome(2019) 7:109Page 9 of 18Fig. 5 Heat map showing 91 stage-associated bacterial taxa identified by LEfSe (LDA 2) in the test trial. The top 1000 features (d 0 sampleswere excluded) were used for LEfSe analysis. Heat map shows the average relative abundances on a log scale
Wang et al. Microbiome(2019) 7:109Page 10 of 18Fig. 6 Network analysis of the interactions between bacterial taxa at different growth stages. SparCC was used to calculate the relationshipsbetween bacterial taxa. R package igraph was used to draw the networkdiversity sustained an increasing trend starting atweaning (d 21) until the end of the finishing stagein both groups (Fig. 1c–f ). Introduction of solid fooddid not change the swine gut microbiome immediately. Microbiota on the first 2 days of the nurserystage (d 22 and 23) were still clustered with thosecollected from weaning (ANOSIM, R 0.1, P 0.05;Table 2). Significant changes in community structurewere observed at the end of nursery phase 1 on d 29after 8 days of solid feed consumption (Table 2, Fig. 2b, c),consistent with the animal trial 1 (Fig. 2a). In general, distinct clusters of the swine gut microbiome were observedin both individual animal trials and when combinedtogether (Fig. 2d and Additional file 1: Figure S2d). Although FMT increased animal growth performance, itdid not drastically change the swine gut microbiome(Additional file 1: Figure S5). Only minor changes inswine gut microbiome were observed on d 42 (ANOSIM, R 0.24, P 0.05) and 61 (ANOSIM, R 0.16,P 0.05).As to the core microbiome, 147 and 125 featureswere identified from the control and the FMT groupin the animal trial 2 among the top 700 features,respectively. Moreover, 69 of these core microbiomefeatures were shared among three groups of pigs(trial 1, trial2—control, and trial2—FMT group)
Wang et al. Microbiome(2019) 7:109Page 11 of 18abFig. 7 Effect of fecal microbiota transplantation (FMT) at weaning on a the average daily gain (ADG), and b final body weight and hot carcassweight (HCW) in subsequent stages of growth in pigs. All pigs were weighed at the beginning and the end of each phase to determine ADGand the market weight. At the end of this trial, all pigs were transferred to a plant where carcass characteristic data were collected. An asterisk (*)indicates a tendency for treatments significantly different; two asterisks (**) indicate traits significantly differentTable 2 ANOSIM analysis of changes in the swine gutmicrobiome structures within the first nursery phase after solidfeed supplementationGroup 1Group 2Sample sizePermutationsR valuep valued21BTd22BT23999 0.010.57d21BTd23BT24999 0.050.83d22BTd23BT23999 0.030.66d21BTd29BT249990.78* 0.01**indicates significant differences between two groups(Additional file 1: Figure S6). In addition, both thecontrol (N 31) and the FMT (N 32) groupsshowed stage-associated swine gut microbiome features in the second trial (Additional file 1: FigureS7) as well. Among these features, two (F87 andF101), six (F16, F40, F59, F117, F128, and F143),four (F170, F114, F388, and F453), and three (F18,F195, and F333) features were shared between test
Wang et al. Microbiome(2019) 7:109trial and validation control groups at lactation, nursery, growing, and finishing stages, respectively.Diet shapes stage-specific swine gut microbiomePermutational multivariate analysis of variance (PERMANOVA) was performed to elucidate the mechanismunderlying the assembly of the stage-associated swinegut microbiome. Factors such as age, body weight, diet,gender, individual pigs, and sows were examined. Dietwas used as a categorical variable including eight categories: lactation (sow milk), nursery (NP1, NP2, andNP3), growing (GP1 and GP2), and finishing diets (FP1and FP2) in the test trial. We developed a series ofmodels to determine the most important factors shapingthe swine gut microbiome. We first performed PERMANOVA usin
[10] analyzed the swine gut microbiomes at weaning, week 15, and off-test in over 1000 pigs. They identified two enterotypes at each time point and found that the ones at the two later time points were associated with back fat thickness [10]. In another study, De Rodas and colleagues [11] characterized longitudinal changes of the swine gut