Transcription
GREATER CHARLOTTE REGIONALFREIGHT MOBILITY PLANPrepared for:Prepared by:December 2016G R E A T E R C H A R L O T T E R E G I O N AL F R E I G H T M O B I L I T Y P L ANi
Final Report Table of ContentsTABLE OF CONTENTS1Introduction. 12The Purpose of This Freight Plan . 23Regional Collaboration . 24Three Pillars of This Freight Plan . 44.1Population Trends. 44.2Economic Indicators. 54.3Transportation System Conditions . 75Plan Development. 96Stakeholder Engagement Process . 116.1.1 Coordinating Committee . 116.1.2 Steering Committee . 116.1.3 Freight Advisory Committee . 116.1.4 Surveys . 116.1.5 Interviews . 126.1.6 Coordination with Other Plans . 126.1.7 How Stakeholder Feedback was Utilized . 127Analysis and Findings . 1387.1Existing Conditions. 137.1.1 Trucking . 137.1.2 Intermodal Facilities . 167.1.3 Rail . 167.1.4 Aviation . 197.2Freight Challenges by Mode . 217.2.1 Trucking . 217.2.2 Freight Rail . 227.2.3 Air Cargo . 237.3Freight Demand – Existing and Forecast . 247.4Land Use Analysis . 267.4.1 Charlotte Regional Strategic Freight Network . 297.4.2 Critical Rural and Urban Freight Corridors . 31Freight Vision, Goals & Objectives, & Performance Measures . 338.1Regional Freight Vision Statement . 338.2Regional Freight Goals & Objectives. 338.2.1 Goal 1: Economic Competitiveness and Efficiency . 338.2.2 Goal 2: Safety and Security . 338.2.3 Goal 3: Infrastructure Preservation and Maintenance . 34G R E A T E R C H A R L O T T E R E G I O N AL F R E I G H T M O B I L I T Y P L ANii
Final Report Table of Contents8.2.48.2.58.2.68.2.79Goal 4: Environmental Stewardship . 34Goal 5: Congestion and Reliability . 34Goal 6: Performance and Accountability . 34Goal 7: Regional Coordination . 348.3Regional Freight Goals Alignment with National and State Programs . 358.4Performance Measures . 378.4.1 Application and Implementation of Performance Measures . 398.5Regional Freight Prioritization of Projects and Policies . 408.5.1 Defining Freight Project Relevance. 408.5.2 Prioritization Framework . 40Freight Improvement Recommendations . 439.1Freight Needs & Opportunities Identification . 439.2Freight Recommendations Prioritization Results . 439.2.1 General Freight Recommendations . 449.2.2 Trucking Related Recommendations . 489.2.3 Freight Rail Related Recommendations . 549.3Freight Recommendations – Short Term, Quick Start Opportunities . 5910 Plan Implementation Process . 6110.1 Acceptance by MPO/RPO Partners. 6110.2 Incorporation into NC and SC Freight Plans . 6110.3 Adoption/Approval by Local Governments and Economic Development Organizations . 6310.4 Regional Collaboration of Private & Public Organizations . 63LIST OF TABLESTable 4.1: North Carolina, South Carolina, and U.S. Population Comparison (2010 and 2015). 4Table 4.2: Regional Population (2010, 2014, and 2040). 5Table 4.3: Regional Employment (2012, 2013, and 2040) . 6Table 4.4: Top Charlotte Region Export Countries (2015) . 6Table 4.5: Top Charlotte Region Export Sectors (2015). 7Table 4.6: Comparison of Highway Performance Measures, Southeastern United States (2015). 8Table 7.1: Regional Railroad Ownership . 16Table 7.2: Freight Corridors . 28Table 7.3: Freight Concentrations . 28Table 7.4: Urban/Rural Corridor Mileage . 32Table 8.1: Greater Charlotte Regional Freight Plan Goals Alignment with National Programs . 35Table 8.2: Freight Mobility Plan Goals, Objectives, and Performance Measures . 38Table 9.1: General Freight Recommendations . 45Table 9.2: Trucking Related Recommendations . 48G R E A T E R C H A R L O T T E R E G I O N AL F R E I G H T M O B I L I T Y P L ANiii
Final Report Table of ContentsTable 9.3: Freight Rail Related Recommendations . 54Table 9.4: Short Term, Quick Start Recommendations . 59LIST OF FIGURESFigure 1.1: Greater Charlotte Bi-State Region . 1Figure 3.1: Freight Plan Study Area . 3Figure 5.1: Freight Plan Development Process . 9Figure 7.1: Greater Charlotte Region Roadway Network . 13Figure 7.2: Regional Truck Average Daily Truck Volumes (2012) . 14Figure 7.3: Charlotte Region Truck Bottlenecks . 15Figure 7.4: Commercial Vehicle Crash Hotspots (2009-2013) . 15Figure 7.5: Greater Charlotte Regional Intermodal Facilities . 17Figure 7.6: Greater Charlotte Regional Rail Network . 17Figure 7.7: Regional Class I Annual Rail Freight Volumes in North Carolina (2014) . 18Figure 7.8: North Carolina Rail Bottlenecks . 18Figure 7.9: Regional Rail Freight Top Commodities (By Weight) . 19Figure 7.10: Greater Charlotte Regional Public Airports . 20Figure 7.11: Regional Air Cargo Top Commodities (By Value) . 20Figure 7.12: Identification of Freight Corridors and Concentrations . 27Figure 7.13: Strategic Freight Network . 30Figure 7.14: Strategic Freight Network (Roadways Only). 30Figure 7.15: Strategic Freight Network with Urban and Rural Area Designations . 31Figure 8.1: Greater Charlotte Regional Freight Plan Goals Alignment with South Carolina andNorth Carolina Goals . 36Figure 9.1: Trucking Related Recommendations . 53Figure 9.2: Rail Related Recommendations . 58APPENDICESAppendix A – Summary of Public Information and Stakeholder ParticipationAppendix B – Existing ConditionsAppendix C – Goals, Objectives, and Prioritization of Freight Project and PoliciesAppendix D – Freight ForecastsAppendix E – Economic Context and Land Use AnalysisAppendix F – Best Practices in Freight PlanningAppendix G – RecommendationsG R E A T E R C H A R L O T T E R E G I O N AL F R E I G H T M O B I L I T Y P L ANiv
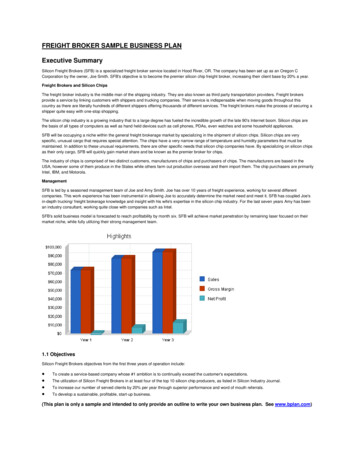
1INTRODUCTIONCentralina Council of Governments (CCOG), in concert with regional partners for the 14-countyGreater Charlotte Bi-State Region (Figure 1.1), proposes to support the region’s communities,transportation planning organizations, and manufacturing and logistics industries by developing aRegional Freight Mobility Plan (Freight Plan) designed to: Identify ways to effectively andconsistently address freight congestionand key bottlenecks, Identify links that connect mobility offreight to regional economicdevelopment goals, Prioritize improvements to reducebarriers to efficiency, Promote effective land use in both urbanand rural areas of the Region to supportfreight mobility, business developmentand job growth, and Mitigate environmental impacts related to mobility barriers across the Region.Figure 1.1: Greater Charlotte Bi-State RegionCCOG, in collaboration with regional partners, initiated work on this Freight Plan in June 2015 andfinalized in December of 2016. This plan includes an assessment of the needs of freight movementand freight-oriented land uses, and current capabilities for meeting those needs. The gap betweenneeds and capabilities have been addressed through sector-specific and inter-disciplinary strategies,which are presented in this final plan for endorsement and approval by the area partners.As the movement of goods transcends jurisdictional boundaries, freight-related decisions can havewide-ranging impacts within and outside of the region. This Freight Plan is consistent with otherregional efforts, making sure freight priorities complement, or do not conflict with, other importantinitiatives.The Freight Plan is consistent with North Carolina and South Carolina statewide transportationplanning studies as well as regional and local jurisdiction transportation planning initiatives. TheFreight Plan was developed with the Moving Ahead for Progress in the 21st Century (MAP-21)legislation in 2012 and more recent FAST Act legislation in 2015 in mind to ensure the analysis andrecommendations are consistent with federal legislative guidance.G R E A T E R C H A R L O T T E R E G I O N AL F R E I G H T M O B I L I T Y P L AN1
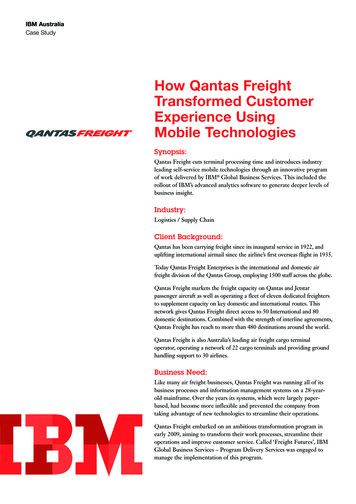
2THE PURPOSE OF THIS FREIGHT PLANThis Freight Plan should be used for three principal purposes:1. Data resource: a great deal of data has been compiled in the development of this plan.Warehoused by CCOG, infrastructure, parking, land use and other relevant data are availablefor reference for implementation and ongoing planning efforts.2. Provide freight related recommendations for inclusion in state and local land use andtransportation plans: throughout this Freight Plan, recommendations for performancemeasures, prioritization framework and recommended policies, programs and projects thatshould be considered for inclusion in state freight plans and local land use and transportationplans.3. Serve as a cornerstone for expanded and sustained regional coordination through theCouncil of Governments: CCOG has initiated valuable dialogue across the public and privatesectors, raising awareness of freight mobility and its role in the regional economy. This planshould serve as the foundation for additional conversations, coordinated planning effortsand ongoing campaigns supporting freight mobility.3REGIONAL COLLABORATIONThe Freight Plan is a multi-jurisdictional public-private collaboration effort lead by the CCOG inpartnership with Metropolitan Planning Organizations (MPOs), Rural Planning Organization (RPO),Federal Highway Administration, U.S. Department of Commerce Economic DevelopmentAdministration, North Carolina Department of Transportation (NCDOT), South Carolina Departmentof Transportation (SCDOT), local governments, economic development organizations, and private railand trucking companies, logistics and distribution firms. The Freight Plan documents the freighttransportation system within the 14 counties of the Greater Charlotte Region which includes 10counties in North Carolina and four counties in South Carolina, as shown in Figure 3.1. Regionalpartners had the opportunity to participate in the development of the Freight Plan by serving on oneof three committees: Coordinating Committee, Steering Committee or Freight Advisory Committee. Acomplete overview of the public engagement and committee participation process is included inAppendix A – Summary of Public Information and Stakeholder Feedback.G R E A T E R C H A R L O T T E R E G I O N AL F R E I G H T M O B I L I T Y P L AN2
Final Report Regional CollaborationFigure 3.1: Freight Plan Study AreaSource: CDM SmithG R E A T E R C H A R L O T T E R E G I O N AL F R E I G H T M O B I L I T Y P L AN3
4THREE PILLARS OF THIS FREIGHT PLANCritical to the success of this Freight Plan is the examination and incorporation of the three pillars ofplanning in this community: Land Use, Economic Development, and Transportation.The linkages between freight mobility and the health of a regional economy have become a tennentof transportation and land use planning in recent years. In both the MAP-21 and FAST Act legislation,freight considerations have increased in significance for transportation planning, identifying andtracking performance measures in project prioritization. The role of freight in the economy is evidentin a variety of areas. The number of trucks on the road are evidence of regional economic activities,such as construction or manufacturing. The economic impact of transportation improvementprojects can be estimated in both direct (job creation during construction, for example) and indirect(access to developable real estate for the introduction of industrial, warehousing or retail jobs, forexample) impacts. For the Charlotte region, freight mobility planning is critical to help the region’splanners and leadership identify how to find the balance between supporting the current demand forfreight mobility, by all modes of transport, as well as identify the future demands and potential forland use development that is supported by the existing and planned transportation infrastructure.To work toward this balance, planners and the traveling public need a comprehensive understandingof the economic activity and the transportation system required to move freight within the Charlotteregion. The following sections are presented to set the context of the remainder of the Freight Plan.4.1POPULATION TRENDSThe Charlotte metropolitan region has experienced steady growth in population and employmenttrends. To best understand the land use patterns of the region, the Freight Plan consideredpopulation and employment trends to establish the context of land use planning across the region.Growth in population as an indicator of the general health of the community, and the employmenttrends demonstrate the health of the economy and what industries support the region.Population growth in North and South Carolina is well over the national average at 5.3 and 5.5percent (respectively) compared to 4.1 percent nationally between 2010 and 2015, as detailed inTable 4.1. This signals healthy growth in population, which is typical for the Southeastern UnitedStates. This also signals to planners that the community is not in a decline and that forecasts in trafficdemand will increase for autos and trucks, and the retail demands will also continue to increase.Table 4.1: North Carolina, South Carolina, and U.S. Population Comparison (2010 and 2015)Population20102015% 2,8025.3%SC4,625,4014,896,1465.9%Source: US CensusThe Greater Charlotte Region continues to grow, even ahead of the national and state totals.Between 2010 and 2014, the 14-county study area grew 6.6 percent with the bulk of that growthG R E A T E R C H A R L O T T E R E G I O N AL F R E I G H T M O B I L I T Y P L AN4
Final Report Three Pillars of This Freight Planhappening in the more urban areas of Mecklenburg, Union, Iredell, Cabarrus, Lincoln Counties inNorth Carolina and in York County, SC, as detailed in Table 4.2.Table 4.2: Regional Population (2010, 2014, and 2040)Population2010Union County, North CarolinaMecklenburg County, North CarolinaIredell County, North CarolinaCabarrus County, North CarolinaLincoln County, North CarolinaYork County, South CarolinaRowan County, North CarolinaAnson County, North CarolinaLancaster County, South CarolinaStanly County, North CarolinaChester County, South CarolinaUnion County, South 6060,60032,33727,8762010-2014% 40% %15.6%14.7%-7.4%Source: US Census; SCDOT and NCDOT Statewide Travel Demand Model Forecasts4.2ECONOMIC INDICATORSOne of the key drivers of population growth within a region is the availability of jobs. As thepopulation of the greater Charlotte region grows, the demand for housing, retail trade, commercialand professional services, and other land uses absorbs the most strategic locations pushing businessand industry further and further away from the employees they need. As the journey to workbecomes more expensive it is often the people who truly need access to employment opportunitieswho are least able to afford the cost of getting to work.More and more employers recognize the value of integrating places where people work with placeswhere people live. When many businesses evaluate locations for facility expansion they ask abouttransit services, ride sharing, and affordable housing near business concentrations. Land assets thatcan support freight facilities and services and a growing economy is essential to the Charlotteregion’s economic future. From an economic developer’s perspective, the regional freight land useanalysis is an in-depth study of a key value proposition, now can the region preserve strategic landassets where there are critical freight assets to support business expansion and new industrydevelopment.Consider the relationship between freight, manufacturing, and employment. Over 140,000 jobs inthe Greater Charlotte Region are in manufacturing and this sector is a transportation dependentindustrial sector expending over 9 percent on transportation per dollar of output. 1 The Freight Planand Appendix E give economic developers the data required to make a strong business case forpreserving strategic industrial sites in the region that link priority freight corridors with existing0F1Centralina Manufacturing Ecosystem Development Strategy, September, 2015G R E A T E R C H A R L O T T E R E G I O N AL F R E I G H T M O B I L I T Y P L AN5
Final Report Three Pillars of This Freight Planfreight acreage. The manufacturing sector in the Charlotte region employs nearly 12 percent of theregion’s workforce and equally important 93 percent of total goods exports from the State of NorthCarolina are manufactured goods that support an additional 164,023 jobs in the state. 21FBetween 2012 and 2013 there was a 3.6 percent increase in employment throughout the region.During this period, most of the job increases have occurred in Mecklenburg County, with only LincolnCounty, NC and Union County, SC showing employment decreases, as detailed in Table 4.3.Forecasting to 2040, though, demonstrates a slightly different pattern of growth in jobs. Nine of thefourteen study area counties are expected to see the number of jobs at least double by 2040.Table 4.3: Regional Employment (2012, 2013, and 2040)County2012Union County, North CarolinaCabarrus County, North CarolinaAnson County, North CarolinaChester County, South CarolinaMecklenburg County, North CarolinaLincoln County, North CarolinaIredell County, North CarolinaYork County, South CarolinaLancaster County, South CarolinaStanly County, North CarolinaCleveland County, North CarolinaGaston County, North CarolinaRowan County, North CarolinaUnion County, South 013% 0% 5.7%100.2%90.2%90.2%86.3%64.5%59.2%Source: US Census; SCDOT and NCDOT Statewide Travel Demand ModelIn addition to understanding employment trends, planners track trends in exports to set the contextfor regional freight planning. Exports are a critical component of a regional economy. Not only doexports represent trade, they also stimulate local economic activity by creating employment,increased production and revenues. In 2015, Charlotte’s top export markets, in order, were Mexico,Canada, China, Germany and France, as detailed in Table 4.4.Table 4.4: Top Charlotte Region Export Countries (2015)CountryValueShareMexicoCanada 5.57 billion 2.2 billion39.79%15.96%ChinaGermanyFrance 584 million 458 million 426 million4.17%3.27%3.04%Source: Office of Trade and Economic Analysis.2North Carolina Manufacturing, National Association of Manufacturing 2015G R E A T E R C H A R L O T T E R E G I O N AL F R E I G H T M O B I L I T Y P L AN6
Final Report Three Pillars of This Freight PlanIn 2015, top export sectors from Charlotte were transportation equipment, machinery (exceptelectrical), chemicals, plastics and rubber products, and textiles and fabrics, as shown in Table 4.5.Charlotte is also a major metropolitan area exporter of textiles and fabrics; primary metalmanufacturing; fabricated metal products; nonmetallic mineral products; and textile product mills.Table 4.5: Top Charlotte Region Export Sectors (2015)SectorValueShareTransportation EquipmentMachinery, Except ElectricalChemicalsPlastics and Rubber 4.3 billion 2.3 billion 1.8 billion 854 million30.6%16.7%13.1%6.1%Textiles and Fabric 743 million5.3%Source: Office of Trade and Economic Analysis.In 2015, the Charlotte metropolitan area was the 23rd largest export market in the United States,with merchandise shipments totaling 14 billion. This reflects a 9 percent increase over the previousyear. This is up 7.7 billion (122 percent) from the 6.3 billion in merchandise exported in 2012. In2014 (latest data available), 3,074 small- or medium-sized exporters (SMEs), companies with fewerthan 500 employees, exported goods from the Charlotte metropolitan area.4.3TRANSPORTATION SYSTEM CONDITIONSCoupled with the growth in economic activity in the areas of manufacturing and distribution, thegrowth in congestion on the region’s highways and railroads has continued to frustrate commutersand freight transporters alike. According to the Texas Transportation Institute (TTI) 2015 AnnualMobility Scorecard, dated August 2015, Charlotte NC-SC region ranks 29th in the nation for TravelTime Index (1.23) and 47th in the nation for annual truck congestion cost of 131 million.Travel time index is defined as the ratio of travel time in the peak period to the travel time at freeflow conditions. Truck congestion cost is defined as the value of increased travel time and otheroperating costs of large trucks, estimated at 94.04 per hour of truck time and the extra dieselconsumed delay based on average cost per gallon. These metrics become significant when comparingthe Charlotte region to peer cities particularly when perspective companies are looking to relocate orexpand into a region. A comparison in these performance measures are presented in Table 4.6.In summary, the Charlotte Regional Freight Mobility Plan represents a comprehensive planning effortthat includes considerations of the demands of land use trends and population growth, economicindicators, and the performance of the transportation network connecting the region. With theseconsiderations, the plan synthesized both data analysis and stakeholder feedback to produce thisplan document. This Freight Plan is inclusive of recommendations to support a balanced approach toregional planning to support the safe, reliable and efficient movement of goods into, out of, andthrough the Charlotte region.G R E A T E R C H A R L O T T E R E G I O N AL F R E I G H T M O B I L I T Y P L AN7
Final Report Three Pillars of This Freight PlanTable 4.6: Comparison of Highway Performance Measures, Southeastern United States (2015)Atlanta, GATravel Time IndexValueRank1.2425Charlotte, NC-SCCharleston, SCVirginia Beach, VAColumbia, SCKnoxville, TNRaleigh, NCRichmond, VAGreensboro, NCWinston-Salem, NC1.231.231.191.151.141.171.131.11.11Urban Area292942768154889997Truck Congestion Cost( 6699396Source: Texas Transportation Institute, 2015 Urban Mobility Scorecard, August 2015G R E A T E R C H A R L O T T E R E G I O N AL F R E I G H T M O B I L I T Y P L AN8
5PLAN DEVELOPMENTThe Greater Charlotte Regional Freight Plan i
GREATER CHARLOTTE REGIONAL FREIGHT MOBILITY PLAN 2 2 THE PURPOSE OF THIS FREIGHT PLAN This Freight Plan should be used for three principal purposes: 1. Data resource: a great deal of data has been compiled in the development of this plan. Warehoused by CCOG, infrastructure, parking, land use and other relevant data are available