Transcription
BOCK C25 0321570448 pp3.qxd11/26/086:10 PMPage 609Review of Part VI609PAR TREVIEW OF PART VIVILearning About the WorldQuick ReviewWe continue to explore how to answer questions about thestatistics we get from samples and experiments. In this part,those questions have been about means—means of one sample, two independent samples, or matched pairs. Here’s abrief summary of the key concepts and skills:u A confidence interval uses a sample statistic to estimate arange of possible values for a parameter of interest.u A hypothesis test proposes a model, then examines theplausibility of that model by seeing how surprising ourobserved data would be if the model were true.u Statistical inference procedures for proportions are basedon the Central Limit Theorem. We can make inferencesabout a single proportion or the difference of two proportions using Normal models.u Statistical inference procedures for means are also basedon the Central Limit Theorem, but we don’t usually knowthe population standard deviation. Student’s t-modelstake into account the additional uncertainty of independently estimating the standard deviation. We can make inferences about one mean, the differenceof two independent means, or the mean of paired differences using t-models. No inference procedure is valid unless the underlyingassumptions are true. Always check the conditions before proceeding. Because t-models assume that samples are drawn fromNormal populations, data in the sample should appearto be nearly Normal. Skewness and outliers are particularly problematic, especially for small samples. When there are two variables, you must think carefullyabout how the data were collected. You may use twosample t procedures only if the groups are independent. Unless there is some obvious reason to suspect that twoindependent populations have the same standard deviation, you should not pool the variances. It is neverwrong to use unpooled t procedures. If the two groups are somehow paired, the data are notfrom independent groups. You must use matched-pairst procedures.Now for some opportunities to review these concepts. Becareful. You have a lot of thinking to do. These review exercises mix questions about proportions and means. You have todetermine which of our inference procedures is appropriate ineach situation. Then you have to check the proper assumptions and conditions. Keeping track of those can be difficult,so first we summarize the many procedures with their corresponding assumptions and conditions on the next page. Lookthem over carefully . . . then, on to the Exercises!
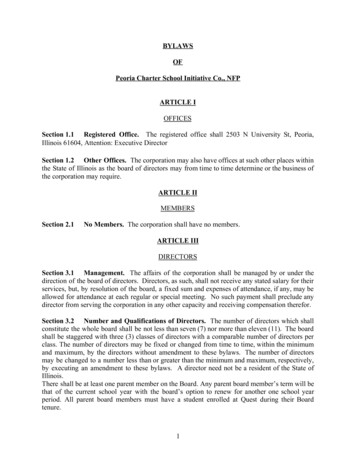
BOCK C25 0321570448 pp3.qxd610PART VI11/26/086:10 PMPage 610Learning About the WorldQuick Guide to InferenceThinkInferenceabout?Onegroupor ionz-Interval1-Proportionz-Testp̂q̂zpp̂p0 q0p̂1 q̂1zp1 - p2p̂1 - p̂2mytdf 5 n 2 1Twoindependentgroups2-Sample t-Test2-Sample t-Intervaltdf fromtechnologym1 - m2y1 - y2MatchedpairsPaired t-TestPaired t-Intervaltdf 5 n 2 1mdd3. Both groups are sufficiently large.Means (t ) One sample (df 5 n 2 1)1. Individuals are independent.2. Population has a Normal model. Matched pairs (df 5 n 2 1)1. Data are matched.2. Individuals are independent.3. Population of differences is Normal. Two independent groups (df from technology)1. Groups are independent.2. Data in each group are independent.3. Both populations are Normal.p̂2 q̂2B n1t-Intervalt-TestProportions (z) One sample1. Individuals are independent.2. Sample is sufficiently large. Two groups1. Groups are independent.2. Data in each group are independent.20, 21B nOnesampleAssumptions for Inference19B �q̂B n1p̂q̂ n2 n2,p̂ 5y1 y2n1 n2s2ns 21s 22 B n1n2sd22222324252nAnd the Conditions That Support or Override Them1. SRS and n , 10% of the population.2. Successes and failures each 10.1. (Think about how the data were collected.)2. Both are SRSs and n , 10% of populationsOR random allocation.3. Successes and failures each 10 for both groups.1. SRS and n , 10% of the population.2. Histogram is unimodal and symmetric.*1. (Think about the design.)2. SRS and n , 10% OR random allocation.3. Histogram of differences is unimodal and symmetric.*1. (Think about the design.)2. SRSs and n , 10% OR random allocation.3. Both histograms are unimodal and symmetric.*(*less critical as n increases)
BOCK C25 0321570448 pp3.qxd11/26/086:10 PMPage 611Review Exercises611REVIEW EXERCISES1. Crawling. A study published in 1993 found that babiesborn at different times of the year may develop the abilityto crawl at different ages! The author of the study suggested that these differences may be related to the temperature at the time the infant is 6 months old. (Bensonand Janette, Infant Behavior and Development [1993])a) The study found that 32 babies born in Januarycrawled at an average age of 29.84 weeks, with a standard deviation of 7.08 weeks. Among 21 July babies,crawling ages averaged 33.64 weeks, with a standarddeviation of 6.91 weeks. Is this difference significant?b) For 26 babies born in April the mean and standard deviation were 31.84 and 6.21 weeks, while for 44 October babies the mean and standard deviation of crawling ages were 33.35 and 7.29 weeks. Is this differencesignificant?c) Are these results consistent with the researcher’sconjecture?T2. Mazes and smells. Canpleasant smells improvelearning? Researchers timed21 subjects as they tried tocomplete paper-and-pencilmazes. Each subject attempted a maze both withand without the presence of afloral aroma. Subjects wererandomized with respect towhether they did the scentedtrial first or second. Is thereany evidence that the floralscent improved the subjects’ability to complete the mazes?(A. R. Hirsch and L. H. Johnston, “Odors and Learning.”Chicago: Smell and TasteTreatment and ResearchFoundation)Drug NameUnited 48.432.048.133.742.654.964.543.152.844.34. Drugs. In a full-page ad that ran in many U.S. newspapers in August 2002, a Canadian discount pharmacylisted costs of drugs that could be ordered from a Website in Canada. The table compares prices (in US ) forcommonly prescribed ) Give a 95% confidence interval for the average savingsin dollars.b) Give a 95% confidence interval for the average savingsin percent.c) Which analysis is more appropriate? Why?d) In small print the newspaper ad says, “Complete listof all 1500 drugs available on request.” How does thiscomment affect your conclusions above?Time to Completethe Maze (sec)3. Women. The U.S. CensusBureau reports that 26% of allU.S. businesses are owned bywomen. A Colorado consulting firm surveys a randomsample of 410 businesses inthe Denver area and finds that 115 of them have womenowners. Should the firm conclude that its area is unusual? Test an appropriate hypothesis and state yourconclusion.TCost per 100 PillsT5. Pottery. Archaeologists can use the chemical composition of clay found in pottery artifacts to determinewhether different sites were populated by the sameancient people. They collected five samples of Romano–British pottery from each of two sites in Great Britain andmeasured the percentage of aluminum oxide in each.Based on these data, do you think the same people usedthese two kiln sites? Base your conclusion on a 95% confidence interval for the difference in aluminum oxide content of pottery made at the sites. (A. Tubb, A. J. Parker,and G. Nickless, “The Analysis of Romano–British Pottery by Atomic Absorption Spectrophotometry.”Archaeometry, 22[1980]:153–171)Ashley RailsNew Forest19.120.814.818.016.718.018.315.817.718.36. Streams. Researchers in the Adirondack Mountainscollect data on a random sample of streams each year.One of the variables recorded is the substrate of thestreams—the type of soil and rock over which they flow.The researchers found that 69 of the 172 sampled streamshad a substrate of shale. Construct a 95% confidence interval for the proportion of Adirondack streams with ashale substrate. Clearly interpret your interval in context.
BOCK C25 0321570448 pp3.qxd612PART VI11/26/086:10 PMPage 612Learning About the World7. Gehrig. Ever since Lou Gehrig developed amyotrophiclateral sclerosis (ALS), this deadly condition has beencommonly known as Lou Gehrig’s disease. Some believethat ALS is more likely to strike athletes or the very fit.Columbia University neurologist Lewis P. Rowlandrecorded personal histories of 431 patients he examinedbetween 1992 and 2002. He diagnosed 280 as having ALS;38% of them had been varsity athletes. The other 151 hadother neurological disorders, and only 26% of them hadbeen varsity athletes. (Science News, Sept. 28 [2002])a) Is there evidence that ALS is more common amongathletes?b) What kind of study is this? How does that affect theinference you made in part a?T8. Teen drinking. A study of the health behavior ofschool-aged children asked a sample of 15-year-olds inseveral different countries if they had been drunk at leasttwice. The results are shown in the table, by gender. Givea 95% confidence interval for the difference in the rates formales and females. Be sure to check the assumptions thatsupport your chosen procedure, and explain what yourinterval means. (Health and Health Behavior Among YoungPeople. Copenhagen: World Health Organization, 2000)Percent of 15-Year-OldsDrunk at Least tlandNo. manyLatviaEstoniaHungaryPolandUSACzech 443393436363232292425189. Babies. The National Perinatal Statistics Unit of theSydney Children’s Hospital reports that the mean birthweight of all babies born in Australia in 1999 was 3361grams—about 7.41 pounds. A Missouri hospital reportsthat the average weight of 112 babies born there lastyear was 7.68 pounds, with a standard deviation of1.31 pounds. If we believe the Missouri babies fairlyrepresent American newborns, is there any evidence thatU.S. babies and Australian babies do not weigh the sameamount at birth?10. Petitions. To get a voter initiative on a state ballot,petitions that contain at least 250,000 valid voter signatures must be filed with the Elections Commission.The board then has 60 days to certify the petitions. Agroup wanting to create a statewide system of universalhealth insurance has just filed petitions with a total of304,266 signatures. As a first step in the process, theBoard selects an SRS of 2000 signatures and checks themagainst local voter lists. Only 1772 of them turn out to bevalid.a) What percent of the sample signatures were valid?b) What percent of the petition signatures submittedmust be valid in order to have the initiative certifiedby the Elections Commission?c) What will happen if the Elections Commission commits a Type I error?d) What will happen if the Elections Commission commits a Type II error?e) Does the sample provide evidence in support of certification? Explain.f ) What could the Elections Commission do to increasethe power of the test?11. Feeding fish. In the midwestern United States, a largeaquaculture industry raises largemouth bass. Researcherswanted to know whether the fish would grow better iffed a natural diet of fathead minnows or an artificial dietof food pellets. They stocked six ponds with bass fingerlings weighing about 8 grams. For one year, the fish inthree of the ponds were fed minnows, and the otherswere fed the commercially prepared pellets. The fishwere then harvested, weighed, and measured. The bassfed a natural food source had a higher average length(19.6 cm) and weight (95.9 g) than those fed the commercial fish food (17.3 cm and 72.0 g, respectively). The researchers reported P-values for differences in both measurements to be less than 0.001.a) Explain to someone who has not studied Statisticswhat the P-values mean here.b) What advice should the researchers give the peoplewho raise largemouth bass?c) If that advice turns out to be incorrect, what type oferror occurred?T 12. Risk.A study of auto safety determined the number ofdriver deaths per million vehicle sales, classified by typeof vehicle. The data on the next page are for 6 midsize
BOCK C25 0321570448 pp3.qxd11/26/086:10 PMPage 613Review Exercisesmodels and 6 SUVs. Wondering if there is evidence thatdrivers of SUVs are safer, we hope to create a 95% confidence interval for the difference in driver death rates forthe two types of vehicles. Are these data appropriate forthis inference? Explain. (Ross and Wenzel, An Analysis ofTraffic Deaths by Vehicle Type and Model, March 2002)MidsizeSUV475554606462767688919710913. Age. In a study of how depression may affect one’sability to survive a heart attack, the researchers reportedthe ages of the two groups they examined. The mean ageof 2397 patients without cardiac disease was 69.8 years(SD 8.7 years), while for the 450 patients with cardiacdisease, the mean and standard deviation of the ageswere 74.0 and 7.9, respectively.a) Create a 95% confidence interval for the difference inmean ages of the two groups.b) How might an age difference confound these researchfindings about the relationship between depressionand ability to survive a heart attack?14. Smoking. In the depression and heart attack researchdescribed in Exercise 13, 32% of the diseased group weresmokers, compared with only 23.7% of those free of heartdisease.a) Create a 95% confidence interval for the difference inthe proportions of smokers in the two groups.b) Is this evidence that the two groups in the study weredifferent? Explain.c) Could this be a problem in analyzing the results of thestudy? Explain.15. Computer use. A Gallup telephone poll of 1240 teensconducted in 2001 found that boys were more likely thangirls to play computer games, by a margin of 77% to 65%.Equal numbers of boys and girls were surveyed.a) What kind of sampling design was used?b) Give a 95% confidence interval for the difference ingame playing by gender.c) Does your confidence interval suggest that among allteens a higher percentage of boys than girls play computer games?16. Recruiting. In September 2002, CNN reported on amethod of grad student recruiting by the Haas School ofBusiness at U.C.-Berkeley. The school notifies applicantsby formal letter that they have been admitted, and alsoe-mails the accepted students a link to a Web site thatgreets them with personalized balloons, cheering, andapplause. The director of admissions says this extra effortat recruiting has really worked well. The school accepts500 applicants each year, and the percentage that actuallychoose to enroll at Berkeley increased from 52% the yearbefore the Web greeting to 54% this year.a) Create a 95% confidence interval for the change inenrollment rates.613b) Based on your confidence interval, are you convincedthat this new form of recruiting has been effective?Explain.T 17. Hearing.Fitting someone for a hearing aid requiresassessing the patient’s hearing ability. In one method ofassessment, the patientlistens to a tape of 50 EngSubjectList A List Blish words. The tape isplayed at low volume,12426and the patient is asked23224to repeat the words. The32022patient’s hearing ability41418score is the number of53224words perceived cor62230rectly. Four tapes of72022equivalent difficulty are82628available so that each ear92630can be tested with more103816than one hearing aid.113018These lists were created121634to be equally difficult to133632perceive in silence, but143234hearing aids must work153832in the presence of back161418ground noise. Re172620searchers had 24 subjects181420with normal hearing com193840pare two of the tapes202026when a background noise211414was present, with the or221814der of the tapes random232230ized. Is it reasonable to243442assume that the two listsare still equivalent forpurposes of the hearing test when there is backgroundnoise? Base your decision on a confidence interval for themean difference in the number of words people mightmisunderstand. (Faith Loven, A Study of the InterlistEquivalency of the CID W-22 Word List Presented in Quietand in Noise. University of Iowa [1981])18. Cesareans. Some people fear that differences in insurance coverage can affect healthcare decisions. A survey ofseveral randomly selected hospitals found that 16.6% of223 recent births in Vermont involved cesarean deliveries,compared to 18.8% of 186 births in New Hampshire. Isthis evidence that the rate of cesarean births in the twostates is different?T 19. Newspapers.Who reads the newspaper more, menor women? Eurostat, an agency of the European Union(EU), conducts surveys on several aspects of daily lifein EU countries. Recently, the agency asked samples of1000 respondents in each of 14 European countrieswhether they read the newspaper on a daily basis. Thetable on the next page shows the data.
BOCK C25 0321570448 pp3.qxd614PART VI11/26/086:10 PMPage 614Learning About the World% Reading aNewspaper 7.063.074.124.190.088.030.4a) Examine the differences in the percentages for eachcountry. Which of these countries seem to be outliers?What do they have in common?b) After eliminating the outliers, is there evidence that inEurope men are more likely than women to read thenewspaper?T 20. Meals.A college student is on a “meal program.” Hisbudget allows him to spend an average of 10 per day forthe semester. He keeps track of his daily food expenses for2 weeks; the data are given in the table. Is there strong evidence that he will overspend his food allowance? Explain.DateCost ( )DateCost ( 9.0121. Wall Street. In September of 2000, the Harris Pollorganization asked 1002 randomly sampled Americanadults whether they agreed or disagreed with the following statement:Most people on Wall Street would be willing to break thelaw if they believed they could make a lot of money and getaway with it.Of those asked, 60% said they agreed with this statement.We know that if we could ask the entire population ofAmerican adults, we would not find that exactly 60%think that Wall Street workers would be willing to breakthe law to make money. Construct a 95% confidence interval for the true percentage of American adults whoagree with the statement.22. Teach for America. Several programs attempt toaddress the shortage of qualified teachers by placinguncertified instructors in schools with acute needs—oftenin inner cities. A 1999–2000 study compared studentstaught by certified teachers to others taught by uncertified teachers in the same schools. Reading scores of thestudents of certified teachers averaged 35.62 points withstandard deviation 9.31. The scores of students instructedby uncertified teachers had mean 32.48 points with standard deviation 9.43 points on the same test. There were44 students in each group. The appropriate t procedurehas 86 degrees of freedom. Is there evidence of lowerscores with uncertified teachers? Discuss. (The Effectiveness of “Teach for America” and Other Under-certified Teachers on Student Academic Achievement: A Case of HarmfulPublic Policy. Education Policy Analysis Archives [2002])T 23. Legionnaires’ disease.In 1974, the Bellevue-StratfordHotel in Philadelphia was the scene of an outbreak of whatlater became known as legionnaires’ disease. The cause ofthe disease was finally discovered to be bacteria thatthrived in the air-conditioning units of the hotel. Ownersof the Rip Van Winkle Motel, hearing about the BellevueStratford, replaced their air-conditioning system. The following data are the bacteria counts in the air of eightrooms, before and after a new air-conditioning system wasinstalled (measured in colonies per cubic foot of air). Hasthe new system succeeded in lowering the bacterial count?Base your analysis on a confidence interval. Be sure to listall your assumptions, methods, and conclusions.Room 3.8128.310.512.113.712116312526423321832432524. Teach for America, Part II. The study described inExercise 22 also looked at scores in mathematics andlanguage. Here are software outputs for the appropriatetests. Explain what they show.MathematicsT-TEST OF Mu(1) – Mu(2) 0Mu(Cer t) – Mu(NoCer t) 4.53t (86) 2.95p 0.002t (84) 1.71p 0.045LanguageT-TEST OF Mu(1) - Mu(2) 0Mu(Cer t) – Mu(NoCer t) 2.1325. Bipolar kids. The June 2002 American Journal of Psychiatry reported that researchers used medication and psychotherapy to treat children aged 7 to 16 who exhibitbipolar symptoms. After 2 years, symptoms had clearedup in only 26 of the 89 children involved in the study.
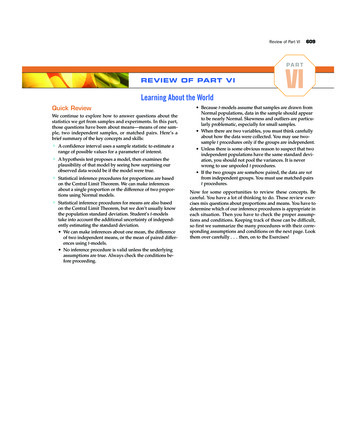
BOCK C25 0321570448 pp3.qxd11/26/086:10 PMPage 615Review Exercisesa) Write a 95% confidence interval; interpret it in context.b) If researchers subsequently hope to produce an estimate of treatment effectiveness for bipolar disorderthat has a margin of error of only 6%, how many patients should they study?T 26. Online testing.The EdSubjectPaperOnlineucational Testing Serviceis now administering sevTest ATest Beral of its standardized11413tests online—the CLEP21013and GMAT exams, for ex3168ample. Since taking a test41514on a computer is different51716from taking a test with61411pencil and paper, one7912wonders if the scores will81212be the same. To investi91616gate this question, re10714searchers created two versions of an SAT-type testTest BTest Aand got 20 volunteers to11813participate in an experi121113ment. Each volunteer took131517both versions of the test,141113one with pencil and paper151314and the other online. Sub1699jects were randomized17159with respect to the order181415in which they sat for the191612tests (online/paper) and20810which form they took(Test A, Test B) in whichenvironment. The scores (out of a possible 20) are summarized in the table.a) Were the two forms (A/B) of the test equivalent interms of difficulty? Test an appropriate hypothesisand state your conclusion.b) Is there evidence that the testing environment (paper/online) matters? Test an appropriate hypothesisand state your conclusion.27. Bread. Clarksburg Bakery is trying to predict howmany loaves of bread to bake. In the last 100 days, thebakery has sold between 95 and 140 loaves per day. Hereare a histogram and the summary statistics for the number of loaves sold for the last 100 days.Summary of Sales1031009.0009514097105.55040# of DaysMeanMedianSDMinMaxQ1Q3302010095120# of Loaves Solda) Can you use these data to estimate the number ofloaves sold on the busiest 10% of all days? Explain.145615b) Explain why you can use these data to construct a 95%confidence interval for the mean number of loavessold per day.c) Calculate a 95% confidence interval and carefullyinterpret what that confidence interval means.d) If the bakery would have been satisfied with a confidence interval whose margin of error was twiceas wide, how many days’ data could they haveused?e) When the bakery opened, the owners estimated thatthey would sell an average of 100 loaves per day. Doesyour confidence interval provide strong evidence thatthis estimate was incorrect? Explain.T 28. Irises.Can measurements of the petal length of flowersbe of value when you need to determine the species of acertain flower? Here are the summary statistics frommeasurements of the petals of two species of irises. (R. A.Fisher, “The Use of Multiple Measurements in AxonomicProblems.” Annals of Eugenics 7 DMinMaxLower QuartileUpper 4.005.36230564047a) Make parallel boxplots of petal lengths for the twospecies.b) Describe the differences seen in the boxplots.c) Write a 95% confidence interval for the difference inpetal length.d) Explain what your interval means.e) Based on your confidence interval, is there evidence ofa difference in petal length? Explain.29. Insulin and diet. A study published in the Journal ofthe American Medical Association examined people to seeif they showed any signs of IRS (insulin resistance syndrome) involving major risk factors for Type 2 diabetesand heart disease. Among 102 subjects who consumeddairy products more than 35 times per week, 24 wereidentified with IRS. In comparison, IRS was identified in85 of 190 individuals with the lowest dairy consumption,fewer than 10 times per week.a) Is this strong evidence that IRS risk is different in people who frequently consume dairy products than inthose who do not?b) Does this indicate that diary consumption influencesthe development of IRS? Explain.30. Speeding. A newspaper report in August 2002 raisedthe issue of racial bias in the issuance of speeding tickets.The following facts were noted: 16% of drivers registered in New Jersey are black.
BOCK C25 0321570448 pp3.qxd616PART VI11/26/086:10 PMPage 616Learning About the World Of the 324 speeding tickets issued in one month on a65-mph section of the New Jersey Turnpike, 25% wentto black drivers.a) Is the percentage of speeding tickets issued to blacksunusually high compared to registrations?b) Does this suggest that racial profiling may be present?c) What other statistics would you like to know aboutthis situation?T 31. Rainmakers?In an experiment to determine whetherseeding clouds with silver iodide increases rainfall, 52clouds were randomly assigned to be seeded or not. Theamount of rain they generated was then measured (inacre-feet). Create a 95% confidence interval for the average amount of additional rain created by seeding clouds.Explain what your interval nSDIntQRange25 0650.787337.60092.40075 %ile16343032. Fritos. As a project for an introductory Statistics course,students checked 6 bags of Fritos marked with a netweight of 35.4 grams. They carefully weighed the contents of each bag, recording the following weights (ingrams): 35.5, 35.3, 35.1, 36.4, 35.4, 35.5. Is there evidencethat the mean weight of bags of Fritos is less thanadvertised?a) Write appropriate hypotheses.b) Check the assumptions for inference.c) Test your hypothesis using all 6 weights.d) Retest your hypothesis with the one unusually highweight removed.e) What would you conclude about the stated weight?T 33. Color or text?In an experiment, 32 volunteer subjectsare briefly shown seven cards, each displaying the nameof a color printed in a different color (example: red, blue,and so on). The subject is asked to perform one of twotasks: memorize the order of the words or memorize theorder of the colors. Researchers record the number ofcards remembered correctly. Then the cards are shuffledand the subject is asked to perform the other task. Thetable displays the results for each subject. Is there anyevidence that either the color or the written word dominates perception?a) What role does randomization play in thisexperiment?b) Test appropriate hypotheses and state 343635376454334734. And it means? Every statement about a confidence interval contains two parts: the level of confidence and theinterval. Suppose that an insurance agent estimating themean loss claimed by clients after home burglaries created the 95% confidence interval ( 1644, 2391).a) What’s the margin of error for this estimate?b) Carefully explain what the interval means.c) Carefully explain what the confidence level means.35. Batteries. We work for the “Watchdog for the Consumer” consumer advocacy group. We’ve been asked tolook at a battery company that claims its batteries last anaverage of 100 hours under normal use. There have beenseveral complaints that the batteries don’t last that long,so we decide to test them. To do this, we select 16 batteries and run them until they die. They lasted a mean of97 hours, with a standard deviation of 12 hours.a) One of the editors of our newsletter (who does notknow statistics) says that 97 hours is a lot less than theadvertised 100 hours, so we should reject the company’sclaim. Explain to him the problem with doing that.b) What are the null and alternative hypotheses?c) What assumptions must we make in order to proceedwith inference?d) At a 5% level of significance, what do you conclude?e) Suppose that, in fact, the average life of the company’sbatteries is only 98 hours. Has an error been made inpart d? If so, what kind?36. Hamsters. How large are hamster litters? Among47 golden hamster litters recorded, there were an averageof 7.72 baby hamsters, with a standard deviation of 2.5.a) Create and interpret a 90% confidence interval.b) Would a 98% confidence interval have a larger orsmaller margin of error? Explain.c) How many litters must be used to estimate the average litter size to within 1 baby hamster with 95%confidence?
Babies. The National Perinatal Statistics Unit of the Sydney Children's Hospital reports that the mean birth weight of all babies born in Australia in 1999 was 3361 grams—about 7.41 pounds. A Missouri hospital reports that the average weight of 112 babies born there last year was 7.68 pounds, with a standard deviation of 1.31 pounds.