Transcription
BCH 312Experiment (6)AMINO ACID TITRATION
Objectives To study the titration curves of amino acid. To determine the pKa values. To determine isoelectric point (pI). To determine buffering regions.
Amino acid general formula and classification Amino acids consist of:NH2 )an acidic carboxyl group ( —COOH)a hydrogen atom ( —H)a distinctive side chain ( —R). a basic amino group ( — Classification: Amino acids can be assorted on the basis of the general chemical characteristics of their Rgroups. Non-polar side chain: Non-polar side chain that does not bind or give off or participate inhydrogen or ionic bonds, e.g. Alanine Polar uncharged side chain: The R groups are not ionized in water, but it can participatein hydrogen bond formation, e.g. Serine Acidic side chain (negatively charge): Contains –COO- e.g. Glutamic acid andAspartic acid Basic side chain (positive charge): Contains -NH3 e.g. Arginine, Histidine and lysine
Properties of amino acids Amino acids are Amphoteric which means it can react as an acid(donate a proton) as well as a base (accept a proton) Amphoteric properties of amino acids are due to the presence oftheir ionizable α-amino and α-carboxylic group can act sometimes asacids and sometimes as bases depending on the pH of their media. Each amino acid have a different isoelectric point (pI) pI: It is the pH value at which the positive charge equals the negativecharge (i.e. the net charge of this molecule equals zero) (zwitterion)
Amino acid titration From the amino acid titration curve, we can get importantinformation about amino acid, for example pKa and alsothe pI. Amino acids have more than one pka, because it is polyprotic(contain more than one ionizable groups). Also it provides information about the buffering range ofthe amino acid that is studied. Based on the number of plateaus on a titration curve, onecan determine the number of dissociable protons.
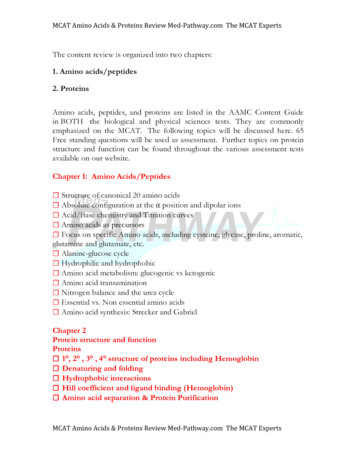
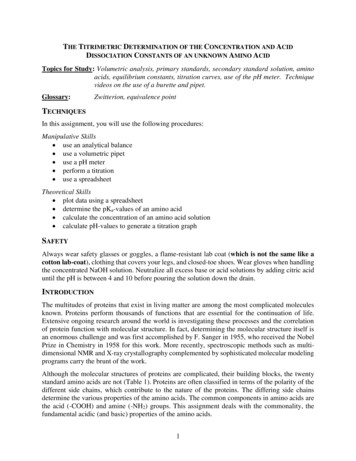
Titration curve of amino acid (glycine)1. At a very low pH (acidic) both groups are fullyprotonated where the solution predominantlycontains:2. When the pH is raised, the –COOH group startto be deprotonated and the proportion will be: 3. pH pKa1, where it will act as a buffer and thesolution will contain an equal amount of :213
Titration curve of amino acid (glycine)4- Further increase in pH, the solutionwill predominantly contains zwitter ionand the pH at this point is equal to pI.55- As the pH increases, the secondgroup –NH3 will be deprotonated4 6- After that, pH pKa2 where it will asa buffer and the solution will containan equal amount of:6
Titration curve of amino acid (glycine) 7-8 7 8- the NH3 group will dissociateand at the same time the glycinefull dissociate in end point
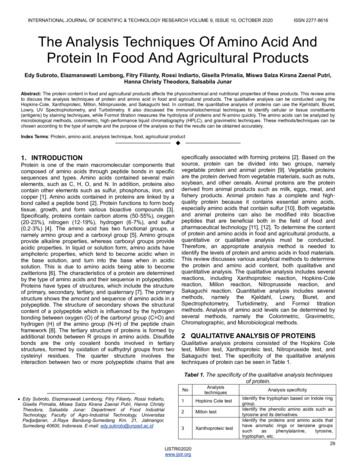
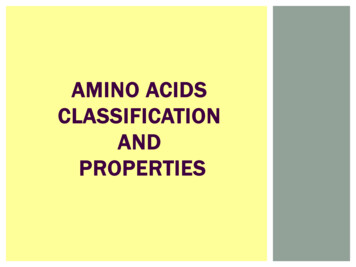
How to determine pI from the curve In diprotic amino acids such asglycine, The pI is an average of thepKa's of the carboxyl (2.34) andammonium (9.60) groups.Thus, the pI for alanine iscalculated to be:(2.34 9.60)/2 5.97.
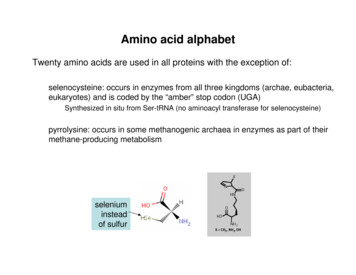
Triprotic amino acids Titration curves of triprotic a.a. are more complex with three stagesà They have 3pKa values. If additional acidic or basic groups are present as side-chain functions, the pI isthe average of the pKa's of the two most similar acids (value). In the case of aspartic acid, the similar acids are the alpha-carboxyl group (pKa 2.1) and the side-chain carboxyl group (pKa 3.9), so pI (2.1 3.9)/2 3.0. For arginine, the similar pKa s values are the pKa for guanidinium group on theside-chain (pKa 12.5) and pKa for alpha-ammonium group (pKa 9.0), so thecalculated pI (12.5 9.0)/2 10.75.
Note:
Method: Pipette 10 ml of alanine solution (0.1 M) into a 50 ml breaker. Add 0.5 ml of ( 0.1 M) HCl from the burette and determine the pH of the solution aftereach addition. Continue adding acid in until pH falls to about 1.3 . Wash the electrode in distilled water titrate a further 10 ml of alanine solution with 0.1M NaOH until pH reaches 12.5. Plot a titration curve for alanine (pH verses titrant in ml). Do the titration of arginine in a similar way and plot their titration curves.Result: Record thetitration table and Plot a Curve ofpH versus ml of NaOH and HCladded. Determine the pka and pI values from your curves and compare them with thestandard values. For alanine: pK1 2.34 , pK2 9.69, pI 6.01 For arginine: pK1 2.17 , pK2 9.04, pK3 12.48, pI 10.76
Discussion :[1] Calculate the pH of the alanine solution after the addition of 0ml, 5ml of0.1M NaOH and calculate pH after addition of 1ml , 2.5ml of HCl[2] Calculate the pH of the arginine solution after the addition of 0ml, 5ml of0.1M NaOH and calculate pH after addition of 0.5 ml , 2 ml of HCl[3] Compare your calculated pH values with those obtained from Curve.[4] At what pH-range did the acid show buffering behavior? What are thechemical species at that region, what are their proportions?
Triprotic amino acids Titration curves of triprotic a.a. are more complex with three stages!They have 3 pKa values. If additional acidic or basic groups are present as side-chain functions, the pI is the average of the pK a's of the two most similar acids (value). In the case of aspartic acid, the similar acids are the alpha-carboxyl group (pK