Transcription
Overview of Men’s Healthin the Northern Territory
AcknowledgementsThe authors are grateful to the following organisations which assisted in the production of this report: Chronic Conditions Strategy Unit, Northern Territory Department of Health Health Gains Branch Northern Territory Department of HealthDr Laura Edwards and Frank WallnerChronic Diseases and Men’s Health Strategy Units, Health Development Branch, Department of Health, Northern TerritoryNovember 2013This publication is copyright. The information in this report may be freely copied and distributed for Non-profit purposes such as study, research, health service management and public information subject to theinclusion of an acknowledgment of the source. Reproduction for other purposes requires the written permissionof the Chief Executive of the Department of Health, Northern Territory.Suggested citation: Edwards L ,Wallner F. Overview of Men’s Health in the Northern Territory. Northern Territory Departmentof Health, Aug 2013.Enquiries about this report should be directed to:Program LeaderMen’s Health Strategy UnitHealth DevelopmentDepartment of HealthPO Box 40596, Casuarina, NT 0811Telephone:(08) 8985 8170Fax:(08) 8985 8177MensHealth.THS@nt.gov.auemail:Released November 2013
Overview of Men’s Health in the Northern TerritoryContentsTable of Contents 1Introduction 2Key Points 3Life Expectancy 4Mortality 5Specific conditions . 6Injuries and poisoning 6Road Traffic Accidents . 8Suicide . 8Morbidity 10Hospital Separations 10Chronic Conditions 11Cancers . . 12Disability Adjusted Life Years 12Health determinants 14Smoking 14Alcohol 14Overweight and obesity 15Other health risk factors . 15Other Factors influencing men’s health 16Incarceration 16Violence . 16Access to Services . 19Education 19Concluding Comments. 20References 21Overview of Men’s Health in the Northern Territory 20131
Introduction:There has been a growing interest in gender specific approaches to improving health status. The National Men’sHealth Policy (1) released in 2010 was a significant step in recognising that gender based inequalities also affectedmen in terms of health behaviours and outcomes. The release of the policy provided funding for the first specificNational reports on the status of male health in Australia including an Australian Institute of Health and Welfare(AIHW) report on five population groups including Aboriginal and Torres Strait Islander (ATSI) males(2). 6.9 millionwas also allocated over four years for Australia’s first national longitudinal study on male health which is intended topartially mirror the women’s twenty year study which began in 1995. The longtitudinal research project will provideconsiderable information about the life experiences, health determinants, health outcomes and life course for malesin Australia.While the amount of data and information on health conditions and their determinants has become more widelyavailable, this has not been available for the Northern Territory (NT). While NT data collection systems are capableof gender disaggregation of data, this has not been standard practice. Further disaggregation by cultural backgroundis also valuable given the worse health outcomes which affect Indigenous Australians and others from differentpopulations groups such as those from culturally and linguistically diverse backgrounds.For the purposes of developing policy, strategic directions and also targeted program development in male healththe Men’s Health Strategy Unit identified the need to produce an epidemiological overview of male health in theNorthern Territory. This report summarises available data on male health in the Northern Territory (NT) includingseparate reporting for Indigenous and non-Indigenous males. This paper draws from a wide range of data fromnational and NT sources. Where possible every effort was made to use NT data, however when local data wasunavailable national data has had to be used. Results from the Australian Health Survey 2011/2012 conducted by theAustralian Bureau of Statistics (ABS) have been reported as non-Indigenous data in this report however, it should benoted that this survey included a small proportion of Indigenous people.Overview of Men’s Health in the Northern Territory 20132
Key Points Australian men have a life expectancy of 5 years less than women.Life expectancy for NT Aboriginal men is 21 years less than NT non-Aboriginal men and 9.6 years lessthan NT Aboriginal women.The gap between NT Aboriginal males and NT non-Aboriginal males has widened due to the slowimprovement in life expectancy for Aboriginal males.NT males are more likely than NT females to die of almost all of the leading causes of death with theexception of genitourinary causes.The greatest difference in death rates between males and females was seen for injury and poisoning innon-Indigenous Territorians (2.8 higher) and nervous system disorders in Indigenous residents (2.7higher).Males have significantly higher death rates for most injury & poisoning causes- in particular suiciderates which are 4 to 8 times higher in males than females and motor vehicle accidents which arebetween 1.6 and 2.0 times higher.The suicide rate for NT Indigenous males between 2001 and 2005 was 62.9 per 100 000, eight timeshigher than the Indigenous female rate (7.8 per 100 000) and six times the overall Australian suiciderate of 10.5 per 100 000Except for suicide, road traffic accidents (RTA) represent the most significant cause of injury death formales in the Northern Territory. Almost 70% of people admitted to hospital for RTA are male.Lung cancer is the leading cause of cancer death nationally and also in the NT for males. This isfollowed by prostate cancer and colorectal cancer for non-Indigenous NT males and unspecified cancerand lip/oral cancers for Indigenous NT males.Men suffer higher rates of death and disability (Disability Adjusted Life Years) than women across alldisease categories except for diabetes for Indigenous people and acute respiratory infections in nonIndigenous people.Smoking rates are much higher for NT Indigenous males (59.9%) and non-Indigenous males (27.7%)compared to the National rate of 18.2%.Approximately one-third of NT males are drinking at levels which are risky or high risk for healthproblems in the short term.Rates of hospitalisation for alcohol-attributable conditions across the NT were 460 per 10000 amongAboriginal males and 87.4 per 10,000 for non-Aboriginal males.Males are more likely to be overweight or obese than women across all groups however, NT maleshave lower prevalence of obesity compared to the national average.NT males psychological distress scores were lower than NT females and Australian males.96% of prisoners in the NT were men and 82% of all prisoners were Indigenous.Nationally, 50.1% of men report that since the age of 15 they have experienced violence.In the NT one-third of assault victims are male, and of these 29% were domestic violence incidents.Alcohol was involved in 53% of non-Indigenous male and 64% of Indigenous male assault incidents inthe NT.Nationally, men’s use of healthcare services is about 10% less than women. For Aboriginal men in theNT there were approximately one-third less episodes of health care in 2010 compared to Aboriginalwomen.Overview of Men’s Health in the Northern Territory 20133
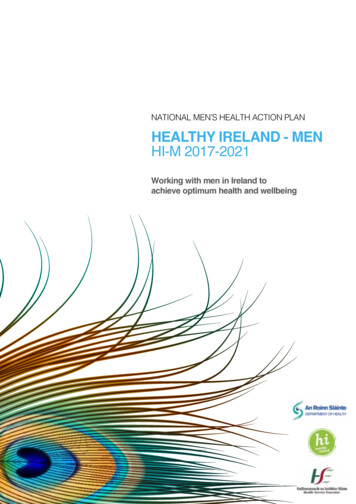
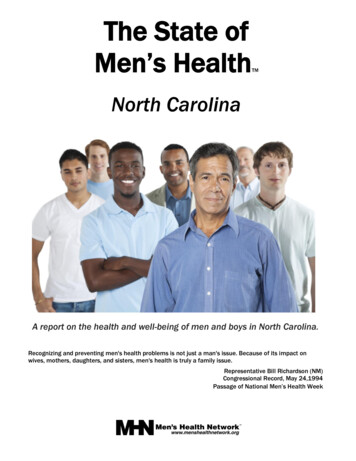
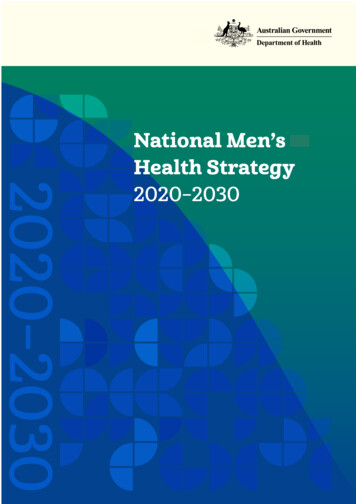
Men’s Health ProfileLife expectancyOverall, across Australia, men have a life expectancy of 5 years less than women (Figure 1). This gap is significantlywider in the NT where Indigenous men have a life expectancy 21 years less than non-Indigenous men and 9.6 yearsless than Indigenous women. Figure 2 shows the change in life expectancy for Aboriginal and non-Aboriginal malescompared to Australian males for the period 1966- 2003. The gap between NT Aboriginal males and NT nonAboriginal males has widened due to the slow improvement in life expectancy for Aboriginal males. In comparison,there has been a narrowing of the life expectancy gap for Aboriginal females compared to non-Aboriginal females inthe NT. NT Aboriginal males have the shortest life expectancy of any population group when compared to malesfrom NSW, QLD, WA (3).The gap in life expectancy between non-Indigenous and Indigenous is the subject of a number of initiatives, such asthe Closing the Gap in the Northern Territory National Partnership between the Commonwealth and NorthernTerritory governments.Figure 1: Life expectancy at birth by Indigenous status and gender, NT and Australia (2006)9085.7858081.280.77069.860NT male Indigenous60.2NT female Indigenous50NT male non-Indigenous40NT female non-IndigenousAustralia male30Australia female20100NT maleIndigenousNT femaleIndigenousNT male non- NT female non- Australia maleIndigenousIndigenousAustraliafemaleSource: Tay E, Li SQ, Guthridge S. Mortality in the Northern Territory, 1967–2006. Department of Health, Darwin, 2012(4)Overview of Men’s Health in the Northern Territory 20134
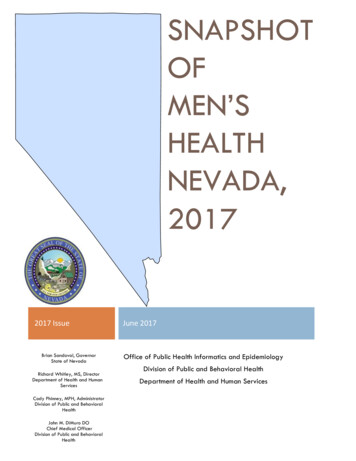
Figure 2: Life expectancy of NT Aboriginal males compared to NT non-Aboriginal males and Australian males.Life expectancy atbirth (years)Indigenous maleNon-Indigenous male100Australian 51988199119941997200020032006YearSource: Tay E, Li SQ, Guthridge S. Mortality in the Northern Territory, 1967–2006. Department of Health, Darwin, 2012MortalityLeading causes of deathThere are significant differences between NT males and females in the leading causes of death. Males are morelikely than females to die of almost all of the leading causes of death with the exception of genitourinary causes.Table 1 shows the death rate per 100000 people for leading causes of death and also the standardised death ratio(SDR) for males and females; Indigenous and non-Indigenous. The greatest difference between males and femaleswas seen for injury and poisoning in non-Indigenous Territorians (rate ratio 2.8) and nervous system disorders inIndigenous residents (rate ratio 2.7).Table 1: Death rates per 100000 for leading causes of death by gender and Indigenous status, enousmale tofemale rateratioMale nonIndigenousFemale nonIndigenousNon-Indigenousmale to 131.52391611.5Injury 471.9Digestive83761.139202.0Endocrine &nutritional1681641.034261.3Overview of Men’s Health in the Northern Territory 20135
317101.7Mental 170.7Source: Tay E, Li SQ, Guthridge S. Mortality in the Northern Territory, 1967–2006. Department of Health, Darwin, 2012Figure 3 shows the SDR’s for leading causes of death. When the graph rises above 1 it represents that the rate ofmale deaths is higher than female deaths. A ratio of 2.0 means that there is twice the number of male deathscompared to female deaths for that cause. The death rate ratio per 100000 is higher for men than women for allconditions except for deaths due to genitourinary conditions in non-Indigenous females.Figure 3: Standardised Death Ratios for leading causes of death by gender and Indigenous status, 1997-200632.5Indigenous Male:Female SDRNon-Indigenous Male:Female SDR21.510.50Specific conditionsInjuries and poisoningIt is nationally recognised that injuries and poisoning disproportionately affect males and data from the NorthernTerritory also confirm this. Table 2 show age adjusted death rates per 100000 people for selected injuries. Across allcauses except for assaults and accidental falls in Indigenous persons, males have significantly higher death rates- inparticular suicide rates which are 4 to 8 times higher in males than females and motor vehicle accidents which arebetween 1.6 and 2.0 times higher.6Overview of Men’s Health in the Northern Territory 2013
Table 2: Age-adjusted death rates per 100,000 for selected injuries, by sex and Indigenous status (2001 to -Non-Non-Indigenousmale toIndigenousIndigenousmale to femalefemale ratiomalesfemalesratioMotor .95.74.7Accidental falls3.64.30.811.87.21.6Fire13.44.03.40.50.0NAAll Other51.934.31.524.18.62.8AccidentSource: Tay E, Li SQ, Guthridge S. Mortality in the Northern Territory, 1967–2006. Department of Health, Darwin, 2012Figure 4 shows the standardised death rate ratios for specific injury causes expressed as an increased percentage forIndigenous and non-Indigenous NT males over females. For example for motor vehicle accidents the 200% figureequates to an SDR of 2.0 indicating that the death rate is twice as high for non-Indigenous males when compared tonon-Indigenous females.Figure 4: Standardised death ratios for NT males expressed as a % excess of deaths compared to femalesExcess male deaths as eOtherCause of deathOverview of Men’s Health in the Northern Territory 20137
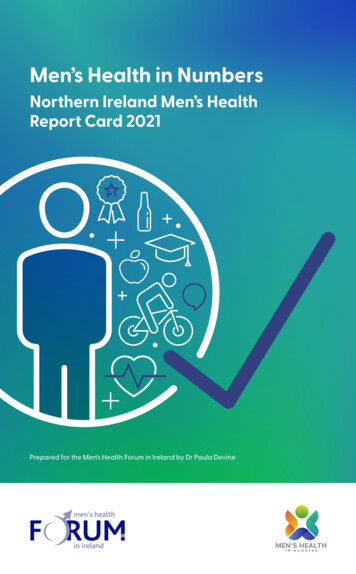
Road Traffic AccidentsOutside of suicide for Indigenous males, road traffic accidents (RTA) represent the most significant cause of injurydeath for males in the Northern Territory. They account for one-quarter of all injury deaths (male and female).Almost 70% of RTA injuries admitted to hospital are male, with over 38% being younger males in the 15-29 years agecategory.Table 3: Demographic characteristics of patients admitted to hospital following a road traffic accident in theNorthern Territory 1999-2007 (22)Source: Flint S. NT Disease Control Bulletin 17 (1), March 2010SuicideSuicide is a critical public health issue for men in the NT. The age-adjusted suicide rate for Indigenous males in theNT between 2001 and 2005 was 62.9 per 100,000, eight times higher than the Indigenous female rate (7.8 per 100000) and six times the overall Australian suicide rate of 10.5 per 100,000 in 2005 (7). Suicide rates for Indigenousmales have increased significantly since the 1980s (Figure 5). Figure 6 shows unconfirmed suicide rates per 100,000for males and females in the Northern Territory. Unconfirmed suicides are those in which the coroner is unable toconclusively confirm that suicide was intended. The male rate is more than four times that of females.Figure 5: Age-adjusted suicide rates by gender and Indigenous status 1981-2002 (number of deaths per 100 1-19951996-2000NT Indigenous malesNT non-Indigenous malesAustralian malesNT Indigenous femalesNT non-Indigenous femalesAustralian femalesOverview of Men’s Health in the Northern Territory 20132001-20058
Sources: NT data: Health Gains Planning, Mortality in the NT, 2012. Australian data: Measey, Suicide in the Northern Territory,(7)MJA 2006Figure 6: NT Unconfirmed Suicide Deaths by Sex, 5 year average 2006-2010 per 100,000 population, (36 p. 9)Overview of Men’s Health in the Northern Territory 20139
MorbidityHospital SeparationsCauses of hospital admissions will change along the life course for both males and females. Figure 7 shows majorcauses of hospital separations for all NT males for the period 2001/02 to 2007/08. Figure 8 shows the major causesof hospital admissions for males aged 15-24 years. Injury and poisoning which includes road transport accidents arethe leading cause of admission for both Indigenous and non-Indigenous males followed by mental disorders.Figure 7: Hospital separations for males in the Northern Territory 2001/02 to 2007/08Source: Hospital Admissions in the Northern Territory, 1976 to 2008. Department of Health, Darwin, 2011Overview of Men’s Health in the Northern Territory 2013(5)10
Figure 6: Principal diagnosis for hospital admission (15–24 year old males)Number ofadmissionsper 1 000 ury andpoisoningMental disordersSkin andsubcutaneoustissue diseasesDigestivediseasesFactorsinfluencinghealth statusRespiratorydiseasesSource: Infancy to Young Adulthood: Health status in the Northern Territory, 2011. Department of Health, Darwin, 2012 (InPress)Chronic ConditionsPrevalence of chronic conditions is difficult to gather especially disaggregated by gender and Aboriginality. Thefollowing information in Table 4 shows prevalence rates for a number of preventable chronic diseases and has beendrawn from a number of data sources which makes direct comparison and interpretation difficult.Table 4: Prevalence of preventable chronic diseases by gender and Indigenous status, Northern Territory (%)MaleIndigenousMale nonIndigenousFemaleIndigenousFemale nonIndigenousSourceZhao et. alNATSIHSsurveyAustralianHealth Survey11/12Zhao et. alNATSIHSAus HealthSurvey 11/12Hypertension8.88.66.9 (selfreport)18.4(measured)4.13.1*10.59.06.4 58.8Ischaemic Heart3.610.5 3.415 DiseaseRenal 8*Rheumatic heartNANANANAdiseaseChronic all numbers should be interpreted with caution Total diseases of the heart and circulatory system#Total disease of the respiratory systemSources: Zhao et al, Estimating chronic disease prevalence among the remote Aboriginal population of the Northern Territoryusing multiple data sources (8), Australian Health Survey(9) and National Australian and Torres Strait Islander Health Survey(10)Overview of Men’s Health in the Northern Territory 201311
Table 4 shows that for most chronic conditions prevalence rates are lower in Aboriginal males than females exceptfor ischaemic heart disease. This is somewhat surprising and is in contrast to the higher mortality rates for malesacross major disease categories. Possible reasons for this may include methodological issues, lower diagnosis inmales compared to females and that Aboriginal men may die prior to the diagnosis of chronic disease.CancersFigure 9 shows the rates of incidence and mortality for various cancer sites for Indigenous and non-Indigenous malesin the Northern Territory. Lung cancer is highly ranked in terms of incidence and also mortality for both populationgroups and is closely related to tobacco smoking. Lung cancer is the leading cancer cause of death nationally formales with 4934 deaths in 2010. This is followed by prostate cancer (3235 deaths) but was the most diagnosed formof cancer overall in Australia with 18560 men diagnosed in 2012 (11). Cancer rates are much lower in Aboriginal malespossibly due to low rates of diagnosis and that they are more likely to die prematurely from other causes.Colorectal cancer is the third most frequent cause of cancer deaths for males and is also one of the most treatable ifdiagnosed early.Figure 9: Age standardised rates of incidence and mortality (per 100,000) of most common cancers (ranked byincidence rate) by sex and Indigenous status in the NT (23).Source: Zhang X et al. Cancer incidence and mortality, Northern Territory 1991–2005. Department of Health and Families,Darwin, 2008Disability Adjusted Life YearsDisability Adjusted Life Years (DALYs) are a measure of the total years of life lost due to premature death and predeath disability. DALYs are calculated using the years of life lost due to premature mortality and the years ofproductive life lost due to disability. Table 5 shows the total DALYs by gender and Indigenous status. The populationnumbers are similar for both genders within the Indigenous and non-Indigenous populations which allows forapproximate comparisons. The male to female ratio for both Indigenous and non-Indigenous Territorians shows thatmen suffer higher rates of death and disability across all disease categories except for diabetes for Indigenouspeople and acute respiratory infections in non-Indigenous people. Overall the male to female ratio was 1.36, whichis higher than the male to female population sex ratio of 1.11 (12) .Overview of Men’s Health in the Northern Territory 201312
Table 5: DALYs by gender, Northern Territory, 1994-1998MaleIndigenousFemaleIndigenousIndigenous maleto female ratioMale nonIndigenousFemale nonIndigenousNon-Indigenousmale to female ratioCardiovasculardiseaseMental diseaseIntentional 12.92.11.41.61.01.63.10.65.2Acute respiratoryinfections2.92.51.20.40.50.8Nervous systemand sense .61.41.11.51.31.2Diabetes1.72.20.51.00.81.3Adapted from Zhao Y et al. Burden of disease and injury in Aboriginal and non-Aboriginal populations in the Northern Territory, MJA 2004 (12)*NB. Not age-standardised and expressed as total DALYs (not by rate)Figure 10: Age-standardised DALY rate per 1000 population by gender and Indigenous status, NT, 1994-1998compared with Australia in 1996400350300250200150100500YLDYLLSource: Zhao Y et al, Burden of disease and injury in Aboriginal and non-Aboriginal populations in the NT, MJA 2004Overview of Men’s Health in the Northern Territory 2013(12)13
Health determinantsSmokingThe NT has the highest smoking prevalence in Australia. In the recent National Health Survey, which is comprisedpredominantly of non-Indigenous Australians, 27.7% of NT men and 22.2% of NT women were current smokers,compared with 18.2% of men and 14.4% of women nationally (9). Overall smoking prevalence has decreased inrecent years, however prevalence for Indigenous Territorians remains very high at almost 60% for males and wellabout 10% above the National average for non-Indigenous NT males (Table 6). Compulsory tobacco sales reportingcommenced in January 2010 which will provide more detailed information on tobacco use and trends in the NT incoming years.Table 6: Crude prevalence of smoking aged 18 years and over, by sex and Indigenous status 2007/08Male (%)Female (%)Total (%)NT Indigenous59.949.954.6NT es: NT Indigenous data: Dept. of Health Northern Territory - Health Gains Planning Fact Sheet: ‘Smoking prevalence NT,2010’ taken from National Aboriginal and Torres Strait Islanders Social Survey 2008. Non-Indigenous data: 2011/12 AustralianHealth SurveySeventeen percent of the health gap between Indigenous and non-Indigenous Australians is reported to be due tosmoking (13). In the NT from 1998 to 2009 there were 5675 smoking-attributable hospitalisations in Indigenous menand 5254 smoking-attributable hospitalisations in women, making up 5.7% and 3.9% of all hospitalisationsrespectively. This is higher than the proportion of smoking-attributable hospitalisations in non-IndigenousTerritorians, 4% and 2.1% for men and women respectively (14) .AlcoholAlcohol is a major contributor to disease and mortality in the NT both directly (such as through chronic liver disease)and indirectly (such as through motor vehicle accidents). Overall, alcohol consumption in the NT has decreased from14.4 litres of pure alcohol per person per year in 2002/2003 to 13.5 litres per person in 2010/2011. Measures ofalcohol consumption between Indigenous and non-Indigenous people are difficult to compare as they are based ondifferent surveys. Female non-Indigenous Territorians are the least likely to drink at risky levels (Table 7). TheNHMRC published revised guidelines on alcohol consumption in 2009, recommending that men and women drink nomore than two standard drinks per day and no more than 4 standard drinks on a single occasion. The most recentAustralian Health Survey reports that 63.4% of males and 45.3% of females exceeded this recommendation in theshort term and 34.5% of males and 14.4% of females exceeded this recommendation on a longer term basis.Table 7: Alcohol consumption by gender and Indigenous status, age 15, NTConsumed alcohol withinprevious 12 monthsShort term risky/high le nonIndigenous91.6Female nonIndigenous85.329.930.333.023.6Overview of Men’s Health in the Northern Territory 201314
Definitions of short or high risk drinking used in Table 7Indigenousnon-IndigenousMale 4 standard drinks/day over 12 months or 7 standard drinks on one occasionFemale 2 standard drinks /day over 12 months or 5 standard drinks on one occasionSources: Dept of Health Northern Territory Health Gains Planning Fact sheet, ‘Alcohol Use in the Northern Territory’; theAustralian Health SurveyRates of hospitalisation for alcohol-attributable conditions across the NT were estimated in 2008-09 to be 460 per10,000 among Aboriginal males and 87.4 per 10,000 for non-Aboriginal males. The rates for females were 387.4 forAboriginal females and 37.2 for non-Aboriginal females. The most common cause of alcohol attributablehospitalisation among NT Aboriginal people was assault injury (37.1%) followed by pancreatitis (12.1%) and epilepsy(9.1%). For non-Aboriginal NT people the most common causes were fall injury (16.9%), occupational/machine injury(13.5%) and assault injury (13.0%) (15). These figures are not available disaggregated by gender.In 2011-12, alcohol was involved in 53% of non-Indigenous male and 64% of Indigenous male assault incidents (16).Overweight and obesityThe prevalence of overweight and obesity is increasing in Australia. The following data are from two differentsources at different periods so should be interpreted with caution. Both surveys used direct measurement ratherthan self report which does provide more accurate results. Males are more likely to be overweight or obese thanwomen across all groups. The prevalence of overweight and obesity in NT Indigenous people is lower than nonIndigenous Territorians and also the national average (Figure 11).Figure 11: Overweight and obesity by gender and Indigenous status, NT and Australia807070.366.658605044.956.241.4403020100NT male nonIndigenousNT maleIndigenousAustralianmalesNT female nonIndigenousNT femaleIndigenousAustralianfemalesSource: Australian Health Survey 2011/12 and National Aboriginal and Torres Strait Islander Health Survey 2004/2005Other health risk factorsTable 8 shows four factors associated with prevention of chronic diseases. Rates of inadequate consumption of fruitand vegetables were higher than the average for Australia. NT males report being slightly less sedentary than NTfemales. Interestingly, NT males psychological distress scores were lower than NT females and also Australian males.Overview of Men’s Health in the Northern Territory 201315
Table 8: Health risk factors by gender, NT and Australia (percentage)NT MaleNT FemaleAustralianmaleAustralianfemaleInadequate fruit62.552.456.247.3Inadequate vegetables93.593.992.990.5Sedentary/low exercise in lastweekHigh/very high psychologicaldistress (Kessler distress scale65.767.862.472.67.011.18.812.7result 21)Source: ABS, Australian Health Survey 2011/12Figure 12: Health risk factors by gender, NT and Australia10090807060NT Male50Australian male40NT Female30Australian female20100Inadequate fruitInadequatevegetablesSedentary/lowexercise in lastweekHigh/very highpsychologicaldistress#Other Factors Influencing Male HealthIncarcerationPrison populations are almost exclusively made up of men. A census of prisoners in 2009 revealed 96% of prisonersin the NT were men and 82% of all prisoners were Indigenous, much higher than the proportion of the NT Indigenouspopulation of 30% (17).ViolenceInterpersonal violence is a significant public health issue for males and females in Australia. The National PublicSafety Survey 2005 (18) shows that the nature of violence is gendered. For example 50.1% of men report that sincethe age of 15 they have experienced violence compared to 39.9% of women. Of this violence, 41% of menexperience physical assault compared to 29% of women. Whereas rates of reported sexual assault of women are17% compared to 4.8% in men. The report also shows that in the 12 months prior to the survey 11% of menexperienced a violent incident compared to 5.8 % of women.Overview of Men’s Health in the Northern Territory 201316
People were three times more likely to experience violence by a man than by a woman. Men were more likely to bephysically assaulted by a stranger in the most recent incident since the age of 15, whereas women were more oftenassaulted by a current and/or previous partner. Of those men who were physically assaulted, 65% were assaulted bya stranger.Figure 13 shows hosp
Overview of Men’s Health in the Northern Territory 2013 6 Nervous system 51 19 2.7 18 17 1.1 Infectious disease 52 39 1.3 17 10 1.7 Mental & behavioural 67 57 1.2 20 19 1.1 Genitourinary 1