Transcription
Copyright 2021 by the author(s). Published here under license by the Resilience Alliance.Palliwoda, J., and J. A. Priess. 2021. What do people value in urban green? Linking characteristics of urban green spaces to users’perceptions of nature benefits, disturbances, and disservices. Ecology and Society 26(1):28. t do people value in urban green? Linking characteristics of urban greenspaces to users’ perceptions of nature benefits, disturbances, and disservicesJulia Palliwoda 1 and Joerg A. Priess 1ABSTRACT. Now, and in the future, the majority of the world’s population is and will be living in cities. Thus, efficient urban greenspaces (UGS), such as urban parks providing ecosystem services, are essential for human well-being. Besides their location, thecharacteristics of UGS, for example, size, availability of facilities (such as sports infrastructure or benches), and green characteristics,can determine the benefits derived or disturbances and disservices perceived by visitors. Knowing which components of UGS contributeto which benefits can help to meet the various demands of urban dwellers. The objective of this research is to present positive andnegative aspects (benefits and disturbances/disservices, respectively) of UGS that people perceive and the difference in these perceptionsacross age groups and UGS. We surveyed more than 1700 users of 18 urban parks and 18 brownfields in Leipzig, Germany. Benefitsrelated to natural elements and landscape aesthetics were most important especially for older age groups. Younger people placed moreimportance on size, availability, and location as well as sports facilities. The most frequently mentioned disturbance/disservice in urbanparks was litter followed by the undesirable activities of other users. Tree cover, sports facilities, seating possibilities, and inhabitantdensity in the neighborhood influenced the perception of parks providing regulating services (noise mediation and shade provision)and social and cultural interactions. Brownfields were often appreciated as additional UGS close to people’s homes and for theirwilderness aspects. Implementing specific facilities and varying tree cover can influence perceived benefits from UGS. Adaptedmanagement measures can therefore increase multiple benefits and minimize trade-offs between UGS users and uses, for example, theintegration of wild areas into UGS including low or near-natural management areas.Key Words: brownfields; ecosystem services; trade-offs; urban parksINTRODUCTIONInternational, national, and local policy guidelines call for thedevelopment of sustainable cities because the majority of theworld’s population is and will be increasingly living in urban areas(Bundesregierung 2016, Stadt Leipzig 2017a, United Nations2017). Urban green spaces (UGS) such as urban parks and forestsas well as unmaintained, informal sites like brownfields andvacant lots are considered fundamental points on the road tourban sustainability because they provide essential ecosystemservices (Bolund and Hunhammer 1999, Elmqvist et al. 2015)promoting human health and well-being (de Vries et al. 2003,Tzoulas et al. 2007).Ecosystem services provided by UGS range from habitat supplyto provisioning and regulating services to cultural services (MEA2005, Gómez-Baggethun and Barton 2013). Although urban foodsupply as a provisioning service plays a minor role in cities, studiesdo underline its potential for global food security as in Eigenbrodand Gruda (2015), Russo et al. (2017). Important regulatingservices in cities are, for example, the regulation of urbantemperature or noise reduction by vegetation (Bolund andHunhammer 1999, Gómez-Baggethun and Barton 2013).Furthermore, UGS in the form of urban parks provide space forrecreation, physical exercise, and social interactions for cityresidents (Peters et al. 2010, Gómez-Baggethun and Barton 2013,Krellenberg et al. 2014). They offer opportunities to experienceand interact with nature (Gobster and Westphal 2004, Palliwodaet al. 2017) and provide aesthetical as well as educational values(Bertram and Rehdanz 2015). These cultural services are highlyrelevant in UGS because they directly contribute to the physicaland psychological well-being of people (Tzoulas et al. 2007,Kessel et al. 2009, Lee and Maheswaran 2011). The actual flow1or use of these ecosystem services and benefits that are(potentially) provided by UGS is determined by their accessibilityand UGS characteristics as well as by preferences and socialdemographic characteristics of users, i.e. urban residents(Hegetschweiler et al. 2017). Urban green spaces should thereforeinclude appropriate features and facilities and should beaccessible for users to facilitate their benefits.Urban parks represent perfect examples of highly managed andwell-maintained urban ecosystems and thus a typical type ofUGS. Physical activities and the flow of benefits and ecosystemservices increase with safe and well-kept parks within closedistance from people’s home (Bird 2004, Toftager et al. 2011,Schipperijn et al. 2013, Langemeyer and Connolly 2020). Severalguidelines and thresholds have been provided by researchers andcity planners suggesting UGS within 250-300 m from people’splace of living (Barbosa et al. 2007, Toftager et al. 2011, StadtLeipzig 2017b). Plenty of studies underline a minimum size of(the nearest) UGS as an important use-determining factorrevealing that large UGS are used more frequently (Giles-Cortiet al. 2005, Schipperijn et al. 2013, Hegetschweiler et al. 2017).Still, small parks in dense neighborhoods can be especiallyimportant for social interactions (Peschardt and Stigsdotter 2013)and may be used for other cultural ecosystem services than largeurban parks (Van Herzele and Wiedemann 2003, Nordh et al.2011, Wright Wendel et al. 2012). As a counterpart to wellmaintained urban parks, green brownfields characterized byecological succession can provide additional space not only forrecreational activities such as meeting people and dog walking(Rall and Haase 2011, Pueffel et al. 2018) but also for natureexperiences and “urban wilderness” (Kowarik 2005). Hence,urban brownfields should be considered as important elementsHelmholtz Centre for Environmental Research, UFZ, Department Computational Landscape Ecology
Ecology and Society 26(1): 28/of green space in cities and their benefits to people need to beidentified (Mathey et al. 2015, Banzhaf et al. 2018).Distance and size (which we refer to as “spatial characteristics”in this study) are not the only factors influencing UGS use (VanHerzele and Wiedemann 2003). Several studies analyzed theimportance of facilities available for physical activities in UGSand found, for example, positive influences of trails, lighting,sports infrastructure, and benches (Kaczynski and Henderson2008, Kaczynski et al. 2008, Schipperijn et al. 2013, Voigt et al.2014, Schetke et al. 2016). In addition to these “graycharacteristics,” biotic features like biological diversity or trees,which we refer to here as “green characteristics,” are affectingUGS use and activities (Voigt et al. 2014, Palliwoda et al. 2020).Urban green space visitors place importance on the presence oflarge trees, wooded areas, and general greenness and naturalness(Giles-Corti et al. 2005, Kaczynski et al. 2008, Bijker and Sijtsma2017). Studies furthermore found positive relationships betweenactual or perceived plant species richness of UGS and thepsychological well-being of their users (Fuller et al. 2007,Dallimer et al. 2012).Besides characteristics of the UGS itself, there are differences inpreferences, use frequencies, and motives across differentdemographic groups. For instance, older people prefer less densevegetation structures in urban parks (Bjerke et al. 2006) andperceive urban brownfields with spontaneous vegetation inLeipzig and Dresden (Germany) more positively than youngerpeople (Mathey et al. 2016). Older age groups more often preferparks for nature-related activities and place more importance onaesthetical values and landscape characteristics than youngerpeople (Chiesura 2004, Kienast et al. 2012, Shan 2014, Ode Sanget al. 2016).These findings from the literature underline the heterogeneousframework of factors influencing ecosystem service and benefitprovision on the one hand and the actual use of them by urbanresidents on the other hand, which is influenced by their individualpreferences. Knowledge about which characteristics of UGSaffect the benefits to individuals with different demographicbackgrounds is therefore urgently needed to improve UGS design(Kremer et al. 2016, Hegetschweiler et al. 2017).In addition to benefits, UGS can include aspects that can beperceived negatively ranging from man-made (waste, vandalism)to (partly) natural (allergenic plants, mosquitos, or intrudinganimals), which we refer to here as “disturbances/disservices”(Lyytimäki et al. 2008, Plieninger et al. 2013). In existing studies,disturbances of UGS are often limited to the analysis of healthrelated ecosystem disservices like allergenic potential (D’Amato2000, Ćwik et al. 2018, Battisti et al. 2019) and air quality issues(Gómez-Baggethun and Barton 2013), or safety issues caused bydense vegetation structures and poor lighting in UGS (Koskelaand Pain 2000, Hami and Emami 2015). In addition to healthrelated and safety issues, some activities in UGS can be disturbingfor other users and the creation and management of UGSproviding multiple ES can thus be very challenging for planners(Tzoulas and James 2010, Liu et al. 2018). Some benefits cancoexist and create synergistic ecosystem service provision,meaning that two or more ecosystem services support each otheror even increase simultaneously. On the other hand, others maycreate trade-offs (two benefits impair each other: one decreaseswhile the other increases) or are perceived as disturbing bydifferent social-demographic and cultural groups (Haase et al.2012, Gómez-Baggethun and Barton 2013, Kremer et al. 2016).A study in Finland, for instance, showed that older persons feltmore disturbed by public nuisance and littering of a seashore inHelsinki than younger people (Lodenius 2004). Another examplefrom Sheffield, UK revealed older age groups feeling moreconcerned about their reduced mobility causing security risks andplacing more importance on easily accessible UGS than youngerpersons (Jorgensen and Anthopoulou 2007).The main aim of this research is to understand perceived benefitsand disturbances/disservices that people of different age groupsdiscern on two types of UGS: urban parks and brownfields.Additionally, we tested the influence of selected UGScharacteristics on the most frequently mentioned nature benefits.Given the findings from other studies mentioned above, wehypothesized that nature benefits, which urban inhabitants derivefrom urban parks, are influenced by various factors referring tothe park’s green, gray, and spatial components. We furthermoreassumed that perception is related to people’s age and thus maychange during the lifetime of UGS users. Knowing whichcomponents of UGS contribute to which benefits can improvethe development and management of UGS, better meeting themultiple demands of their users.This paper addresses the following research questions:1. Which benefits as well as disturbances and disservices areperceived by park and brownfield users across different agegroups?2. Which green, spatial, and gray UGS characteristics mayinfluence perceptions?METHODS AND MATERIALStudy area and study site selectionThe study area was located in the city of Leipzig, one of the fastestgrowing cities in Germany with an area of about 30,000 ha. Thecity has experienced a shrinkage process and is now facing growinginhabitant numbers, which makes it an interesting case studybecause of the transition of contrasting land-use pressures. Afterthe German reunification in 1990, Leipzig was affected by massiveeconomic and population declines, which led to thousands ofabandoned plots (brownfields) all over the city (Haase 2008).Residential and industrial buildings were demolished, and the cityapplied various development strategies such as the developmentof nature protection sites, new green spaces, and interim-usestrategies to account for the large number of vacant sites (Ralland Haase 2011, Mathey and Rink 2020). Contrastingly, sincethe year 2012, the population has been continuously increasingby approximately 10,000 people per year, reaching more than600,000 inhabitants in 2020 (Stadt Leipzig 2020). Populationgrowth is driven mainly by young people under the age of 30, whoprefer to move to districts close to the city center, which are oftencharacterized by low availability of green areas (Stadt Leipzig2019). Remaining vacant sites and brownfields are now hotspotsfor urban development projects, including the development ofnew UGS that support climate change adaption and recreationbut also provide areas for facilitating housing, education, andtransport (Stadt Leipzig 2017b). Most of the city’s brownfields
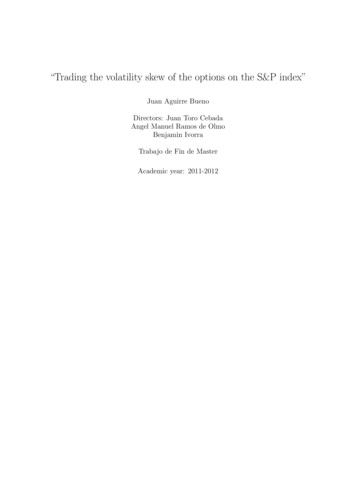
Ecology and Society 26(1): 28/are covered by vegetation and undergo natural ecologicalsuccession. Some of them are grassy areas managed by residentsor private owners (Fig. 1). All unused spaces regardless of theirownership or former use in Leipzig are registered by the city anddefined as brownfields (Stadt Leipzig 2017c). Brownfields canprovide space for recreational activities (Pueffel et al. 2018,Palliwoda et al. 2020) and offer, due to their undisturbeddevelopment, valuable habitats for several plant and animalspecies, including red-listed (endangered) species (Muratet et al.2007, Kowarik 2013, Mathey et al. 2015) and thus complementthe city’s more formal and maintained types of UGS.Furthermore, Leipzig provides plenty of public green recreationalareas (about 11% of the total city area), water structures (4%),and forest areas (about 7%), the latter mainly consisting ofriparian forests running from the north-west to the south-west ofthe city.Fig. 1. Study sites in the city of Leipzig. We selected 18 urbanparks (green) and 18 brownfields (blue) in a 5 km radius fromthe city center. Photos on the right show examples of greenbrownfields in Leipzig with varying tree cover. More photos ofbrownfields and urban parks can be found in Appendix 1(Figures A1.1-A1.6). Map source: OpenStreetMap andcontributors; Photos: J. Palliwoda.For this study, we chose two different but typical types of UGSto reflect their variety and to consider the range of benefits theyprovide. We selected urban parks and green brownfields (i.e.,brownfields with vegetation) within 5 km from the city center.Tree cover (trees 5 m in height) of every park and brownfieldwas determined on the basis of analyzed digital orthophotos fromJune 2012 and a digital surface model from 2010. Data of treecover were kindly provided by E. Banzhaf (Banzhaf et al. 2020).Tree cover was divided into three classes: low (0-33% of the areais covered by trees), medium ( 33-67%), and high ( 67-100%).This data enabled a stratified random sampling of study sites(UGS type: park or green brownfield; tree cover: low, medium,high). The random selection of six replicates of each groupresulted in 18 parks and 18 green brownfields of 3 tree coverclasses to ensure an even tree cover distribution (see Appendix 1,Table A1.1). The sole precondition for green brownfields was thatthey were accessible, i.e., not completely surrounded by walls orfences nor completely overgrown by shrubs, which was preverifiedduring field visits before final study site selection. Due to naturalecological succession and tree growth, most brownfields andurban parks in Leipzig fall within the medium and high tree coverclasses. Figure 1 shows all final study sites and photos of somebrownfields with different tree cover in Leipzig.Survey about ecosystem service use and perceived benefits anddisturbances/disservicesOur approach combined a structured observation to count userdensity and a survey with randomly selected respondents aboutecosystem service use and perceived benefits and disturbances/disservices of study sites. Observation and surveys with randomlyselected visitors were conducted on all 36 study sites. Results fromthe observations are not analyzed in this study (see Palliwoda etal. 2020 for analysis of observed use density). Every site wasvisited eight times covering each of the four time slots twice:morning (8-11), noon (11-14), afternoon (14-17), and evening(17-20). For the survey, visitors entering the observation unit werechosen randomly during observations (asking adult persons everyfifth minute). Observation units were delineated by visual or otherbarriers like paths, shrubs, or walls. Visitors that appearedyounger than 14 years were only interviewed when in companyof adults (ADM 2021). From the 18 observed brownfields, only14 were visited by people. Three brownfields that were not usedat all were sites with high tree cover and one with medium treecover. On one further brownfield with high tree cover, we observeddrug use and dealing, and as such, no interviews were conductedthere. Hence, our survey results for brownfields represent mainlysites with medium and low tree cover (ntotal 13). Surveys andobservations were pretested on one brownfield and one park inApril 2018 and then conducted between mid-April and September2018 by the first author supported by a well-trained scientificassistant (MSc). Data were collected on weekdays and weekendsand only during fair weather conditions.Our written questionnaire was based on the smartphoneapplication MapNat (MapNat is available at Google and Appleplaystores and has been refined during this study, funded by theUrbanGaia project; Project number 01LC1616A) and set up inGerman (translated survey in Appendix 1). Respondents mainlypreferred oral questions read to them by the interviewer. Thesurvey included 24 selectable ecosystem services potentiallyrelevant for UGS use. Respondents were asked to choose oneecosystem service that they were using at that time, followed byadditional questions about use frequency, importance, andmotivation (see Palliwoda et al. 2020 for detailed analysis ofecosystem service use and motivation). The question aboutpositive and negative aspects (benefits and disturbances/disservices, respectively) was an open-ended question with thefollowing two subquestions: “What do you like about this site?What do you dislike or feel disturbed by?” Finally, we askedrespondents about age and gender and their place of residenceor, if people were taking (lunch) breaks, their work place (streetand postcode).For the analysis, we assigned answers of the open-ended questionsto keywords or key parameters, which were then aggregated intocategories (Table 1). We differentiated all generated positivecategories into two benefit types: gray benefits (spatial orinfrastructure-related park features, comments regardingmaintenance, or use regulations) and nature benefits (categoriesthat refer to contributions of nature to people in terms of
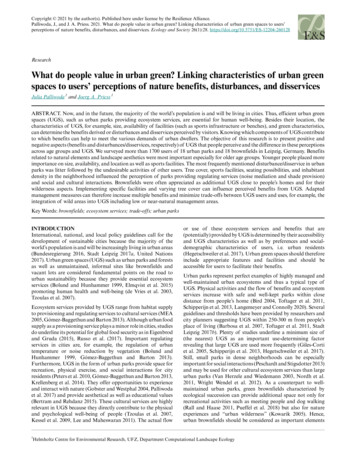
Ecology and Society 26(1): 28/Table 1. Categories of benefits and their (partly) contradicting disturbances perceived by respondents in urban parks and brownfields.Several answers were possible. Answers by respondents mentioning several keywords within one category (e.g., flowering aspects andtrees) were counted as one.Benefit categoriesKeywords/key parametersNature Environmental education Environmental education, identificationbenefits and gardeningtags on plants, urban gardening activitiesGreen landscape/aesthetics Beautiful landscape, green landscape,green or nature as a whole, experiencenatureNatural elementsReference to elements of nature: trees,flowering aspects, animals, water/pond,meadowRegulating ecosystemShade, quiet/noise reductionservicesSense of placeSense of place, history of park, culturalheritageSocial and culturalMeeting point, other people, initiatives,interactionschildren/family, intercultural exchange,neighborhood initiatives, events,possibilities to barbequeUrban wildernessGraybenefits Art and buildingsDog friendlyFreedom/no s/key parametersLittle/no natureNo, not enough trees/flowering aspects orvegetation/green, dry/yellow vegetationNoise/little shadeNo/not enough shade, hearing noise fromsurrounding streetsOther users/behavior/bicyclesFeeling disturbed by (groups of) otherpersons (e.g., teenagers, people from othercultures) or events, fast bicycles, otherpeople barbecuing and causing smoke orleaving trash, too many peopleDogsFeeling disturbed or scared by dogs, doglitterSafety/crimeAlcohol abuse/people drinking alcohol,drug dealing, lack of/poor lighting, feelingunsafeGraffiti, broken/tagged benchesNot enough/missing infrastructure orservices (e.g., benches, toilets, kiosk)Not enough meadow, unsightly design, siteis too small, not enough space, lacking orpoor maintenance of vegetation or waterbodiesToo much litter/waste, missing waste binsNature-like, near-natural conditions, no/low maintenance, wilderness aspects,discoverGraffiti, statues, buildings, monuments(for brownfields: available infrastructure)Suitable site for dogs: fenced, possibilityto let dogs off the leash, designated dogareas, other dog infrastructureNo regulatory agency, no regulations,freedom, move freelyInfrastructureBenches, paths, playgroundsVandalismMissing/bad infrastructurePark design andmaintenance(Architectural) design of the site, safety,cleanliness, maintenance, open viewUnsuitable design andmaintenanceSeclusionNo other people/not so crowded,tranquility, escapeTable tennis, fitness, running tracks,beach volleyball, basketball, footballSize, proximity, central location,accessibility, “good to have it there”Litter/wasteSports facilitiesSize/availability andlocationaesthetical, spiritual, recreational, and intellectual values, thephysical dimension of nature/nature itself as well as regulatingecosystem services such as microclimate regulation (MEA 2005,Haines-Young and Potschin 2013, Díaz et al. 2015)).Disturbances/disservices, which contradicted a benefit category,were grouped with that category illustrating individual and partlyopposite perceptions of similar aspects among respondents (Table1). We then counted the number of responses per category in eachof the 18 parks and the 13 brownfields where people wereinterviewed.Urban green space (UGS) characteristicsTo identify UGS characteristics that might influence perceivedbenefits, we selected characteristics that represent three keystructural dimensions of UGS: green, spatial, and grayPotential lossRemoval/future building development ofsitecharacteristics (Voigt et al. 2014, Hegetschweiler et al. 2017). Inaddition to the three green characteristics, tree cover (Kaczynskiet al. 2008, Timperio et al. 2008, Hofmann et al. 2012), richnessof tree species, and richness of flowering species (Fuller et al.2007, Dallimer et al. 2012), size, and inhabitant density within300 m (Van Herzele and Wiedemann 2003, Wright Wendel et al.2012) were selected as spatial characteristics. For graycharacteristics of UGS, we selected seating possibilities asimportant park amenities supporting passive or resting relaxation(McCormack et al. 2010, Voigt et al. 2014), the presence oflighting contributing to safety (Giles-Corti et al. 2005), and thepresence of sports facilities for active physical interactions(Gearin and Kahle 2006, Ries et al. 2008, McCormack et al. 2010).Figure 2 visualizes UGS characteristics of each structuraldimension that were assessed in each of the 36 study sites.
Ecology and Society 26(1): 28/Fig. 2. Measured urban green space (UGS) characteristics ofthree structural dimensions (green, spatial, and gray) in 18urban parks and 18 green brownfields.Tree cover is defined as the proportion of the study site that iscovered by trees 5 m in height. For assessing species richness,we used ArcGIS (version 10.6) to generate randomly distributedpoints representing the center of 15 x 15 m sample plots on allstudy sites and covering at least 1% of the total area of each studysite (Hermy and Cornelis 2000). Within these plots, we identifiedall woody species at or above 5 meters in height for tree richnessas well as all herbaceous species that were flowering at the timeof mapping (August-September 2017). The authors are aware thatspecies assessments may not cover the whole range of speciesrichness on study sites. To avoid underrepresentation of species,especially in small parks and brownfields, we set up a minimumof two sample plots and furthermore mapped all present treespecies on brownfields that were smaller than the smallest park( 0.65 ha). Species richness was then scaled to species per 100m².Spatial characteristics comprised the density of the humanpopulation within 300 m of the edge of each study site as well asthe size of the sites. We calculated the number of inhabitants ina 300 m Euclidian distance surrounding each UGS site based ona dataset provided by the city of Leipzig (Stadt Leipzig 2018).The distance of 300 m, representing a walking time of 5 minutes,is frequently used to analyze access to UGS (Barbosa et al. 2007,Toftager et al. 2011).Infrastructural features and facilities were defined as graycharacteristics. At each site, we counted all available permanentseating possibilities (benches, attached chairs, etc.), lights andsports facilities (table tennis, basketball or soccer field, runningtracks, etc.). Gray characteristics were counted in summer 2017and seating possibilities and lights were scaled to units per hectare.All green, spatial, and gray characteristics of each study site canbe found in Appendix 1, Table A1.1.Data analysisData were processed in R version 3.6.1, MAXQDA version 12.1.3,and ArcGIS version 10.6. Survey data were translated intoEnglish language, statistical analysis was carried out with the“stats” package (R Core Team 2020), and data visualization withthe “ggplot2” package (Wickham 2016).Demographic characteristics of respondentsRespondents were grouped into the following age groups: childrenand teenagers ( 18 y), young adults (18-30 y), adults (31-64 y),and older persons (65 y; Jim and Chen 2006). The analysis ofperceived benefits and disturbances excluded children andteenagers, because for children we recorded the same aspects theirparent or guardian mentioned. We then counted the frequency ofeach perceived benefit and disturbance/disservice across agegroups. To determine significant differences of frequencies inperceived benefits and disturbances/disservices between agegroups in urban parks, we applied the chi-square test ofindependence. Sample sizes for older persons were too low onbrownfields and thus age differences are not statistically testedfor this UGS type. We located the home or work place address ofrespondents with the geo-referencing tool in ArcGIS (averagedfrom street and postcode). To calculate the distance betweenaddresses and UGS sites, we used the Network Analyst tool ofArcGIS, calculating the shortest route from the estimated placeof living or work to the nearest point of the circumference ornearest entrance of the site.Interaction of benefits and influence of park characteristicsTo analyze spatial correlations between pairs of all benefits(nature and gray benefits) on each study site, the weightedSpearman’s rank correlation test was applied separating urbanparks from brownfields (weight number of surveys on eachstudy site). For this analysis, we calculated the frequency ofanswers for each benefit for each urban park and brownfield andapplied the correlation test for these frequencies. To confirmrobustness of correlation coefficients, bootstrapping with 1000resamples of study sites was applied to calculate upper and lowerquartiles (0.95 and 0.05; Appendix 1, Tables A1.4, A1.5). Positivevalues of correlations coefficients imply that two benefits arepositively influencing each other (synergies), negative valuesimply trade-offs.To statistically test the influence of UGS characteristics on theproportion of selected nature benefits, we used generalized linearmodels (GLMs; quasibinomial family for overdispersed data withlogit link to meet normality of error distributions). The analysiswas only applied for urban parks because green brownfieldsusually do not contain many gray facilities and sample sizes weretoo low (n 13) for this type of test. Only the four most frequentlymentioned nature benefits were tested (green landscape/aesthetics, natural elements, regulating ecosystem services, andsocial and cultural interactions) because other nature benefitssuch as urban wilderness or sense of place were mentioned in onlya few urban parks and sample sizes were too small. Responsevariables were the proportions of selected nature benefit in allmentioned benefits, respectively, and GLMs were run separatingUGS structural dimensions (green, spatial, and graycharacteristics). The green model included tree cover, tree andflowering richness as explaining variables. Inhabitant densitywithin 300 m and size of the site was tested in the spatial model,and number of seating possibilities per hectare, number of lightsper hectare, as well as the sum of available sports facilities weretested in the gray model. Because of different measurement unitsof explaining variables, we calculated standardized coefficientswith the “reghelper” package (Hughes 2020). The best model wasthen selected with the Bayesian Information Criterion (BIC)accounting for small sample sizes (n 18) preferring the leastcomplex model with “BMA” package (Raftery et al. 2020).RESULTSDemographic characteristics of respondentsWe interviewed 1624 park visitors and 255 brownfield users. Weexcluded
International, national, and local policy guidelines call for the development of sustainable cities because the majority of the world's population is and will be increasingly living in urban areas (Bundesregierung 2016, Stadt Leipzig 2017a, United Nations 2017). Urban green spaces (UGS) such as urban parks and forests