Transcription
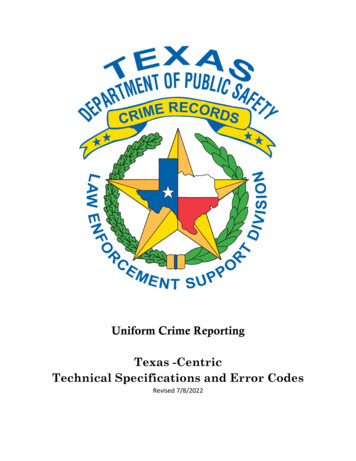
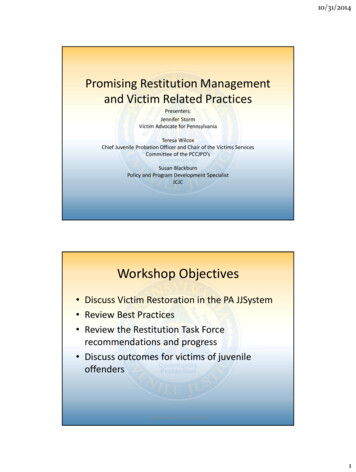
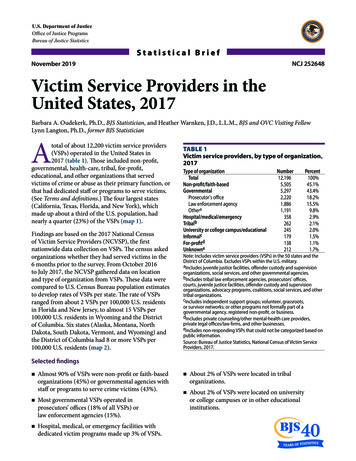
U.S. Department of JusticeOffice of Justice ProgramsBureau of Justice StatisticsStatistical BriefNCJ 252648November 2019Victim Service Providers in theUnited States, 2017Barbara A. Oudekerk, Ph.D., BJS Statistician, and Heather Warnken, J.D., L.L.M., BJS and OVC Visiting FellowLynn Langton, Ph.D., former BJS StatisticianAtotal of about 12,200 victim service providers(VSPs) operated in the United States in2017 (table 1). Tose included non-proft,governmental, health-care, tribal, for-proft,educational, and other organizations that servedvictims of crime or abuse as their primary function, orthat had dedicated staf or programs to serve victims.(See Terms and defnitions.) Te four largest states(California, Texas, Florida, and New York), whichmade up about a third of the U.S. population, hadnearly a quarter (23%) of the VSPs (map 1).Findings are based on the 2017 National Censusof Victim Service Providers (NCVSP), the frstnationwide data collection on VSPs. Te census askedorganizations whether they had served victims in the6 months prior to the survey. From October 2016to July 2017, the NCVSP gathered data on locationand type of organization from VSPs. Tese data werecompared to U.S. Census Bureau population estimatesto develop rates of VSPs per state. Te rate of VSPsranged from about 2 VSPs per 100,000 U.S. residentsin Florida and New Jersey, to almost 15 VSPs per100,000 U.S. residents in Wyoming and the Districtof Columbia. Six states (Alaska, Montana, NorthDakota, South Dakota, Vermont, and Wyoming) andthe District of Columbia had 8 or more VSPs per100,000 U.S. residents (map 2).TABLE 1Victim service providers, by type of organization,2017Type of Prosecutor’s ofceLaw enforcement rsity or college Note: Includes victim service providers (VSPs) in the 50 states and theDistrict of Columbia. Excludes VSPs within the U.S. military.aIncludes juvenile justice facilities, ofender custody and supervisionorganizations, social services, and other governmental agencies.bIncludes tribal law enforcement agencies, prosecutors’ ofces,courts, juvenile justice facilities, ofender custody and supervisionorganizations, advocacy programs, coalitions, social services, and othertribal organizations.cIncludes independent support groups; volunteer, grassroots,or survivor networks; or other programs not formally part of agovernmental agency, registered non-proft, or business.dIncludes private counseling/other mental-health care providers,private legal ofces/law frms, and other businesses.eIncludes non-responding VSPs that could not be categorized based onpublic information.Source: Bureau of Justice Statistics, National Census of Victim ServiceProviders, 2017.Selected fndings Almost 90% of VSPs were non-proft or faith-basedorganizations (45%) or governmental agencies withstaf or programs to serve crime victims (43%). Most governmental VSPs operated inprosecutors’ ofces (18% of all VSPs) orlaw enforcement agencies (15%). Hospital, medical, or emergency facilities withdedicated victim programs made up 3% of 0%1.5%1.1%1.7% About 2% of VSPs were located in tribalorganizations. About 2% of VSPs were located on universityor college campuses or in other educationalinstitutions.
MAP 1Victim service providers, by location, 2017Note: Includes victim service providers (VSPs) in the 50 states and the District of Columbia. Excludes VSPs within the U.S. military. See appendix table 1for estimates.Source: Bureau of Justice Statistics, National Census of Victim Service Providers, 2017.MAP 2Rates of victim service providers per 100,000 residents, by location, 20172 to less than 44 to less than 66 to less than 88 or moreNote: Includes victim service providers (VSPs) in the 50 states and the District of Columbia. Excludes VSPs within the U.S. military. The rate per100,000 residents is calculated as the number of VSPs divided by the state population and multiplied by 100,000. There were 8 or more VSPs per100,000 residents in the District of Columbia. See appendix table 1 for estimates.Source: Bureau of Justice Statistics, National Census of Victim Service Providers; and U.S. Census Bureau, Population Division, 2017.Vic tim S er vice Providers in the United States , 2017 Novemb er 20192
MethodologyTe 2017 National Census of Victim ServiceProviders (NCVSP) is the frst data collection onall types of victim service providers (VSPs) in theUnited States. Te Bureau of Justice Statistics (BJS),with support from the Ofce for Victims of Crime(OVC), conducted the NCVSP through a cooperativeagreement with the RAND Corporation, NORCat the University of Chicago, and the NationalCenter for Victims of Crime (NCVC), under awardnumber 2012-VF-GX-K025. RAND providedsurvey development and analytical expertise, NORCadministered the NCVSP, and NCVC and OVCprovided content expertise and led outreach activities.Roster developmentPrior to conducting the NCVSP, there was no rosterof all VSPs across the nation. Roster development wasconducted from 2013 to 2016 and involved compilinga list of all publicly available VSPs, canvassing for VSPlists across all states and the District of Columbia,and running an awareness campaign to encourageparticipation in the NCVSP. Military VSPs wereexcluded from the roster because they are typicallyinaccessible to the general public.National-level organizations provided VSP lists, such asthe OVC’s Online Directory of Crime Victim Services,the NCVC’s Connect Directory, and the Ofce onViolence Against Women’s Measuring EfectivenessInitiative. BJS also added questions to its Census ofState and Local Law Enforcement Agencies and itsNational Census of State Court Prosecutors to assesswhether any of the responding organizations qualifedfor the roster because they had dedicated staf orprograms to serve victims.Meanwhile, state-by-state web-canvassing revealedmore than 120 national- or state-level VSP lists,including lists specifc to a victimization type (likedomestic violence or child abuse), a location (like aparticular state), or a program type (like hospital-basedintervention programs or tribal justice programs).Tese VSP lists were identifed by working withprofessionals and organizations that had access to theVSP feld and with state and local ofcials connected toregional VSPs. For the purposes of frame development,VSPs are generally easy to identify because theyneed to be publicly accessible or known to crimevictims in their community to fulfll their mission ofserving victims.Development of this initial roster produced a list of29,646 organizations that were likely providing victimservices. Many organizations were present on multiplelists or even duplicated on a single list. Duplicateswere removed while erring on the side of inclusion,to maximize the chance of reaching all eligible VSPs.For example, two organizations with the same addressbut diferent names remained on the roster becausethey could have been separate organizations located inthe same building. Lack of current, complete contactinformation also presented challenges in eliminatingduplication during this stage. For example, VSPs mighthave had similar names, but if one was missing anaddress, it was unclear if they were duplicates.From August 2015 to January 2016, a pilot test wasconducted with 725 organizations to determinethe quality of the roster and to test the proceduresfor surveying the VSP organizations.1 Te pilottest revealed that 35% of organizations in the pilotstudy were not VSPs. (See Terms and defnitions.) Inaddition, 17% of organizations reported a problemwith how the roster listed their organization’s name,and 20% reported a problem with their mailingaddress. Tese fndings, combined with the lack ofdescriptive information about VSPs on the roster,indicated that the roster was not complete or accurateenough to use as a VSP sampling frame. It wasimportant to contact all organizations on the initialroster to remove those that were not actively servingvictims, to remove duplicates, and to collect descriptiveinformation on the universe of active VSPs nationwide.Census administration and roster cleaningFrom October 2016 to July 2017, NORC administeredthe NCVSP to the 29,646 organizations on the roster.Te NCVSP was administered primarily online (86%)or by telephone (14%). Eleven VSPs completed a papercopy of the census.1B. Oudekerk, L. Langton, H. Warnken, S. Greathouse, N. Lim,B. Taylor, V. Welch, and S. Howley, Building a National DataCollection on Victim Service Providers: A Pilot Test (NCJ 251524),research funded by the Bureau of Justice Statistics, U.S. Departmentof Justice, Washington, D.C. (February 2018).Vic tim S er vice Providers in the United States, 2017 Novemb er 20193
During the process of collecting up-to-date contactinformation and analyzing census data, 10,867duplicate organizations were removed from the roster(table 2). Te majority of duplicate organizations wereidentifed during data collection (87%; not shownin tables). A few months into data collection, aferupdating contact information for most VSPs, statisticalfuzzy matching was conducted to determine the levelof agreement between phone numbers, organizationnames, postal addresses, email addresses, and contactnames for each pair of duplicate organizations.2 Eachlikely pair of duplicates was reviewed and, whenpossible, telephone interviews were conducted toconfrm the duplication.Te other 13% of duplicates were identifed afer datacollection ended (not shown in tables). Another efortto eliminate duplications was conducted based on themost up-to-date contact information (organizationname and address information) and manually reviewedsurvey data for matching VSPs. When VSPs withmatching contact information and survey data wereidentifed, one VSP was removed if it reported— no dedicated staf or programs no directly served victims and no hotline callsduring the past year (the survey’s reference period) more missing data on organization type, crime typesserved, and number of staf and victims than theother VSP did more missing data on the frst half of the survey thanthe other VSP did more missing data on the second half of the surveythan the other VSP did.For the remaining duplicates, one VSP was selected atrandom to remove from the frame.Another 4,598 VSPs were ineligible for the NCVSPbecause they had closed down, merged with otherorganizations, or not served victims of crime orabuse during the past 6 months. If outreach efortsor web searches did not provide conclusive evidencethat an organization was ineligible for the NCVSP,the organization remained on the roster. At theconclusion of the NCVSP, the census included2Fellegi, I. P., & Sunter, A. B. (1969). A theory for record linkage.Journal of the American Statistical Association, 64(328), 501049TABLE 2Number and percent of organizations on theNational Census of Victim Service Providersroster, by fnal status, 2017Final statusTotal organizations on original rosterVictim service providers on fnal rosteraOrganizations removed from rosterDuplicate organizationsOrganizations not serving 100%47.8%52.2%36.715.5Note: Organizations include victim service providers (VSPs) and otheragencies not serving victims.aIncludes VSPs in the 50 states and the District of Columbia. ExcludesVSPs within the U.S. military.bIncludes organizations that did not serve victims of crime or abuseduring the past 6 months.Source: Bureau of Justice Statistics, National Census of Victim ServiceProviders, 2017.TABLE 3Number and percent of victim service providers,by response and eligibility status, 2017Response and eligibility statusTotal VSPs on fnal rosterResponding VSPsIncluded in analysisExcluded from analysisaNon-responding VSPsbIncluded in analysisExcluded from ercent100%81.6%68.013.618.4%18.00.4Note: Includes victim service providers (VSPs) in the 50 states andthe District of Columbia. Excludes VSPs within the U.S. military.aIncludes organizations that served victims but had no dedicatedstaf or programs to serve victims or were located outside the U.S. Theseorganizations are excluded from table 1, fgures 1 and 2, and appendixtable 1.bVSPs that did not complete all key items on the survey instrumentwere considered non-respondents.Source: Bureau of Justice Statistics, National Census of Victim ServiceProviders, 2017.14,181 organizations (table 3). Te NCVSP yielded acomprehensive, up-to-date, and descriptive roster ofVSPs that could serve as a sampling frame for futureVSP surveys.Response rate and inclusion criteriaOf the 14,181 organizations on the fnal roster,11,567 confrmed their status as a VSP and participatedin the census (82%). Confrmed VSPs were included ifthey completed at least up to section H of the NCVSPinstrument, which included all of the key items. Forthe 2,614 non-respondents, online searches wereconducted to identify a few characteristics aboutVic tim S er vice Providers in the United States , 2017 Novemb er 20194
them, including their location and organizationaltype. All organizations had an address from theoriginal roster or online searches, which enablednon-responding organizations in state counts to beincluded. Organizational type was identifed for 92% ofnon-respondents (not shown in tables).Of the 14,181 organizations on the fnal roster,1,985 were excluded from table 1, fgures 1 and 2,and appendix table 1 (14%; 1,927 responding and58 non-responding VSPs), leaving a total of 12,196eligible organizations. Organizations that wereexcluded typically provided some resources to victimsof crime or abuse but either did not have dedicatedstaf or programs to serve victims (1,978 organizations)or else were located outside the U.S. (7 organizations;not shown in tables).Of the 12,196 eligible organizations, 9,640 completedthe NCVSP (79%; not shown in tables). Teseorganizations confrmed their status as a VSP andprovided up-to-date geographical data.Eligibility for many of the 2,614 non-respondingorganizations could not be confrmed, but theseorganizations were kept on the VSP frame. Of these2,614 organizations, 58 were found to be ineligible forthis report based on public evidence. Te remaining2,556 were considered to be eligible for this report,because public evidence of ineligibility could notbe found.Terms and defnitionsThe survey instrument used in the National Censusof Victim Service Providers (NCVSP) identifedorganizations providing services to victims of crimeor abuse and fltered out inactive agencies. Theinstrument provided defnitions for victims andservices: A victim was a person who received assistancefrom a victim service provider (VSP) due toconcerns about past, ongoing, or potential crimesor abuse. Victims included persons directly harmedor threatened by crimes or abuse and family orhousehold members of the harmed or threatenedpersons. Services included any eforts to assist victims; topromote their safety, security, or recovery; to helpthem participate in the criminal justice system; orto meet other victim needs.Any organization that had provided services tovictims of crime or abuse within the past 6 monthswas screened into the NCVSP. The NCVSP instrumentthen categorized VSPs into three groups oforganizations:1. those that primarily provided victim services2. those that served victims and non-victims but haddedicated programs or staf for victim services3. those that served victims and non-victims but didnot have dedicated programs or staf for victimservices.This report excludes organizations without dedicatedstaf or programs to serve victims. (See Response rateand inclusion criteria.)Vic tim S er vice Providers in the United States, 2017 Novemb er 20195
APPENDIX TABLE 1Number, percent, and rate of victim service providers, by state population, 2017StateU.S. totalCaliforniaTexasFloridaNew YorkPennsylvaniaIllinoisOhioGeorgiaNorth CarolinaMichiganNew taSouth ecticutIowaUtahArkansasNevadaMississippiKansasNew MexicoNebraskaWest VirginiaIdahoHawaiiNew HampshireMaineRhode IslandMontanaDelawareSouth DakotaNorth DakotaAlaskaDistrict of cent of 0.30.20.20.20.20.2Number of 086Percent of .80.80.50.7Rate of VSPs per100,000 U.S. 0.713.012.414.79.614.8Note: Excludes victim service providers (VSPs) within the U.S. military.*The rate per 100,000 residents is calculated as the number of VSPs divided by the state or national population and multiplied by 100,000.Source: Bureau of Justice Statistics, National Census of Victim Service Providers; and U.S. Census Bureau, Population Division, 2017.
Te Bureau of Justice Statistics of the U.S. Department of Justice is theprincipal federal agency responsible for measuring crime, criminalvictimization, criminal ofenders, victims of crime, correlates of crime,and the operation of criminal and civil justice systems at the federal, state,tribal, and local levels. BJS collects, analyzes, and disseminates reliablestatistics on crime and justice systems in the United States, supportsimprovements to state and local criminal justice information systems, andparticipates with national and international organizations to develop andrecommend national standards for justice statistics. Jefrey H. Anderson isthe director.Tis report was written by Barbara A. Oudekerk, Heather Warnken, andLynn Langton. Rachel Morgan and Connor Brooks verifed the report.Caitlin Scoville and Jill Tomas edited the report. Tina Dorsey andMorgan Young produced the report.November 2019, NCJ 252648Ofce of Justice ProgramsBuilding Solutions Supporting Communities Advancing Justicewww.ojp.gov
Source: Bureau of Justice Statistics, National Census of Victim Service Providers, 2017. MAP 2 . Rates of victim service providers per 100,000 residents, by location, 2017 . 2 to less than 4 4 to less than 6 6 to less than 8 8 or more . Note: Includes victim service providers (VSPs) in the 50 states and the District of Columbia.