Transcription
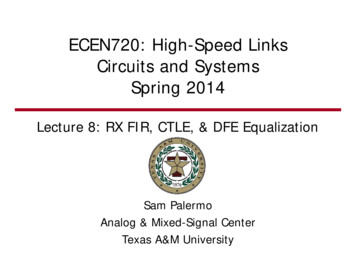
International Journal of Scientific & Engineering Research Volume 3, Issue 8, August-2012ISSN 2229-55181Optimal Transformer Tap Settings and TCSC Size for Transmission Congestion Management through PSO Algorithm in aDeregulated Power MarketR.Ramachandran, M.Arun, S.SakthivelAbstract— Power transmission congestion is a critical challenge in the deregulated energy market. Transmission congestion managementis very much necessary for realising all the desired power transactions and to avoid line outages due to heavy power flow. In this paper, acost free congestion method by reactive power loss/line flow minimization based approach is presented. The real power setting scorrespond to minimum fuel cost and it is not changed only the line flows are adjusted for relieving line over loads. Transformer tap settingsand location and size of two thyristor controlled series capacitor (TCSC) are considered as control variables for congestion relief. Optimalvalues of control parameters are obtained by implementing the simple and easy to realise swarm intelligence of particle swarm optimizationalgorithm (PSO). The proposed work is validated by testing it in the medium sized IEEE 30 bus test system and the results obt ained arereally encouraging.Index Terms— Transformer tap settings, TCSC, FACTS, Reactive power loss, Congestion management, Particle Swarm Optimization,Power flow performance index.—————————— ——————————1 INTRODUCTIONIn deregulated electricity markets, the transmission lines are operatedmuch closer to their thermal limit due to large number of bilateraland/or multilateral transactions. Under such operating conditions,there is a risk of thermal limit violation what is termed as transmission congestion. Congestion can be alleviated by constructing newtransmission lines but it is not straight forward and needs long timefor realisation [1]. Moreover there is lack of coordination betweenGenCos (Generator Companies) and TransCos (Transmission Companies) and it results in relative decline in investment for transmission systems [2].Congestion is defined as capacity violation of generators or transformers or transmission lines. Now a days the word congestion isused mainly to refer to the line flow limit violation. Congestion isposing threats to the security of power systems as it may cause lineoutage and voltage collapse. During congestion, price volatility andmarket imbalance may result and consequently the consumers willsuffer and this will shake the very purpose of supplying power atcompetitive price to the consumers [3]. The other major problemcaused by congestion being it imposes barriers on existence of newcontracts [4]. Hence congestion management is an important issue tobe addressed in restructured ——Assistant Proessor, Dept of Electrical EngineeringAnnamalai University, Chidambaram, TN, IndiaE-mail: ramachandran.auee@gmail.comAssistant Proessor, Dept of Electrical EngineeringAnnamalai University, Chidambaram, TN, IndiaE-mail: arunmano80@gmail.comment, operation of FACTS devices and transformer tap settings [8][9]. Among the above mentioned methods, use of FACTS devicesand control of transformer tap settings are cost free methods sincethey do not involve any marginal cost [10]-[11] except the capitalcost (cost free methods).FACTS devices are long been used for power system control andcongestion management [12]-[13]. Series FACTS devices are relatively better than shunt FACTS devices for power flow control. Useof series FACTS controllers like TCSC will help controlling of power flow for congestion management. Sensitivity based approaches areattempted for optimal location of TCSC for congestion managementin recent researches [14]. TCSC is a low cost FACTS device andwidely used for congestion relief.Benefits of FACTS devices are more when they are located in a mostsuitable position in the power system [15]-[17]. Intelligence techniques are used for maximizing the benefits of FACTS devices incongestion management [18]. The recently developed PSO algorithmis attempted for congestion management by load curtailment and/orgeneration reschedule (non cost free methods).In this paper, transmission congestion is managed by optimizing thereactive power loss/line flow through different transmission lines inthe system. Transformer tap settings and TCSC sizes are the decisionvariables for reactive power loss/line flow minimization. The controlparameters are varied in a coordinated manner and improved resultsare obtained.2 MODELLING OF TCSCAssociate Proessor, Dept of Electrical and Electronics EngineeringV.R.S. College of Engineering and Technology, Villupuram, TN, IndiaE-mail:sithansakthi@gmail.comNumerous methods have been proposed in the literature for congestion management [5]-[7]. Transmission congestion is relieved byway of generation reschedule, forced outage of lines, load curtail-TCSC is a series connected FACTS device connected in series withthe transmission line power flow through which is to be changed.Power injection model of FACTS devices are suitable for static applications like congestion management [19]-[20]. TCSC injects certain amount of real and reactive power into the system and hence itcan be represented as PQ elements. The advantage of power injectionmodel is it does not affect the symmetry of the bus admittance matrix. TCSC is considered as a variable capacitor connected in seriesIJSER 2012http://www.ijser.org
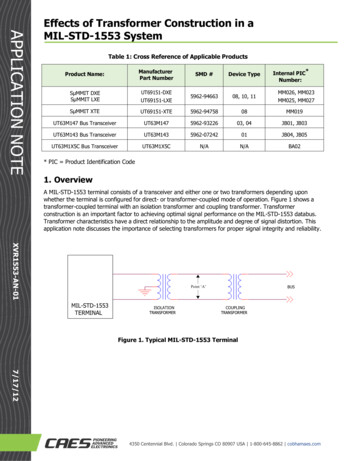
International Journal of Scientific & Engineering Research Volume 3, Issue 8, August-2012ISSN 2229-5518with the line. Nominal π method of transmission line is used.Vi2move through the search domain with a specified velocity in searchof optimal solution. Each particle maintains a memory which helps itin keeping the track of its previous best position.The positions of the particles are distinguished as personal best andglobal best. In the past several years, PSO has been successfullyapplied in many research and application areas. It has been demonstrated that PSO gets better results in a faster and cheaper way incomparison to other methods like GA, simulated annealing (SA) etc.The particles or members of the swarm fly through a multidimensional search space looking for a potential solution. Each particleadjusts its position in the search space from time to time according tothe flying experience of its own and of its neighbors (or colleagues).JXCFor a D-dimensional search space, the position of the ith particle isrepresented as:Figure 1. Equivalent circuit of a TCSCThe presence of TCSC exchanges real and reactive power with thesystem and they are expressed as shown in equations (1)-(4). Thispower injection modifies only the bus powers not the symmetry ofbus admittance matrix.Each particle maintains a memory of its previous best position whichis represented as:The best one among all the particles in the population is representedas:The velocity of each particle is represented as:Figure 2. Power injection model of TCSCThe real and reactive powers injected at buses ‘i’ and ‘j’ areThe maximum velocity is represented as:In the above equations the change in conductance () and susceptance () of the line in which TCSC is located are given as:The velocity Vi of each particle is clamped to a maximum velocityVmax which is specified by the user. Vmax determines the resolutionwith which regions between the present position and the target position are searched. Large values of Vmax facilitate global exploration,while smaller values encourage local exploitation. If Vmax is toosmall, the swarm may not explore sufficiently beyond locally goodregions. On the other hand, too large values of Vmax risk the possibility of missing a good region. At each iteration a new velocity valuefor each particle is evaluated according to its current velocity, thedistance from the global best position. The new velocity value is thenused to calculate the next position of the particle in the search space.This process is then iterated a number of times or until a minimumerror is achieved. The two basic equations which govern the workingof PSO are that of velocity vector and position vector given by:3 PARTICAL SWARM OPTIMIZATION (PSO) ALGORITHMThe concept of PSO was first suggested by Kennedy and Eberhart[21] in 1995. Since its development, PSO has become one of themost promising optimizing techniques for solving global optimization problems. Its mechanism is inspired by the social and cooperative behavior displayed by various species like birds, fish, termites,ants and even human beings. The PSO system consists of a population (swarm) of potential solutions called particles. These particlesHere w is the inertia constant, c1 and c2 are acceleration constants.They represent the weighting of the stochastic acceleration terms thatpull each particle towards personal best and global best positions.Therefore, adjustment of these constants changes the amount of tension in the system. Small values of these constants allow particles toIJSER 2012http://www.ijser.org
International Journal of Scientific & Engineering Research Volume 3, Issue 8, August-2012ISSN 2229-5518roam far from the target regions before tugged back, while high values result in abrupt movement toward, or past, target regions. Theconstants rand1, rand2 are the uniformly generated random numbersin the range of (0, 1).The first part of Eq. (12), wvid, represents particle‘s previous velocity,which serves as a memory of the previous flight direction. Thismemory term can be visualized as a momentum, which prevents theparticle from drastically changing its direction and biases it towardsthe current direction. The second part, c1rand1 (pid - xid), is called thecognition part and it indicates the personal experience of the particle.We can say that, this cognition part resembles individual memory ofthe position that was best for the particle. The effect of this term isthat particles are drawn back to their own best positions, resemblingthe tendency of individuals to return to situations or places that weremost satisfying in the past. The third part, c2rand2 (pgd - xid),represents the cooperation among particles and is therefore named asthe social component. This term resembles a group norm or standardwhich individuals seek to attain. The effect of this term is that eachparticle is also drawn towards the best position found by its neighbour.3If TCSC is located in line between buses ‘i’ and ‘j’, the power balance equation at nodes ‘i’ and ‘j’ are given by: 0Whereis the real power injection in bus ‗i‘;andare thereal power generation and load at bus ‗i‘;is the real powerinjection due to TCSC at bus ‗i‘;is the reactive power injectionin bus ‗i‘;andare the real power generation and load at bus‗i‘;is the real power injection due to TCSC at bus ‗i‘;Apparent power flow limit4 CONGESTION MANAGEMENT PROBLEM FORMULATIONCongestion management can be achieved either by minimizing totalreactive power loss in the system or by minimizing the MVA flowthrough overloaded lines. Sum of reactive power flow through all thelines in the system is taken as the objective value for location ofTCSC in the former case and power flow performance index (PI) isthe objective in the latter case. TCSCs are located in the system suchthat the total reactive power loss/PI value is minimum.4.1 Objective functionThe objective of this work is to minimize the total reactive powerloss or PI value for congestion relief. Therefore the objective functions can be written as:Power generation limitTCSC reactance limitBus voltage magnitude limit4.2 Implementationo of PSO for congestion managementr4.2.1. Representing an individual:Each particle in the population is defined as a vector containing thevalues of control parameters including the size and location ofTCSCs.Whereis the reactive power loss in line ‗k‘; NL is total numberof lines;is the susceptance of line ‗k‘; Vi and Vj are the magnitudes of bus voltages at bus ‗i‘ and bus ‗j‘;are angles ofbus voltages at bus ‗i‘ and bus ‗j‘;is the apparent power flowthrough line ‗k‘;is the apparent power flow limit. Equalweightage is given to all lines (the weightage factor ‗w‘is taken as‗1‘). The value of power component ‘n‘ is considered to be ‗1‘ in thisstudy.Subject to:Power balance equationsParticle is (Tp1, Tp2, Tp3, Tp4 , XTCSC1, LOCTCSC1 , XTCSC2, LOCTCSC2 )TCSC device is positioned at a possible location (line) and the NRload flow is run and reduction in reactive power loss/PI index (fitness) is observed. This procedure is repeated for all particles in theswarm iteratively. Then the velocity of each particle is calculated andthey move to some other line in the system (takes new position) withthe new velocity. The fitness of each particle corresponding to itsnew position is calculated by running load flow problem. The currentfitness is compared with the fitness of the same particle in the previous iteration. If the current fitness is better, the current position ofthe particle is considered as Pbest otherwise the previous position isretained as the Pbest and best among the Pbest of all particles in theswarm is called Gbest.IJSER 2012http://www.ijser.org
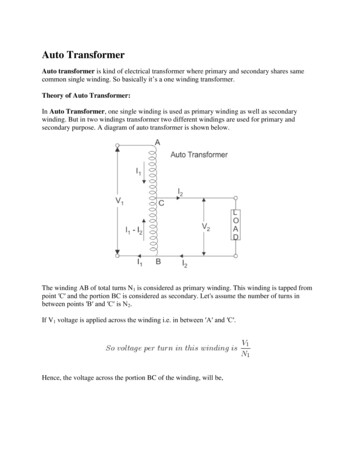
International Journal of Scientific & Engineering Research Volume 3, Issue 8, August-2012ISSN 2229-55184.2.2. Number of particles:44.2.4. Optimal Parameter Values:There is a trade-off between the number of particles and the numberof iterations of the swarm and each particle fitness value has to beevaluated using a power flow solution at each iteration, thus thenumber of particles should not be large because computational effortcould increase dramatically. Swarms of 10, 20 and 50 particles arechosen as an appropriate population sizes.Table 1. Optimal values of PSO parametersParameter4.2.3. Feasible region Definition:There are several constraints in this problem regarding the characteristics of the power system and the desired congestion relief. Each ofthese constraints represents a limit in the search space. Therefore thePSO algorithm has to be programmed so that the particles can onlymove over the feasible region. For instance, the network in Fig. 3 has4 transmission lines with tap changer transformer. In terms of thealgorithm, each time that a particle‘s new position includes a linewith tap setting transformer, the position is changed to the geographically closest line without transformer.Optimal valueNumber of particles50Inertia weight0.4Individual acceleration constant2.5Social acceleration constant2.0No of iterations25Velocity bounds{-3,7}rand10.3rand20.24 RESULTS AND 2109GG31647G28G5GGThe proposed method is tested in IEEE 30 bus test system [22]. Thereal power settings correspond to optimal power generation cost[23]. The real power settings are not changed to keep the systemoperating conditions the most economical one only the line flows areadjusted so as to avoid line congestions. This method is coded inMatlab 7.9 environment and a 2.9 GHz, Core2Duo based computersystem is used for the simulation. The test system has 6 generatorbuses, 24 load buses and 41 transmission lines. Four of the lines (11,12, 15, 36) have tap changer transformers.The real power settings are optimized for minimum fuel cost butthese settings results in line flow congestion in line number ‗1‘ connected between buses 1-2. The maximum limit of this line is 130MVA and apparent power flow through this line when fuel cost isIJSER 2012http://www.ijser.org
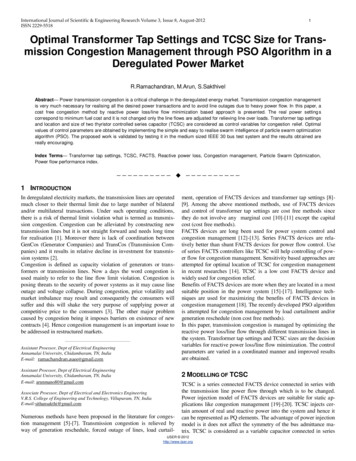
International Journal of Scientific & Engineering Research Volume 3, Issue 8, August-2012ISSN 2229-5518minimized is 114.72 MVA. When power flow through a line exceeds80% of its limit, the line is treated to be congested. Power flowthrough the line is 88.24% of its limit that the congestion is clear.Even though the fuel cost is optimized, the system is not under secured conditions for operation in deregulated environment. Optimalpower flow in deregulated market should take into account the lineflow limits as a vital constraint.Four transformer tap settings and location and size of two TCSCs aretaken as control variables for optimizing the congestion management. There are 4 tap changer transformers and one location and onesize for each TCSC accounting 8 control variables. The upper andlower bounds of the 8 control parameters are listed in table 2. Theproblem is approached in two different ways as explained in the following sections.Figure 4. Line flows before and after placement of TCSC (case A)140Range1Tap setting(Tpi)(0.9 )- (1.1)2TCSC reactance(Xc)(-0.8Xij) - (0.2Xij)3TCSC location(LOCTCSC)(1) – (41)80604001The algorithm is run a number of times to obtain the most suitablevalues for the control variables. The optimal values of transformertap settings and TCSC location and size are as given in table 3. Thetotal reactive power (objective function value) is reduced from38.9560 MVAR to 31.7446 MVAR after the optimization of 4 transformer tap settings and sizes of 2 TCSCs.47 10 13 16 19 22 25 28 31 34 37 40Line NumberCase B: Power flow performance index approachIn a deregulated environment, power flow through some of thetransmission line may near the thermal limit while other lines mightbe carrying less amount power due to large number of transactions.The overloaded lines are prone to congestion. Power flow pattern ischanged to alleviate congestion by controlling tap changer settingsand TCSC sizes. The optimal values of control variables are the onesthat minimize the PI value to the most optimal level.The PSO algorithm, after several runs, indentifies the most suitablevalue of control variables as shown in table 4. It may be noted thatthe optimal control variable values are different from the values obtained in reactive power reduction approach.Table 4. Global best parameter valuesTable 3.Global best parameter valuesControl variableWith TCSCs20Case A: Reactive power loss minimization approachIncreased reactive power flow is an indication of increased MVApower flow (congestion) in transmission lines. Congestion can berelieved by minimizing the reactive power loss. TCSC is used tochange the line reactance and thereby the line power flow getschanged. The values of control variables are so set that the total reactive power loss in the system is minimized.Sl.NoWithout TCSCs120MVA flowControl VariableThe power flow results corresponding to optimal values of controlparameters are shown in table 3. The reduction in reactive powerloss after installation of TCSCs helps the system to get relieved fromcongestion. It is evident that total reactive power loss is from 34.78MVAR to 30.89 MVAR. It may be observed that the power flowthrough line ‗1‘ between buses 1-2 was 114.78 MVA before congestion is managed. Now, the line flow is only 90 MVA that is congestion is relieved. The change in line flow pattern does not violate thelimit of any line in the system.100Table 2. Allowable range of control variablesSl.No5InitialvalueGlobal bestvalueSl. NoControl .7372---2-47Location of TCSC1---2-3---1-38Location of TCSC2---16-177Level of compensation ofTCSC1Level of compensation ofTCSC2Location of TCSC18Location of TCSC256IJSER 2012http://www.ijser.orgLevel ofTCSC1Level ofTCSC2compensationofcompensationof
International Journal of Scientific & Engineering Research Volume 3, Issue 8, August-2012ISSN 2229-5518The line flows before and after the optimization process are compared in figure 5. Limit of line 1-2 was carrying 114.78 MVA and itis reduced to 95.549 MVA. It can be seen from the figure that all thelines are carrying less power than their maximum limit.Figure 5. Line flows before and after placement of TCSC (case b)140Without TCSCs120[6][7]With TCSCs[8]100MVA Flow[5]8060[9]40200[10]1 4 7 10 13 16 19 22 25 28 31 34 37 40Line Number[11]4 RESULTS AND DISCUSSIONSThis work proves the effectiveness of two cost free congestion management schemes incorporating TCSC devices. Congestion management by these proposed methods do not affect the customer benefits since the real power schedule remains unchanged. It is obviousfrom the numerical results that the congestion relief is very muchencouraging. The system operator can use this method to relive thecongestion and all contracted power transactions can be accommodated without violation of line flow limits. Further, all the lines in thesystem are left with sufficient loading margins and therefore the system becomes capable of transmitting increased amount of powerflows.The very purpose of supplying power to consumers at competitiveprice can be ensured to consumers. This approach, a cost free one,implemented through PSO algorithm will be a better alternative tonon cost free methods of congestion management. Moreover, thePSO algorithm is simple and it could be implemented 12]Seyed M.H. et al, ―Social welfare improvement by TCSCusing real code based genetic algorithm in double- sided auction market‖, Advances in Electrical and Computer Engineering, Vol. 11, No.2, 2011.E. Hirst, U.S. Transmission Capacity: Present Status andFuture Prospects, Edison Electric Institute and Office ofElectric Transmission and Distribution, U.S. Department ofEnergy, 2004.Srinivasa Rao Pudi et al, Optimal placement of TCSC basedon a sensitivity approach for congestion management, Fifteenth National Power System Conference, December 2008.Sujatha Balaraman et al, ―Congestion management in deregulated power system using real coded genetic algorithm‖,International Journal of Engineering Science and Technology, Vol. 2, No. 11, pp. 6681-6690, 2010.[18][19][20][21]IJSER 2012http://www.ijser.org6A.K. David, ―Dispatch methodologies for open accesstransmission systems‖, IEEE Transactions on Power Systems, Vol. 13, No. 1, pp 46- 53, 1998.R. S. Fang, and A. K. David, ―Transmission congestionmanagement in electricity market‖, IEEE Transactions onPower Systems, Vol. 14, No. 3, pp. 877-883, 1999.Harry Singh, Shan You, and Alex Papalexopalos, ―Transmission congestion management in competitive electricity market‖, IEEE Transactions on Power Systems, Vol. 13, No. 2,pp. 672-680, 1998.Acharya N, Mithulananthan N. Locating series FACTS devices for congestion management in deregulated electricitymarkets. Electric Power System Research, Vol. 77, pp.352–60, 2007.Besharat H, Taher SA. ―Congestion management by determining optimal location of TCSC in deregulated power systems‖, International Journal of Electrical Power Energy Systems, Vol. 30, pp. 563–8, 2008.Nguyen TT, Nguyen VL. Application of wide-area networkof phasor measurements for secondary voltage control inpower systems with FACTS controllers. In: Power engineering society general meeting, IEEE2005, Vol. 3, pp. 2927–34.Rahimzadeh S, Tavakoli Bina M, ―Looking for optimalnumber and placement of FACTS devices to manage thetransmission congestion. Energy Conver Manage, Vol. 52,pp.437–46, 2011.T. S. Chung, and Y. Z. Li, ―A hybrid GA approach for OPFwith consideration of FACTS devices‖, IEEE Power Engineering Review, pp. 47-50, 2001.P. Bhasaputra and W. Ongasakul, ―Optimal power flow withmulti-type of FACTS devices by hybrid TS/SA approach‖, inProc. IEEE ICIT 2002, Bangkok, Thailand, pp.285-288.Abouzar samimi et al, ―A new method for optimal placement of TCSC based on sensitivity analysis for congestionmanagement‖, Smart Grid and Renewable Energy, Vol.3, pp.10-16, 2012.P. Preedavichit, S.C. Srivastava, ―Optimal reactive powerdispatch considering FACTS devices, Electric Power SystemResearch, Vol. 46, pp 251–257, 1998.S.N. Singh, A.K. David, ―A new approach for placement ofFACTS devices in open power markets‖, IEEE Power Engineering Review, Vol. 21, No. 9, pp. 58–60, 2001.H. Mori, Y. Goto, ―A parallel Tabu search based method fordetermining optimal allocation of FACTS in power systemsin‖, International Conference on Power System TechnologyProceedings, Vol. 2, pp. 1077–1082, 2000.S. Gerbex, R. Cherkaoui, J. Germond, ―Optimal location ofmulti-type FACTS devices in a power system by means ofgenetic algorithms‖, IEEE Transactions on Power SystemsVol.16, No. 3, pp. 537–544, 2001.Y. Xia, Y.H. Song, Y.Z. Sun, ―Power flow control approachto power systems with embedded FACTS devices‖, IEEETransactions on Power Systems, Vol. 17, No. 4, 2002.C. Lehmkoster, ―Security constrained optimal power flowfor an economical operation of FACTS devices in liberalizedenergy market‖, IEEE Transactions Power Delivery, Vol.17, No. 2, 2002.J. Kennedy, R. Eberhart, Particle swarm optimization in,Proceedings of the IEEE International Conference on NeuralNetworks, pp. 1942- 1948, 1995.
International Journal of Scientific & Engineering Research Volume 3, Issue 8, August-2012ISSN 2229-5518[22][23]Power Systems Test Case, 2000, The University of earch/pstca.Taher niknam et al, ―A modified shuffled frog leaping algorithm for multi-objective optimal power flow‖, Energy, Vol.36, pp-6420-6432, 2011.BIOGRAPHIESR.Ramachandran received the Degree in Electrical and Electronics Engineering in 2001 andMaster Degree in Power Systems Engineering in2002 both from Annamalai University. He is doingthe Ph.D., Degree in Electrical Engineering facultyof Annamalai University, Chidambaram, TamilNadu, India. He is as an Assistant Professor inElectrical and Electronics Engineering at the same University. He isinterested in the areas of Economic load dispatch, Power systemderegulation and Voltage stability improvement.7M.Arun obtained his Bachelor Degree in Electrical and ElectronicsEngineering in 2001 from Bharathidhasan University, Master Degree in Power Systems Engineeringin 2005 and Ph.D. Degree in 2012 both from Annamalai University. He is with the Department ofElectrical and Electronics Engineering at Annamalai University Tamil Nadu, India. His researchareas of interest are Power System control, Powersystem deregulation and Voltage stability improvement.S.Sakthivel received the Degree in Electrical and Electronics Engineering in 1999 from Madras University and Master Degree in Power Systems Engineering in 2002from Annamalai University. He is pursuing thePh.D., Degree in Electrical Engineering facultyfrom Anna University of Technology, Coimbatore,India. He is presently working as an AssociateProfessor in Electrical and Electronics Engineeringat V.R.S.College of Engineering and Technology,Villupuram, Tamil Nadu, India. His research areas of interest arePower System control, Optimization techniques, FACTS, Economicload dispatch, Power system deregulation and Voltage stability improvement. IJSER 2012http://www.ijser.org
and control of transformer tap settings are cost free methods since they do not involve any marginal cost [10]-[11] except the capital cost (cost free methods). FACTS devices are long been used for power system control and congestion management [12]-[13]. Series FACTS devices are rela-tively better than shunt FACTS devices for power flow control.