Transcription
American Journal of EpidemiologyCopyright O 2000 by The Johns Hopkins University School of Hygiene and Public HealthAD rights reservedVol.151, No. 11Printed in USAResidential Radon Gas Exposure and Lung CancerThe Iowa Radon Lung Cancer StudyR. William Field,1 Daniel J. Steck,2 Brian J. Smith,3 Christine P. Brus,1 Eileen L. Fisher,1 John S. Neuberger,4Charles E.PIatz,5 Robert A. Robinson,5 Robert F. Woolson,3 and Charles F. Lynch'Exposure to high concentrations of radon progeny (radon) produces lung cancer in both underground minersand experimentally exposed laboratory animals. To determine the risk posed by residential radon exposure, theauthors performed a population-based, case-control epidemiologic study in Iowa from 1993 to 1997. Subjectswere female Iowa residents who had occupied their current home for at least 20 years. A total of 413 lung cancercases and 614 age-frequency-matched controls were included in the final analysis. Excess odds were calculatedper 11 working-level months for exposures that occurred 5-19 years (WLM J prior to diagnosis for cases orprior to time of interview for controls. Eleven WLM 19 is approximately equal to an average residential radonexposure of 4 pCI/liter (148 Bq/m3) during this period. After adjustment for age, smoking, and education, theauthors found excess odds of 0.50 (95% confidence interval: 0.004, 1.81) and 0.83 (95% percent confidenceinterval: 0.11, 3.34) using categorical radon exposure estimates for all cases and for live cases, respectively.Slightly lower excess odds of 0.24 (95 percent confidence interval: -0.05, 0.92) and 0.49 (95 percent confidenceinterval: 0.03, 1.84) per 11 WLM 18 were noted for continuous radon exposure estimates for all subjects and livesubjects only. The observed risk estimates suggest that cumulative ambient radon exposure presents animportant environmental health hazard. Am J Epidemiol 2000;151:1091-1102.case-control studies; dose-response relationship, radiation; lung neoplasms; radon; smoking; women's healthLung cancer has been the leading cause of cancerdeath in US women since 1987 (1). Risk estimatesderived from epidemiologic studies of undergroundminers attribute about 18,600 lung cancer deaths(range, 3,000-38,600) in the US population to residential radon decay product (radon) exposure (2).Residential radon exposure risk estimates extrapolatedfrom miners to the public are subject to many uncertainties (3) because of inherent differences betweenthese populations and differences between the mineand home environments (4, 5).Empirical evidence showing an increased lung cancerincidence from residential radon exposure is lacking.Numerous epidemiologic investigations using either ecologic (6-8) or case-control (9-19) designs have attemptedto examine the relation between residential radon exposure and lung cancer. The case-control study design overcomes many of the limitations inherent in ecologic studies (20-24). Ten of the more rigorously designedcase-control studies published to date (9-18) have notshown a consistent pattern regarding the associationbetween radon exposure, cigarette smoking, and lungcancer. Poor radon exposure estimates have impeded theability of case-control studies to detect underlying associations (19, 25). We conducted a population-based casecontrol study of Iowa women that incorporated a uniquecombination of study design and enhanced dosimetrictechniques (19), including individual mobility assessment, population stability, expert histologic review, and ahigh percentage of live cases, to determine whether or notresidential radon exposure exhibits a statistically significant positive association with lung cancer.Received for publication April 15,1999, and accepted for publication October 26, 1999.Abbreviations: IRLCS, Iowa Radon Lung Cancer Study; OR, oddsratio; WLM ,,, working-level month of radon exposure for years 5-19prior diagnosis for cases or time of interview for controls.1College of Public Health, Department of Epidemiology,University of Iowa, Iowa City, IA.2Physics Department, St John's University, Collegeville, MN.3College of Public Heaith, Department of Biostatjstics, Universityof Iowa, Iowa City, IA.4School of Medicine, Department of Preventive Medicine,University of Kansas, Kansas City, KS.5College of Medicine, Department of Pathology, University ofIowa, Iowa City, IA.Reprint requests to Dr. R. William Reid, College of Public Health,Department of Epidemiology, University of Iowa, N222 Oakdale Hall,Iowa City, IA 52242 (e-mail: bil-fieldOuiowa.edu).MATERIALS AND METHODSThe Iowa Radon Lung Cancer Study (IRLCS) hadfour major components: 1) rapid reporting of cases; 2)a mailed questionnaire followed by a face-to-face1091
1092Field etal.interview; 3) a comprehensive radon exposure assessment; and 4) independent histopathologic review oflung cancer tissues. The IRLCS protocols receivedapproval from the University of Iowa's InstitutionalReview Board in accordance with guidelines from theUS Department of Health and Human Services.Lung cancer casesLung cancer cases met the following inclusion criteria:1) newly diagnosed with a microscopically confirmed primary invasive (not in situ) lung carcinoma, without anyprior primary invasive lung carcinoma; 2) female Iowaresident at time of diagnosis; 3) age 40-84 years; and4) residence in the current home for 20 consecutive yearsor more. A total of 1,974 female lung cancer cases wereidentified by the Iowa Cancer Registry between May 1,1993 and October 30, 1996. The Iowa Cancer Registryhas been a member of the Surveillance, Epidemiology,and End Results Program of the National Cancer Institutesince 1973. The consent of each case's physician wasobtained prior to contacting the subject. Rapid reportingidentified 90.3 percent of the cases, with a median timebetween diagnosis and ascertainment of 20 days.Forty-three percent of the 1,974 cases had lived intheir current home for at least 20 years. Thirty-one percent (n — 603) of the 1,974 cases identified met all eligibility criteria. Of these, 440 cases (73 percent) consented to take part in the study. Each subject or her nextof kin provided written informed consent prior to enrollment into the IRLCS. Of the consenting cases, 431 (98percent) completed the process of filling out mailedquestionnaires with follow-up in-person facilitation ofthe questionnaires and placement of radon detectors.The questionnaires included information concerningfamily health history, demographics, occupational exposures, smoking history, passive smoke exposure history,previous nonmalignant lung disease, diet, and a detailedsection on characteristics of the home. Questionnairedata were manually double-entered into the computer,and a 10 percent random sample was selected to manually check against the original coded reports.To obtain a reliable histologic diagnosis, weretrieved pathologic materials after obtaining signedpermission from 423 of the 431 eligible lung cancercases or their next of kin. Two board-certified surgicalpathologists from the Department of Pathology at TheUniversity of Iowa Hospitals and Clinics reviewed thepathologic material upon which a diagnosis of lungcancer was made for these subjects. The reviewerswere blinded to the diagnosis on the pathology reportas well as to each other's review diagnosis. The majordiagnostic groups were based on the World HealthOrganization's histologic typing of lung tumors andincluded the major categories of small cell carcinoma,squamous cell carcinoma, adenocarcinoma, and largecell carcinoma (26). Additional details concerning thehistologic review are available elsewhere (27).Final review of the 431 cases excluded 18 cases fromthe study because their detectors were discarded by nextof kin after the case died. Radon measurements werecompleted for 413 of the cases. Histologic materialswere not available for eight of these cases, and eightothers refused to sign the consent form granting permission to obtain histologic materials. The registry-reportedhistologic subtype was used for classification of these16 cases. The two surgical pathologists provided a consensus histologic diagnosis for 397 (96 percent) of the413 cases. Thirty-three lung cancers included in theanalyses were classified as carcinoma not otherwisespecified because there was either insufficient pathologic material to review or the material was of poorquality. Risk analyses were performed on the 413 cases.ControlsControls met the following eligibility criteria: 1) noprior primary invasive lung cancer at the time of initialcontact; 2) female Iowa resident at time of initial contact; 3) age 40-84 years; 4) alive at time of interview;and 5) residence in the current home for 20 consecutiveyears or more. Controls aged 40-64 were selected fromcurrent driver's license tapes provided by the IowaDepartment of Transportation. Controls aged 65-84were selected from a current tape made availablethrough the Health Care Financing Administration.These two databases were chosen to provide a population-based sampling frame (28, 29). Both controlsselected from driver's license tapes and those selectedfrom Health Care Finance Administration records wereage-frequency matched with the lung cancer cases by5-year age groups. Additional information concerningcontact with controls and the population representativeness is available elsewhere (27-29).Forty-eight percent of the controls initially identifiedthrough either current driver's license tapes or HealthCare Financing Administration records had lived intheir current home for at least 20 years. A total of 1,337eligible controls were identified between May 1, 1993and October 30, 1996. Of the controls, 693 (52 percent)consented to take part in the study, and of these, 625 (90percent) completed the process of filling out the mailedquestionnaires with follow-up in-person review of thequestionnaire and placement of radon detectors. Allcontrols were alive at the time of the home visit Riskanalyses were performed on the 614 controls who completed yearlong radon measurements.A follow-up questionnaire that compared smokingand working histories was routinely sent to eligiblecontrols who refused to participate in the study (n Am J Epidemiol Vol. 151, No. 11, 2000
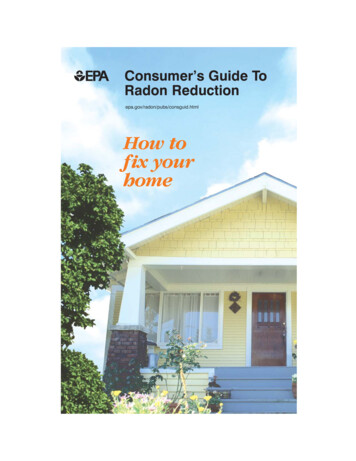
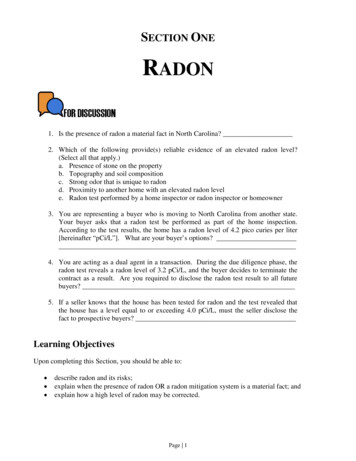
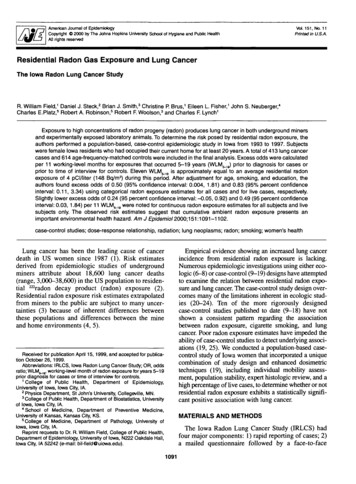
Residential Radon Gas Exposure644). A total of 224 controls returned their questionnaire. Comparisons were made between participatingand nonparticipating controls on the basis of questionnaire responses to having ever worked outside of thehome, current working status, and smoking history. Inaddition, the eligible controls who returned the shortquestionnaire were offered yearlong radon testing oftheir bedroom.Radon dosimetryThe radon dosimetry assessment consisted of fivecomponents: 1) on-site residential assessment survey;2) on-site radon measurements; 3) regional outdoorradon measurements; 4) assessment of subject's exposure when in another building; and 5) linkage of historical subject mobility with residential, outdoor, andother building radon concentrations. A detaileddescription of the radon dosimetry assessment is presented elsewhere (19, 27). Briefly, the first componentwas a residential assessment and dosimetry placementconducted in person at the subject's home. Historicalparticipant mobility within the home as well as timespent outside the home and in other buildings wasascertained by a face-to-face interview using amethodology described elsewhere (19, 27, 30-32).The mobility assessment accounted for all of the time(168 hours/week) from when the participant movedinto the current home until study enrollment.The second component of the radon dosimetryassessment was on-site measurement of home radongas concentrations for each case and control. At leastone Radtrak Alpha Track Detector (Landauer, Inc.,Glenwood, Illinois) was placed on each level of thehome, in current and historical bedrooms, and in inhome work areas. Field technicians retrieved thedetectors after the 1-year exposure period. In all, 4,626alpha-track detectors were placed at the 1,027 studysites. Overall, 97 percent of all alpha-track detectorsOutdoor Radon Concentrationsplaced were retrieved 1 year later. Information describing the IRLCS's Dosimetry Quality Assurance Planand information detailing the accuracy and precisionof IRLCS alpha-track detector measurements are published elsewhere (33).The third component of the radon dosimetry assessment was the measurement of annual average outdoorradon concentrations at 111 geographically dispersedlocations in Iowa by using 129 US EnvironmentalProtection Agency proficient alpha-track detectors. Theoutdoor radon concentrations and the radon concentrations from the participants' first floors were mapped byusing a kriging procedure (figure 1). The outdoor radonexposure was estimated from the local average of thekriged grid values derived from direct outdoor measurements. The exposure model assumed that a subjectwas primarily exposed to radon outside the home at avariety of locations, and the exposure was weighted sothat the radon concentration within 1 mile (1.6 km) ofthe home accounted for 50 percent of the exposure withincremental decreased weighting out to 20 miles (32km). Additional information concerning outdoor radonconcentrations in Iowa is presented elsewhere (34).Estimated radon exposures in other buildings (work,schools, churches, stores, etc.) were the fourth component of our radon dosimetry assessment. We studied therelation between bedroom radon concentrations andradon concentrations in other buildings for approximately 100 women in nearby Minnesota. The resultsfrom this study suggested that the best estimate for theradon concentrations in other buildings is 0.5 times thefirst-floor residential radon concentration. Thus, we alsoconstructed a kriged surface grid for the other buildingsbased on 0.5 times the first-floor radon concentrationswithin the controls' homes. The exposure modelassumed that a subject spent time in many local buildings and assigned the average value of the other building kriged grid within a 20-mile (32-km) radius of herhome as her average exposure in other buildings.First Floor Radon ConcentrationsFIGURE 1. Maps of outdoor and first-floor radon concentrations In Iowa, IRLCS, 1993-1997.Am J Epidemiol Vol. 151, No. 11, 20001093
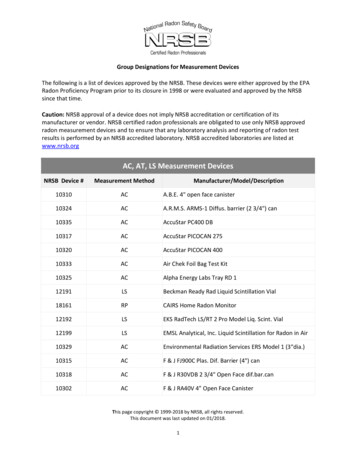
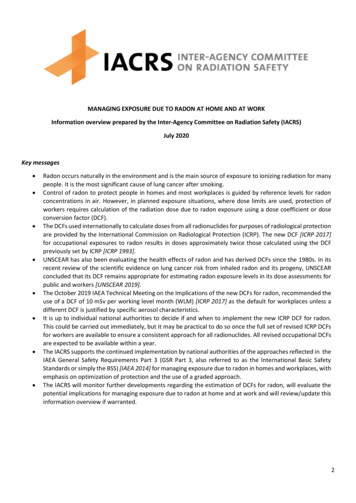
1094Field et al.The fifth component of the radon dosimetry assessment was the linkage between the various radon concentrations and both the subject's temporal and her spatial mobility (equation 1). A time-weighted average radon exposure for each subject was calculated based on average yearlong radon measurements performed in the current bedroom (and the historical bedroom, if applicable), each level of the home, and in-home work area (if applicable).For each subject, the average yearlong radon measurement was linked to percent time spent in the bedroom (andthe historical bedroom, if applicable), each level of the home, in-home work area (if applicable), outdoors, in otherbuildings, and away on vacation or business travel. The current, average, yearlong radon measurement wasassumed to be constant over the years that the participant lived in the home; however, the temporal and spatialactivity (time spent in the bedroom, each level of the home, etc.) was allowed to vary for each subject by individual season and period of time as recorded in the face-to-face interview. A radon concentration of 0.95 pCi/liter (35Bq/m3) was assumed for the subject's radon exposure while the subject was away from home on vacation or business. This value (0.95 pCi/liter) represents the mean for the national average single-family home indoor (1.5pCi/liter) and national average outdoor (0.4 pCi/liter) radon concentrations (35-37). Exposure estimates wereavailable for all years that the subject had lived in the current home. Temporal and spatial mobility information wascollected in a way that allowed estimation of exposures by time windows for the participants. The retrospectivetime window 5-19 years prior to diagnosis for cases or prior to initial contact for controls was chosen to computea cumulative radon exposure for two reasons. First, studies of underground miners demonstrate that the latencyperiod for radiogenic cancer is 5 years (3, 4). Second, the 20-year time interval inclusion criteria allowed a reasonable pool of eligible cases and eliminated the need to impute missing radon measurement data during thisperiod. Previous studies of underground miners exposed to radon indicated that radon exposure occurring 5-15years prior to the development of lung cancer carried the greatest risk per unit exposure (4).Mobility-linked working level month exposure for year yMobility and radon concentrationsX assumed equilibrium ratio of 50 percenthfy total hours spent at location / during the yth year prior to enrollmentr, radon concentration (pCi/liter) at location /MBHBU HB2, .WA L,, la, .ABOSAWyearlong ATD measurementyearlong ATD measurementsyearlong ATD measurementaverage of ATDs on L,, Lj, . (other than MB, HBU HB2, . and WA)0.5 X first-floor concentrations (figure 1)yearlong outdoor ATD measurements (figure 1)0.95 pCi/literLocationsMBHBX, HB2, .WAL,, Lj, .ABOSAWMaster bedroomHistoric bedroom 1, 2,.Home work areaHome level 1, 2, . (other than MB, HBU HB2, ., and WAAnother buildingOutsideAway from home (other than AB and OS)Am J EpidemiolVol. 151, No. 11, 2000
Residential Radon Gas Exposure1095Statistical analysesRESULTSThe associations between lung cancer risk andobserved radon exposures were studied by using linearexcess odds models in the form expressed in equation 2:The mean age at lung cancer diagnosis was 67.9years, and, as expected, was comparable with the ageat contact for controls, 67.4 years (table 1). Cases hada slightly higher median residency time within theircurrent home at time of contact. The percent of subjects who attained a postsecondary education and thenumber of children were both slightly higher for controls. All of the controls were alive at the time of interview. Rapid reporting led to a high percentage (68.5percent) of live cases. For the remaining cases, next ofkin participated. The next of kin who completed questionnaires consisted of husbands (58.0 percent),daughters (16.7 percent), sons (14.7 percent), sisters(2.6 percent), brothers (1.3 percent), and other relatives or friends (6.7 percent). Fifteen percent of thetime, more than one relative helped to complete theproxy questionnaires. A slightly higher percent ofcases resided in urban areas. A significantly higher frequency of previous lung disease was seen for cases. Asexpected, the greatest difference observed betweencases and controls was the proportions of ever smokers, with 86.4 and 32.5 percent of the cases and controls, respectively, smoking for either at least 6 monthsor 100 cigarettes in their lifetime. Among ever smokers, the pack-year exposure was much higher for casescompared with controls. Among former smokers,cases stopped smoking more recently than did controls. The odds ratio (OR) for lung cancer for womenwho smoked at least 100 cigarettes or who smoked fora period of at least 6 months in their lifetimes versuswomen who never smoked was 13.2 (95 percent confidence interval: 9.5, 18.3). In addition, ORs of 8.1 (95percent confidence interval: 5.6, 11.7) and 29.0 (95percent confidence interval: 19.1,43.9) were found forlight and heavy smokers, respectively, compared withthe never smokers. These findings are consistent withprevious risk estimates from large-scale, populationbased studies examining the relation between smokingand lung cancer in women (39-41).Data from the follow-up questionnaire found no differences between participation and refusals amongcontrols for the categories ever-worked, currentworker, ever smoked, and current smoker. In addition,no significant differences were noted in the bedroomradon concentrations (Wilcoxon rank-sum test, p 0.17) between participating controls and the controlrefusals (21 percent) who performed radon testing.-7T exp{po (2)where IT is the conditional probability of lung cancer,w is the cumulative working-level month radon exposure for years 5-19 prior to study enrollment, and thex, are potential confounding variables. Under a raredisease assumption, this model is of the same generalform as the excess relative risk models developed forradon by the National Research Council (4).Cumulative radon exposure was expressed in working-level months for exposures occurring 5-19 yearsprior to diagnosis (WLM5 19) for cases or prior to thetime of interview for controls. WLM exposure wasanalyzed both as a categorical and a continuous variable. Subjects were partitioned a priori into five exposure cells for the categorical analyses. The highest 15percent of exposed cases and controls combined constituted the fifth cell. The remaining subjects weredivided among four equal width intervals of WLM gexposure. The median exposure within each of thefive categories was used as the quantitative value. Forthe continuous analyses, actual WLM5 19 exposurewas used.Continuous variables were included in the regression models to adjust for the effects of age, activesmoking, and attained education level. The measuresof active smoking most significantly associated withlung cancer risk, years since smoking cessation andcigarette pack-year rate, were selected for the regression model. Pack-year rate was defined as the averagenumber of packs smoked per year from birth until 5years prior to study enrollment (assumed latencyperiod for lung cancer) for controls or lung cancerdiagnosis for cases. Results are also presented fornever, light, and heavy smokers, where "light" and"heavy" are based on the median pack-year rate(208.2 median pack-years) among those who smokedat least 100 cigarettes or who smoked for a period ofat least 6 months in their lifetime. Pack-year rate waschosen for this categorization because it was moststrongly and significantly associated with lung cancerrisk. The data were analyzed using the S-PLUS statistical package (38). Model parameters were estimatedvia maximum likelihood techniques. Trend tests, testsfor heterogeneity, and 95 percent confidence intervalsare two-sided and are based on the likelihood ratiostatistic.Am J Epidemiol Vol. 151, No. 11, 2000Radon dosimetryHome radon concentrations. An average of fourradon detectors were placed at each study home. Themeasurements followed an approximately log-normal
1096Field etai.TABLE 1. Demographic characteristics of cases and controls in the IRLCS*, Iowa, 1993-1997CasesNo.TotalControlsVbare413Age 2.92.819.237.640.4Mean age at diagnosis (cases) orcontact (controls)67.967.4Residency in home (median)3331Mean no. of children3.23.0Education (years)10.257.232.67.748.743.6In-person interview68.5100.0Urban residential setting82.371.7Previous lung disease43.626.512Ever-smokerst357Smoking (pack-years)0-1920-3940-59260Former ars since cessation of smoking10-1920-2923029.821.920.527.870.517.37.15.1 IRLCS, Iowa Radon Lung Cancer Study.t Individuals who smoked at least 100 cigarettes or for a period of at least 6 months in their lifotime.i Former smokers were individuals who had quit smoking for at least 5 years before diagnosis for cases or forat least 5 years before time of interview for controls.distribution. Geometric mean radon concentrations bylevel of the home are presented in table 2. The meanfirst- and second-story radon concentrations wereapproximately half the concentrations detected in thebasements of homes. The mean radon concentrationsfound in the basement of case and control homes weresimilar, while slightly higher radon concentrationswere noted for the first and second story of casehomes. Detailed information concerning the spatialvariation of radon concentrations in IRLCS homes ispresented elsewhere (42). The majority of basementradon concentrations and a significant percentage offirst- and second-story radon concentrations exceededthe US Environmental Protection Agency's actionlevel of 4 pCi/liter (148 Bq/m3) for both cases and controls. Geographic areas that exhibited the highest firstfloor radon concentrations were located in areas ofwestern and central Iowa (figure 1).Outdoor radon concentrations. The outdoor radonconcentrations at the 111 geographically dispersedsampling stations throughout Iowa ranged from 0.2pCi/liter (7.4 Bq/m3) to 1.5 pCi/liter (56 Bq/m3), withAm J EpidemiolVol. 151, No. 11. 2000
Residential Radon Gas Exposureeducation, and urban/rural status. Additional information concerning the spatial and temporal mobility patterns of study subjects is published elsewhere (32).TABLE 2. Residential radon gas concentrations for the 1,027IRLCS* homes, Iowa, 1993-1997Subjectsandlevel of homeNo.ofhomesGeometric mean(pCi/liter)(GSD*)% exceeding4 pCi/ltter(148 Bq/m1)ControlsBasement125676142984.6 (2.2)2.4 .5 (2.2)2.7 (2.2)2.1 (2.1)58.732.720.6Risk estimatesThe WLM5 19 cumulative radon exposures followeda log-normal distribution. Table 4 presents the estimated odds ratio for lung cancer and tests of lineartrend for WLM5 19 cumulative radon exposure for allcontrols and cases and subset analyses of controls andcases who were ah've at the time of interview. The riskestimates were adjusted for age, active smoking, andeducation. For all lung cancer subjects, there was apositive categorical trend (p 0.05). Analyses restrictedto the 283 live cases and 614 live controls noted botha strong categorical {p 0.01) and a continuous (p 0.03) trend. The fifth exposure category was also statistically significant (OR 2.14, 95 percent confidence interval: 1.12, 4.15).Table 5 displays the 15-year cumulative radon exposure risk at 11 WLM5 19 for all subjects and for livesubjects categorized by both the continuous and categorical variables. Eleven WLM5 19 is roughly equivalent to an average residential exposure of 4 pCi/liter(148 Bq/m3), assuming a 70 percent home occupancyand the other assumptions of the BEIR VI report (2).Excess odds of 0.24 (95 percent confidence interval:-0.05, 0.92) and 0.50 (95 percent confidence interval:0.004, 1.81) per 11 WLM ,, were calculated for allcases by using the continuous and categorical variables, respectively. Higher excess odds of 0.49 (95percent confidence interval: 0.03, 1.84) and 0.83 (95percent confidence interval: 0.11, 3.34) were noted per11 WLM5 ,9 for the live case subset for both the continuous and the categorical risk estimates, respectively.The effect of the urban or rural status of subjects wasexamined by classifying them as living within or out-* IRLCS, Iowa Radon Lung Cancer Study; GSD, geometric standard deviation.a mean and a geometric mean of 0.82 pCi/liter (0.27standard deviation) and 0.78 pCi/liter (1.4 geometricstandard deviation), respectively. Geographic spatialsimilarities between the first-floor and outdoor radonconcentrations were apparent (figure 1). Detailedinformation concerning the modeling of outdoorradon concentrations in Iowa and its impact on radonexposure assessment is available elsewhere (34).Spatial and temporal occupancypatterns.Temporal longitudinal trends in the mobility patternsfor cases and controls varied modestly over time (table3). The mean time spent at home for the controlsranged from a low of 69.4 percent at age 50-59 yearsto a high of 81.5 percent at age 80-84 years. The meantime spent at home for cases ranged from a low of 70.5percent at age 40-49 years to a high of 81.6 percent atage 80-84 years. Both controls and cases who lived ineither one- or two-story homes with basements spentthe majority of their residential occupancy on the firststory. Trends across age for both cases and controlsvaried for other subgroups by number of children,TABLE 3. Mean percent time spent at home, in another building, outside, and away on vacation orbusiness*, IRLCS.f Iowa, 116.711.67.87.07.77.57.26.75.981.6 The category "another building" represents time spent in another building at work, volunteer work, shopping,etc. The category "away* represents vacation time or work assignments at a geographic location significantly awayfrom the usual residence or place of employment The category "outside' represents time spent in the outdoors,but also includes time spent in a vehicle.t IRLCS, Iowa Radon Lung Cancer Study.Am J EpidemiolVol. 151, No. 11, 20001097
1098Reid eta).TABLE 4. Estimated odds ratios* for lung cancer and tests of a linear trend for WLM, ltt cumulativeradon exposure, IRLCSt, Iowa, 1993-1997AliveAllMedianWLM ,, cumulative 94 16.953.166.1810.5014.5821.16p for 5%ClfCases/controlsOR95% Cl0.81,2.220.99, 3.040.88, 2.990.99, .140.75, 2.310.97, 3.330.88, 11839/7548/880.030.01* Estimates are adjusted for age, active smoking, and education.t WLM ,,, working-level months for exposures that occurred 5-19 years prior to diagnosis for cases or time ofinterview for controls (1 working-level month is equivalent to 3.5 x 10r3 Jh/m3); IRLCS, Iowa Radon Lung CancerStudy; OR, odds ratio; Cl, confidence interval.t The temporally and spatially weighted median WLM cumulative exposure over 5-19 years was 7.9 WLM and8.6 WLM for all controls and cases, respectively.side of city limits, as well as by county type of residence (large urban, small urban, and rural counties).After control for age, education, and active smoking,the urban/rural status was not significantly assoc
2) on-site radon measurements; 3) regional outdoor radon measurements; 4) assessment of subject's expo-sure when in another building; and 5) linkage of his-torical subject mobility with residential, outdoor, and other building radon concentrations. A detailed description of the radon dosimetry assessment is pre-sented elsewhere (19, 27).