Transcription
SAS Modeling Best PracticesUsing SAS Enterprise Miner Presenter: Melodie Rush, Principal Data ScientistQ&A: Twanda Baker, Data ScientistHost: Dean Shaw, Global Webinar StrategistCopy rig ht SA S Institute Inc. A ll rig hts re se rve d.
Copy rig ht SA S Institute Inc. A ll rig hts re se rve d.
SAS Modeling Best PracticesBusiness PurposeData Understanding& PreparationModel Build &EvaluationAgenda Problem definitionSupervised vs. unsupervised learning Best model for available data? Modeling assumptions Objective Target data available? Choosing & transforming features Holdout & test samplesStatistics Copy rig ht SA S Institute Inc. A ll rig hts re se rve d.
Modeling Best Practices Case StudyPredicting Credit RiskScenario:The loan officers of the bank are trying to decide what rate to offer loanapplicants.Available Data: 1000 observations (past applicants)Information on attributes & behavior of past applicants- Ex: property, age, savings Label indicating “good” or “bad” candidates- Based on loan result (i.e. whether the applicant was able to pay the loan while adhering to the terms of service)- 70% good, 30% badConsiderations: Offering a “good” applicant a more favorable rate will result in a 35% profit, while offering a “bad”applicant the same rate will result in a total unit lossCopy rig ht SA S Institute Inc. A ll rig hts re se rve d.
Predicting Credit RiskData ColumnsCopy rig ht SA S Institute Inc. A ll rig hts re se rve d.
Predicting Credit RiskDataCopy rig ht SA S Institute Inc. A ll rig hts re se rve d.
Copy rig ht SA S Institute Inc. A ll rig hts re se rve d.
Business PurposeUnderstanding your ObjectiveCopy rig ht SA S Institute Inc. A ll rig hts re se rve d.
Copy rig ht SA S Institute Inc. A ll rig hts re se rve d.
Business PurposeCommon Questions to AskWhat is yourobjectiveabout?What are youtrying to learn?Copy rig ht SA S Institute Inc. A ll rig hts re se rve d.Are we trying topredict, classify,or describesomething?
Business PurposeProblem DefinitionClients People or groups who benefit from the outcomesof the modelsObjectives Goals to be achieved that serve the interests ofthe clientsCriteria Measures of success or failureDecision Makers People who influence the achievement ofobjectivesCopy rig ht SA S Institute Inc. A ll rig hts re se rve d.
Business PurposeProblem DefinitionResources Available time, labor, capital for development &deployment of modelConstraints LimitationsCritical Assumptions Implicit & explicit assumptions about the world orindustry in which the model/project is beingdevelopedCopy rig ht SA S Institute Inc. A ll rig hts re se rve d.
Modeling Best Practices Case StudyPredicting Credit RiskClientsObjective(s) Loan officers Bank institution/organizationResources Accurate classification of applicant Maximum average profitConstraintsCriteriaDecisionMakers IT available to deploy model? Type of system used Analysts & programmers available to createand maintain model? Data limitations (availability, amount ofobservations) System limitations Initial: model evaluation statistics Long term: profit derived from results Chief Financial Officer (CFO) Chief Information Officer (CIO)CriticalAssumptionsCopy rig ht SA S Institute Inc. A ll rig hts re se rve d. Higher interest rate for riskier applicantsprevents large loss of Reward less risky applicants with more lowerinterest rates in effort to attract morefavorable business
Model Objective Supervised vs. Unsupervised Learning?Copy rig ht SA S Institute Inc. A ll rig hts re se rve d.
Types of LearningSupervised LearningTrained on labeled examplesCopy rig ht SA S Institute Inc. A ll rig hts re se rve d.
Types of LearningUnsupervised LearningTrained on unlabeled examplesCopy rig ht SA S Institute Inc. A ll rig hts re se rve d.
Supervised sed Learning How much will prospect x spend? Will customer x default on her loan? What items are commonly purchasedtogether? What other companies are like ourbest small business customers? What does normal behavior look like? Do my customers form naturalgroups? Involves classification or regressionRandom forestsDecision treesNeural networks*Linear regressionLogistic regressionSupport vector machinesk-NN (k-nearest neighbors)Gradient boostingEnsembles*Can be used as an unsupervised learning technique as wellCopy rig ht SA S Institute Inc. A ll rig hts re se rve d.Clustering (by observation or variable)Anomaly detectionPrincipal component analysis (PCA)Singular value decomposition (SVD)Expectation-maximization algorithmMultivariate analysis
Data UnderstandingChoosing the Best TechniqueCopy rig ht SA S Institute Inc. A ll rig hts re se rve d.
Copy rig ht SA S Institute Inc. A ll rig hts re se rve d.
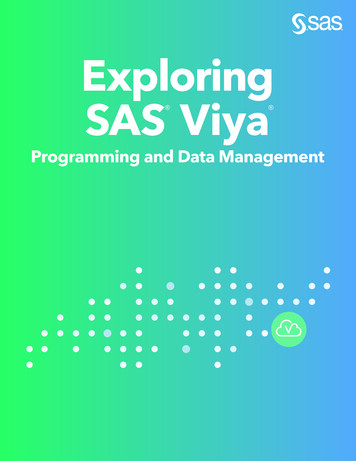
Data UnderstandingDoes myobjective gUnsupervisedLearningNotsureNote: Try to obtain data forsame or related phenomenon toperform supervised tasksNoIs there a specific,quantifiable target Iam interested in ortrying to predict?NoYesDo I have data onthis target?Copy rig ht SA S Institute Inc. A ll rig hts re se rve d.Yes
Modeling Best Practices Case StudyPredicting Credit RiskIs there a specific, quantifiabletarget I am interested in ortrying to predict? Yes we are interested inthe credit risk of loanapplicants (either “bad” or“good”)What question am I seeking toanswer? Does applicant X have“good” or “bad” credit?Supervised LearningCopy rig ht SA S Institute Inc. A ll rig hts re se rve d.Do I have data on the target? Yes 1000 observations ofprevious applicants &resulting behavior (labelsthat indicate as “good” or“bad”)
Supervised Learning TechniquesCopy rig ht SA S Institute Inc. A ll rig hts re se rve d.
Data UnderstandingSupervised Learning Classification or Regression? Classification categorical target Target has discrete, NON-ordinal valuesMost common case binary classificationProbability estimation or ranking- Exception wherein classification model predicts continuous values such as probabilities orranks/scores- Probability estimation model predicts a score b/w 0 & 1 for each available class- Use: cost or benefit is known relatively precisely & may not be constant across instances- Ranking model predicts a score wherein a higher score indicates higher likelihood of being ingiven class (in case of binary classification)- Use: cost or benefit is constant across instances & is unknown or difficult to calculate Regression numeric targetCopy rig ht SA S Institute Inc. A ll rig hts re se rve d.
Data UnderstandingDecision Tree vs. Linear Models Questions to Consider: What is more comprehensible to stakeholders? Rules or a numeric function? How “smooth” is the underlying phenomenon being modeled? How “non-linear” is the underlying phenomenon being modeled? How much data do you have? What are the characteristics of the data?Copy rig ht SA S Institute Inc. A ll rig hts re se rve d.
Data UnderstandingWhen to apply Machine Learning ? Questions to Consider: How large is your data set?- Speaks to scalability may be easy to classify a few hundred emails as spam or not but thisproblem becomes more tedious & difficult as the size of the emails increases to the millions How easily can you outline the underlying phenomenon?- Large # of factors could influence answer to specific classification or prediction problem- Rules overlap or need to be finely tuned- Ex: classify email as spam or not- What constitutes spam?- What affects whether an email is spam?- Is this specific to the person or organization?Copy rig ht SA S Institute Inc. A ll rig hts re se rve d.
Unsupervised Learning TechniquesCopy rig ht SA S Institute Inc. A ll rig hts re se rve d.
Data UnderstandingDescriptive Statistics & Dimension ReductionUnsupervised learning techniques can be used in conjunction withsupervised techniques in an effort to improve model performance.Additionally, it can be used on it’s own when there is a lack of target data.Clustering Observation or Variable ClusteringObs. clustering provides description of data (ex: doyour consumers fall naturally in to specific groups? regionally, financially, etc.) Variable clustering reduces # of variables for use insupervised modeling technique improvesperformance by minimizing modeling complexity PCA or EFA Additional dimension reduction techniquesCopy rig ht SA S Institute Inc. A ll rig hts re se rve d.
Data UnderstandingDescriptive Statistics & Dimension ReductionUnsupervised learning techniques can be used in conjunction withsupervised techniques in an effort to improve model performance.Additionally, it can be used on it’s own when there is a lack of target data.Anomaly Detection Identifies items, events or observations which donot conform to an expected pattern or otheritems in dataset descriptiveMultivariate DataAnalysis Analyzing data from more than one variableANOVA or MANOVA ANOVA tests for difference in means b/w 2 or moregroups MANOVA tests for difference in 2 or more vectors ofmeans Copy rig ht SA S Institute Inc. A ll rig hts re se rve d.
Copy rig ht SA S Institute Inc. A ll rig hts re se rve d.
Transforming & Selecting Variables Reasons to transformForce variable distribution to be normal Standardize all inputs to make sure all are on same scale Remove bias Methods Nominal dummy indicators, group rare levelsInterval bucket, center, equalize, exponential, inverse, log, optimal binning,quantile, square, square root, standardize (normalize)Copy rig ht SA S Institute Inc. A ll rig hts re se rve d.
Transforming & Selecting Variables Transform variables Modeling assumptions for models such a linear regression, there arecertain assumptions that need to be met to ensure the accuracy of the model- Linearity, normality, heteroscedasticity- Adherence to assumptions looser for logistic regression Normality assumes all inputs have normal distribution (skewed distributioncan be normalized by applying log transformation, exponential)Copy rig ht SA S Institute Inc. A ll rig hts re se rve d.
Transforming & Selecting Variables Selecting variablesMany modeling methods choose inputs as a part of the building process Linear or logistic regression employs stepwise, backward or forward selection(can also choose to just include all available inputs) Tree models - Decision builds tree based on variable importance- Random forests builds multiple trees, each with different sampling of observations & inputs Prior to applying model- Chi square or R square- LASSO or LAR- Unsupervised correlation, covariance, sum of squares or cross productCopy rig ht SA S Institute Inc. A ll rig hts re se rve d.
Predicting Credit Risk Case StudyApplying Techniques in Enterprise Miner Copy rig ht SA S Institute Inc. A ll rig hts re se rve d.
Copy rig ht SA S Institute Inc. A ll rig hts re se rve d.
Modeling & EvaluationMeeting your ObjectiveCopy rig ht SA S Institute Inc. A ll rig hts re se rve d.
Copy rig ht SA S Institute Inc. A ll rig hts re se rve d.
Modeling & EvaluationMeasuring Accuracy Partition dataTrain, validate & test (holdout) samples Validate normally used to choose model (technique, features, complexityparameters) while test confirms accuracy 40-30-30 split is default Additional technique cross validation - Randomly partition data into k folds, run training/test evaluation k times Be aware of overfitting or underfitting- Validation set helps to prevent overfitting- Overfitting model fits data well but is not generalizableCopy rig ht SA S Institute Inc. A ll rig hts re se rve d.
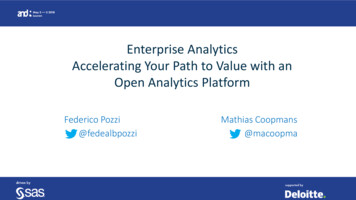
Modeling & EvaluationMeasuring AccuracyFit statisticsDepends on many factors including objective & available information Regression Average square error Classification - Misclassification/error rate percentage of incorrect classificationsActual- Confusion matrix𝑎 -YabNcd- True positive rate (sensitivity or recall) 𝑎 𝑐𝑑- True negative rate (specificity) 𝑏 𝑑𝑎- Positive predictive value (precision) 𝑎 𝑏Copy rig ht SA S Institute Inc. A ll rig hts re se rve d.Predicted
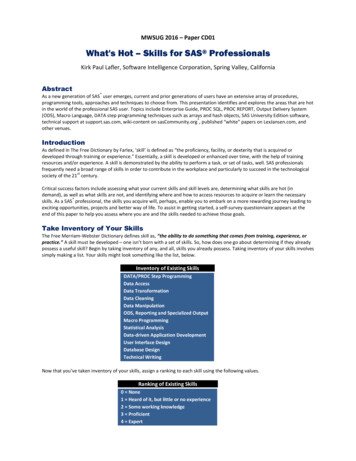
Classifier EvaluationBusiness Costs & BenefitsTaking into account businessobjective Example: Objective maximize profit Target binary, yes or no Need to combine accurateclassification with profit & lossesCopy rig ht SA S Institute Inc. A ll rig hts re se rve d.
Modeling & EvaluationMeasuring Accuracy Visual evaluation Works for both classification & regression models- ROC chart, AUC (area under ROC curve)- For classifier, gives probability that model will rank a positive case higher than negative case- Fair measure of quality of probability estimates- Lift chart- Measures effectiveness of predictive model calculated as ratio b/w results obtained w/ & w/o predictivemodelCopy rig ht SA S Institute Inc. A ll rig hts re se rve d.
Predicting Credit Risk Case StudyApplying Techniques in Enterprise Miner Copy rig ht SA S Institute Inc. A ll rig hts re se rve d.
Copy rig ht SA S Institute Inc. A ll rig hts re se rve d.
Copy rig ht SA S Institute Inc. A ll rig hts re se rve d.
Summary Business objective & available data is key to choosing the best modelModeling is cyclical Questions to consider along the way are helpful in determining whatmethodologies to apply but you may have to make changes or tweak thingsalong the way as you learn more about your data & the underlyingphenomenonTry multiple methodologies to obtain the best possible modelEnterprise Miner is especially good for this (can easily evaluate multiplemodels at once) EM is also good at making quick changes that will affect the rest of theprocess Copy rig ht SA S Institute Inc. A ll rig hts re se rve d.
ResourcesWhere to learn moreCopy rig ht SA S Institute Inc. A ll rig hts re se rve d.
Ready to Get on the Fast Track with Enterprise Miner?Visit sas.com/learn-emand sign up to receive EM technical resources, tips & tricksdelivered directly from Brett Wujek, Sr. Data Scientist from SAS R&DCopy rig ht SA S Institute Inc. A ll rig hts re se rve d.
Further ReadingPapers Identifying and Overcoming Common Data Mining Mistakesby DougWielenga, SAS Institute Inc., Cary, NC Best Practices for Managing Predictive Models in a ProductionEnvironment by Robert Chu, David Duling, Wayne Thompson , SAS Institute Cary, NCFrom Soup to Nuts: Practices in Data Management for AnalyticalPerformance by David Duling, Howard Plemmons, Nancy Rausch, SAS Institute Cary, NC(All available on support.sas.com )Copy rig ht SA S Institute Inc. A ll rig hts re se rve d.
ResourcesSuggested ReadingBig Data, Data Mining, and Machine Learning: Value Creationfor Business Leaders and PractitionersBy Jared DeanAvailable on AmazonData Mining Techniques: For Marketing, Sales, and CustomerRelationship Managementby Gordon S. Linoff and Michael J. A. BerryAvailable on AmazonCopy rig ht SA S Institute Inc. A ll rig hts re se rve d.
ResourcesSuggested ReadingPredictive Modeling with SAS Enterprise Miner:Practical Solutions for Business Applications, SecondEdition, Edition 2By Kattamuri S. Sarma, PhDAvailable on AmazonApplied Analytics Using SAS Enterprise MinerBy: SASAvailable on AmazonCopy rig ht SA S Institute Inc. A ll rig hts re se rve d.
Questions?Thank you for your time and attention!Connect with me:LinkedIn: https://www.linkedin.com/in/melodierushTwitter: @Melodie Rushsas.comCopy rig ht SA S Institute Inc. A ll rig hts re se rve d.
SAS Modeling Best Practices Agenda . Predictive Modeling with SAS Enterprise Miner: sas.com. Title: SAS Modeling Best Practices Author: Melodie.Rush@sas.com Created Date: 2/8/2019 4:05:06 PM .