Transcription
Pipeline MaintenanceBest PracticesLessons Learned from theNatural Gas STAR ProgramSGA Environmental Round TableCharlotte, North CarolinaJune 25 - 27, 2008epa.gov/gasstar
Pipeline Maintenance AgendaMethane LossesWhat are the sources of emissions?How much methane is emitted?Methane RecoveryHot TapsPipeline PumpdownComposite WrapsAdditional Partner Reported OpportunitiesDiscussion1
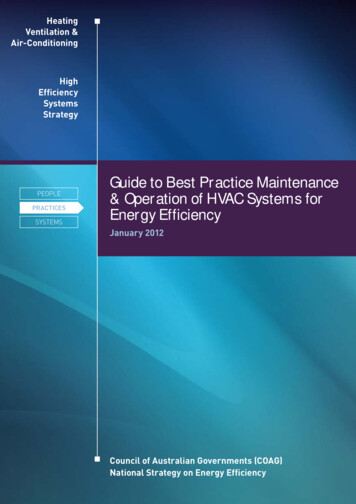
2006 Transmission Sector MethaneEmissionsPipeline leaks can occur through internal and external corrosion, materialdefects, joint and fitting defects, and third party damageStationOtherFugitives SourcesPipeline7 Bcf4 BcfLeaks7 BcfStationVenting8 BcfCentrifugalCompressors8 BcfGas EngineExhaust10 BcfReciprocatingCompressors39 BcfPneumaticDevices11 BcfEPA. Inventory of U.S. Greenhouse Gas Emissions and Sinks 1990 – 2006. April, 2008. Available on the web ventoryreport.htmlNatural Gas STAR reductions data shown as published in the inventory.2
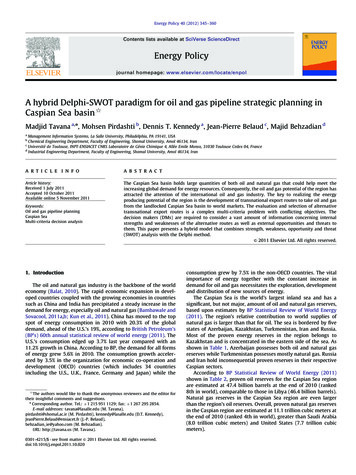
2006 Distributions Sector MethaneEmissionsOlder cast iron and unprotected steel pipelines contribute the majority ofemission of pipeline related emissionsProtected SteelMains/ServicesCustomer4 BcfMeter Leaks5 BcfOtherSources2 BcfM&R Stations14 BcfPlasticMains/Services7 BcfCast IronMains8 BcfRegulatorStations9 BcfUnprotected SteelMains/Services12 BcfEPA. Inventory of U.S. Greenhouse Gas Emissions and Sinks 1990 – 2006. April, 2008. Available on the web ventoryreport.htmlNatural Gas STAR reductions data shown as published in the inventory.3
What is the problem with current practices?Methane gas leaks are invisible, unregulated, and gounnoticedMethane vented in preparation for pipeline maintenance/newconnectionsSmallest possible linear section of pipeline is blocked in anddepressurized to the atmosphere“Hot work” may require purging pipeline with inert gasThese practices results in methane emissionsLoss of SalesService disruption and customer inconvenienceCosts of evacuating the existing piping system4
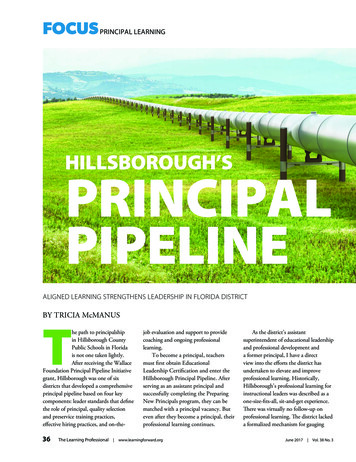
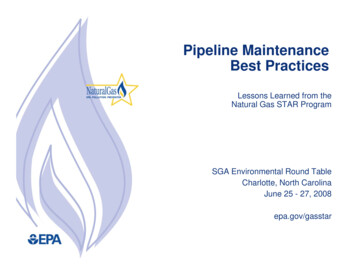
Hot TapsConnectingPipelines withoutDisruptionSource: Williamson Industries Inc.5
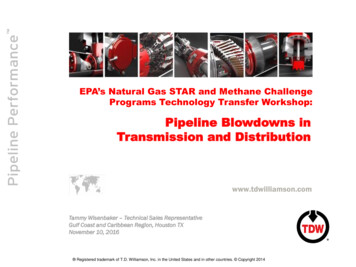
What are Hot Taps?New branch connection while thepipeline remains in serviceAttach a branch connection andvalve to the main pipelineCut-out a section of the mainpipeline wall through the valve toconnect the branch to the mainpipelineCurrent technology has improvedreliability and reducedcomplicationsHot tapping can be used to addconnections to a wide range ofpipelinesTransmission pipelinesDistribution mainsSchematic of Hot Tapping Machine6
Hot Tapping ProcedureConnect fitting andpermanent valve on theexisting pipelineInstall hot tapping machineon the valvePerform hot tap andextract coupon through thevalveClose valve and removehot tapping machineConnect branch line7
Hot Tap BenefitsContinuous system operation – shutdown andservice interruptions are avoidedNo gas released to the atmosphereAvoided cutting, realignment and re-welding ofpipeline sectionsReduced planning and coordination costsIncreased worker safetyNo gas outages for customers8
Hot Tap EconomicsDetermine physical conditions of existing lineCalculate the cost of a shutdown interconnectHot tap expensesEstimated annual hot tap costsFor hypothetical scenarioEstimated annual hot tap savingsFor hypothetical scenarioEconomic analysis of hot tap vs. shutdown9
Determine physical conditions ofexisting lineMaximum operating pressure (during hot tap)Type of pipe materialCondition of parent pipeline (internal/externalcorrosion and wall thickness)Emergency valve location for isolation in case ofaccidentsWorking space evaluation (desired tap diameter,location of other welds, obstructions, etc.)Check if the line is looped10
Calculate Cost of Shutdown InterconnectGiven: A pipeline company requires numerous shutdownor hot tap connections as follows -Pipeline diameter (D) 4 inchesPipeline pressure (P) 350 psigIsolated pipeline length (L), milesAnnual taps435022508100130101,00032518200215Volume of natural gas lostVg []D 2 * P * L1,000 * 0.3721,000 22 Mcf * 7/Mcf 154 [4 2 * 350 * 2 * 5,280] * 0.3721,0001,00011
Calculate Cost of Shutdown Interconnect(cont’d)Volume of purge gas (assumed to be nitrogen)Vpgas D2 * L 183 * 2.21,000 4 2 * 2 * 5,280 183 * 2.21,000 2 MscfGiven:Cost of natural gas (Cg) 7/MscfCost of nitrogen (Cpgas) 8/MscfValue of gas lost by shutdown interconnects (Including purge gas)Cost Cg Cpgas Vg * Pg Vpgas * Ppgas (22 * 7) (2 * 8) 170 for each 4 inch pipeline shutdown interconnect12
Hot Tap ExpensesCalculate the cost of a hot tap procedureCost of the hot tap equipment purchase and O&M cost of hot tappingcontractPurchase costs for small tapping machines vary from 17,287 to 30,122Most companies find it economical to contract out large jobsCapital Costs ( )ConnectionSizeMaterialContractingService Cost ( )Equipment O&MCost ( /yr)Machine1Small Taps( 12”)17,287 –30,122----724 – 7,235Large Taps( 12”)130,963 –261,92722,619 –11,94421,447 – 5,788--1Hot tap machines can last from 5 to 40 years. A company can perform as many as 400 smalltaps per year.2 Most companies will find it more economical to contract out large jobs, and would nottherefore incur these costs.Note: Cost information provided by Hot Tap manufacturers and contractors. Prices onlyprovided for most economic options. Updated 200613
Estimated Annual Hot Tap CostsGiven (annual program):Equipment cost per small tap machine 23,704Operations and Maintenance (O&M) cost per machine 3,979Number of small hot tap machines 2Contract Services cost per large tap 3,618Number of contracted taps 15 (all taps 12 inches and larger)Total equipment cost 23,704 * 2 47,409Total O&M cost 3,979 * 2 7,959Contract Service cost 3,618 * 15 54,26314
Estimated Annual Hot Tap SavingsEvaluate the gas savings benefits of hot tappingEstimated Annual Gas Savings for the Hypothetical ScenarioTap ScenarioPipelineAnnualTapNumberNatural GasSavingsNitrogen PurgeGas SavingsTotal GasSavingsPer tapMscfAnnualMscfPer tapMscfAnnualMscf 4” pipeline, 350 psig,2 mile line250225,500250042,5008” pipeline, 100 psig,1 mile line301339041203,69010” pipeline, 1,000psig, 3 mile line2558914,72519475106,87518” pipeline, 200psig, 2 mile line152553,8254161531,695Total Annual3201,710184,76024,44015
Economic Analysis of Hot Tap vs. ShutdownCompare the options and determine the economicsof five year hot tapping program (320 taps/yr)Economic Analysis of Hot Tap Versus ShutdownYear 0Capital Cost, Year 1Year 2Year 3Year 4Year 5(47,409)00000Contract Service Cost, 0(54,263)(54,263)(54,263)(54,263)(54,263)O&M Cost, 0(7,959)(7,959)(7,959)(7,959)(7,959)Total Cost, tural Gas Savings, 171,080171,080171,080171,080171,080Inert Gas Savings, 8122,538122,538Net Benefit, (47,409)Payback (months)IRR258 %NPV11Net5 417,107Present Value (NPV) based on 10% discount rate for 5 years16
Methane Recovery by Pipeline PumpdownMost applicable to large pipelines operating at highpressuresUse In-Line compressors to “pull down” the pressureto minimum suction pressureUse portable compressor to “pull down” pressureeven furtherCost is justified by immediate payback in gas savingsAbout 90% of gas usually vented is recoverable17
Pipeline Pumpdown TechniqueIn-line CompressorTypically 2:1 compression ratioBy blocking upstream valve, the pressure in the pipeline isreduced to safe limits for maintenancePortable CompressorTypically 5:1 compression ratioCan be used in conjunction with in-line compressors toreduce pressure in pipeline sectionCost-justifiable only when multiple sections of pipeline arebeing servicedDistribution mains generally do not contain a large enoughvolume of gas to justify the use of portable compressors18
Sequence of Depressurization Events19
Economics of Pipeline PumpdownsCalculate gas vented by depressurizing pipelineCalculate gas saved with in-line compressorsCalculate gas saved with portable compressorConsider cost of a portable compressorCalculate annual savings20
Calculate Gas Vented by DepressurizingPipelineEstimate the quantity and value of gas that in-line compressors canrecoverGiven:Pipeline isolated length (L) 10 milesPipeline interior diameter (I) 2.375 feetPipeline operating pressure (P) 600 psigIn-line compressor compression ratio (Ri) 2Gas vented in depressurizing pipelineM L*(5,280 ft/mile) * (π * I2/4) * (P/14.65 psig) * (1Mscf/1,000cf)M (10*5,280) * (π*2.3752)/4 * (600 14.65)/14.65 *1/1,000)M 9,814 Mscf21
Calculate Gas Saved using In-lineCompressorsAmount of gas recoverable per action using an in-line compressorNi M – (M/Ri) 9,814 – (9,814/2) 4,907 scfValue of gas recovered per action using an in-line compressorVi Ni * 7/Mscf 4,907 * 7 34,349Annual value of gas recovered assuming 4 actions per month 34,349 * 4 * 12 1,648,75222
Calculate Gas Saved usingPortable CompressorsGiven:Portable compression ratio (Rp) 8Rate of compressor 416 Mscf / hourGas available for recovery M – Ni 9,814 – 4,907 4,907 MscfGas saved using a portable compressorNp Ni – (Ni / Rp) 4,907 – (4,907 / 8) 4,294 MscfValue of gas recovered using portable compressor1Vg Np * 7/ Mscf 4,294 * 7 30,056 * 4 * 12 1,442,6881Because cost of operating portable compressor is high, assume portable compressor is used for 4pipeline pumpdowns per month.23
Consider Costs of a Portable CompressorEstimate the costs associated with using a portablecompressorFuel costs (mostly natural gas) (Vcf) 7,000 – 8,400 Btuper brake horse power per hourMaintenance costs (Vcm) 5 - 12 per horsepower permonthLabor costs (Vcl)Taxes and administrative costs (Vct)Installation costs (Vci)Freight costs (Vcs)24
Portable Compressor Costs –Capital CostsPortable Compressor Purchase and Lease Cost Range*1,000 PSIG – High Flow600 PSIG – MediumFlow300 PSIG – Low FlowPurchaseLeasePurchaseLeasePurchaseLease 3 - 6million 77,000 194,000per month 1.0 - 1.6million 31,000 46,000per month 518,131 777,197 15,000 23,000per month*Based on assumptions that purchase cost does not include cost of freight or installationand that lease cost is 3 percent of purchase cost25
Cost of a Portable Compressor –Operating and Maintenance CostsFuel used by compressor per 10 mile isolatedlength, per month 69 MscfFuel costs assuming one 10-mile isolatedlengths, per month 7/Mscf * 69 Mscf 483 per monthTotal cost of using the portable compressorduring a 12 month period fuel costs lease and maintenance costs freight costs 12 * ( 483 31,000) 19,000 396,79626
Calculate Annual SavingsGross value of gas recoverable during a 12month period, In-line Compressor Vg * 1 * 12 34,349 * 4 * 12 1,648,752Gross value of gas recoverable during a 12month period, Portable Compressor Vg Np * 7/ Mscf 4,294 * 7 30,056 * 4 * 12 1,442,688Net Savings associated with using both Inline and Portable Compressor 1,648,752 ( 1,442,688 - 396,796) 2,677,25627
Composite WrapPermanent On-LinePipeline RepairTechnologySource: Armor Plate28
What is Composite Wrap?Non-leaking pipeline defects can only be fixed in oneof three ways, per Department of Transportation(DOT) regulations:Cut out damaged segment and replace with new pipesInstall a full-encirclement steel split sleeve over the damaged areaInstall a composite sleeve over the damaged areaComposite Wrap Advantages:Can be performed without taking pipeline out of serviceRepair is quick and less costly than replacement or sleeveoptionsEliminates venting associated with replacement29
Composite Wrap. What is it?1) A high-strength glassfiber composite orlaminate2) An adhesive or resinbonding system3) A high-compressivestrength load transferfiller compound4) Replaces lost hoopstrengthSource: Clock Spring Company L. P.30
Composite Wrap InstallationAfter excavation and pipepreparationExternal defects filled with fillerComposite wrap wound aroundpipe with adhesive or laminatingagentsTypically 2” of wrap must extendbeyond damageExcavation site refilled aftermandated curing timeReducing pressure improvesquality of repair31
Economics of Composite WrapCalculate associated costsState assumptionsCalculate labor costCalculate equipment costCalculate indirect costsCalculate Natural Gas SavingsCompare options32
Calculate Associated Costs:AssumptionsGiven:Need to repair a 6” non-leaking defect on a 24” pipeline, operatingat 350 psig; assume 16 hours to complete the project1. Assumecost of engineering management is 25% cost of field labor.Clabor cost of laborHourly rate of field labor category 46/hrOperatorPipeliner 42/hrApprentice 28/hrCequip cost of equipmentCost of individual equipmentComposite Wrap KitBackhoeSandblasting equipmentPipeline coatings (5% composite kit)1Partner supplied information. Updated to 2006 costs. 1,087/kit 45/hr 12/hr 5433
Labor CostsGiven:Cindirect indirect costs such as field inspection crew, permits, etc.(assume 50% of total equipment and labor cost)Calculate cost of laborClabor Engineering management cost Field labor costField labor cost hourly rate * time-length of project ( 46 42 28) * 16 1,856Engineering Management cost 0.25 * 1,856 464Clabor 464 1,856 2,32034
Equipment and Indirect CostsCalculate cost of equipmentCequip Cost of consumable materials (composite wrap kit andcoatings) Cost of renting/using equipment on site 1,087 54 ( 45 * 16) ( 12 * 16) 2,053Calculate indirect costsCindirect Cost of permits, inspection services, right-of-way, etc. 0.5 * (Clabor Cequip) 0.5 * ( 2,320 2,053) 2,186Calculate total cost of repairTotal Cost of Repair Clabor Cequip Cindirect 2,320 2,053 2,186 6,55935 pag
Hot Tap manufacturers and contractors. Prices only provided for most economic options. Updated 2006; 14 Estimated Annual Hot Tap Costs Given (annual program): Equipment cost per small tap machine 23,704 Operations and Maintenance (O&M) cost per machine 3,979 Number of small hot tap machines 2 Contract Services cost per large tap 3,618 Number of contracted taps 15 (all taps