Transcription
PACS ICCPACS Spectroscopy performance andcalibrationDoc ID:Issue:Date:Page:PICC KL TN 0412.331. May 20111 of 16PACS Spectroscopy performanceand calibrationPICC-KL-TN-041Prepared byWith inputs byBart VandenbusscheJoris BlommaertAlessandra ContursiHelmut FeuchtgruberChristophe JeanAlbrecht PoglitschPierre RoyerRoland VavrekApproved byAuthorised by
PACS ICCPACS Spectroscopy performance andcalibrationDoc ID:Issue:Date:Page:PICC KL TN 0412.331. May 20112 of 16Distribution ListRecipientsAffiliationNr. of CopiesDocument Change RecordIssueDateDescription1.010. Mar. 2010 First version limited to flux calibration accuracies and grosscorrection factors to the ground flux calibration1.111. Mar. 2010 Incorporated comments added a few clarifications2.06. Apr. 2011Updated flux calibration error budget; included beam efficiencies2.125. May. 2011 Included 2nd pass ghosts; formatting for public release2.226. May. 2011 Included unchopped spectroscopy uncertainties, beam size as afunction of wavelength2.331. May. 2011 Included Wavelength calibration sectionTable of Contents1 Introduction. 32 Flux calibration. 33 PACS spectrometer beam efficiency.54 Spectral leakage and ghosts.95 Wavelength calibration. 13
PACS ICCPACS Spectroscopy performance andcalibrationDoc ID:Issue:Date:Page:PICC KL TN 0412.331. May 20113 of 161 IntroductionThis document provides details on the calibration accuracy and the necessary information to optimallyinterpret PACS spectroscopy observations.New issues of this document will be released with new versions of the pipeline and new versions of thecalibration files in the Herschel interactive data analysis system.The present version (2.1) of this document is applicable for PACS results obtained with pipeline andhipe software release versions 6.0 and 7.0 and PACS calibration files version 12 and later.Processing software version can be verified in the FITS header (CREATOR keyword) or in hipe underhelp about hipeThe version of the set of calibration files used for the processing can be found in the FITS header(calTreeVersion keyword) or in hipe with the command print (getCalTree())2 Flux calibration2.1 Absolute flux scalingPACS calibration files version 12 and later provide a signal flux density conversion based on in orbitmeasurements. Therefore the user should not apply the ground to flight correction factors (1.1and 1.3) anymore.2.2 Flux calibration accuraciesThe PACS spectrometer flux calibration accuracy is limited by detector response drifts and slightpointing offsets. These limit both the absolute flux accuracy and relative accuracy within a band.Corrections for both effects are under study by the PACS ICC and will be provided to the user inforthcoming hipe software versions. Awaiting these corrections, the following accuracies shall beassumed when interpreting PACS spectroscopy data:2.2.1 Absolute flux calibration accuracyThis accuracy applies for single line fluxes or continuum flux densities at a given wavelength in anyspaxel. Beware of the correction needed for flux falling out of the pixel for point sources (section 3.3 ).The absolute flux calibration accuracy was determined from observations of 30 absolute flux skycalibration sources (fiducial stars, asteroids, planets). The table below shows the RMS of (PACSobservation / predicted model flux) and peak to peak scatter around the expected flux densities.This is the absolute flux calibration accuracy to assume for a single PACS spectroscopyobservation.Spectral BandRMSPeak-Peak accuracyB2A (50-70 micrometer)11% /- 30%B3A (50-70 micrometer)11% /- 30%B2B (70-100 micrometer)12% /- 30%R1 (100-220 micrometer)12% /- 30%
PACS ICCPACS Spectroscopy performance andcalibrationDoc ID:Issue:Date:Page:PICC KL TN 0412.331. May 20114 of 162.2.2 Relative flux accuracy within a band and detection limit for broad featuresBroad spectral features (a few micrometer) and continuum shape difference can be introduced bytransient effects and pointing offsets. Corrections for these effects are under study. In the mean time,such features should not be interpreted blindly. Note that due to the origin of these effect, they will beseen differently in every observation, so dividing two PACS spectra will not eliminate theseinstrumental effects.The table below summarises the resulting accuracy to assume when comparing relative line fluxeswithin a spectral band. When comparing line fluxes across spectral bands, the absolute fluxaccuracies in section 2.2.1 apply.This is also the current limit on detection of broad spectral features (solid state features, dustcontinuum shape).These numbers apply to the wavelength regions not affected by spectral leakage (see section 4 )Spectral BandBroad spectral feature detection limitrelative line flux accuracy within a bandB2A (50-70 micrometer)10%B3A (50-70 micrometer)10%B2B (70-100 micrometer)10%R1 (100-220 micrometer)20%2.2.3 Relative flux accuracy between spaxelsThe PACS spectroscopy pipeline in version 6.0 uses a fixed nominal response value for every pixel.These values are based on flux calibration standard measurements of sources placed on the centralspaxel. The absolute calibration of the surrounding spaxels is tied to the central spaxel via a flatfielddetermined on the telescope background. These flatfields reproduce very well. When we divide the'master flatfield' by the individual flatfields measured, we see a standard deviation of 2 3%. The tablebelow gives the relative accuracy (peak peak) when comparing line or continuum fluxes in differentspaxels. The main uncertainty in interpreting line flux differences in different spaxels is the knowledgeabout the source structure and the beam probed by the different spaxels.Spectral BandRelative line & continuum flux accuracybetween spaxelsB2A (50-70 micrometer)10%B3A (50-70 micrometer)10%B2B (70-100 micrometer)10%R1 (100-220 micrometer)10%
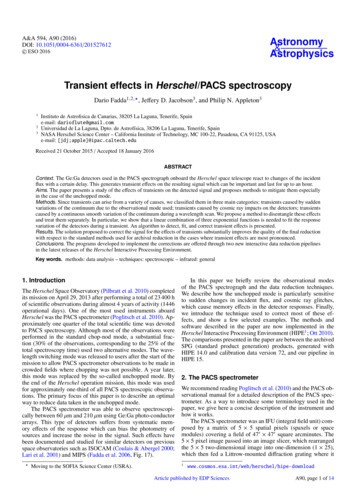
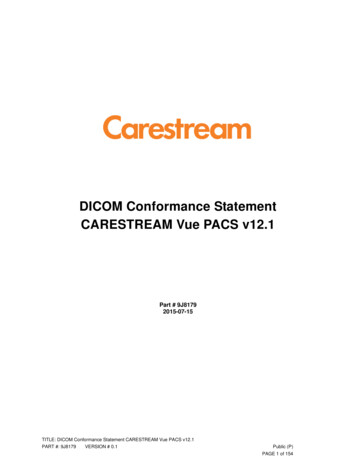
PACS ICCPACS Spectroscopy performance andcalibrationDoc ID:Issue:Date:Page:PICC KL TN 0412.331. May 20115 of 162.3 Flux calibration accuracy of unchopped spectroscopy modesThe absolute flux calibration of the PACS spectrometer is based on observations of flux calibrationstandards using chopped spectroscopy modes. There are hints of systematic differences in theresponse scaling between chopped and unchopped mode due to response transients within thechopping pattern. These are well within the flux calibration uncertainties listed in section 2.2 .Background subtraction for unchopped spectroscopy measurements is done by subtracting thetelescope background spectrum measured at an off position. Repeated off position backgroundspectrum measurements show a 4% peak to peak reproducibility in total absolute flux (telescope source) and a 1% in band shape error for the longest scans we have observed so far. Inobservations of low continuum sources this will dominate the continuum flux accuracy. For a 20 Jysource, having a 200 Jy telescope background these uncertainties translate to 40% continuumuncertainty and 10% in band continuum shape error.3 PACS spectrometer beam efficiency3.1 Detector sampling of the PSFThe PACS spectrometer spaxels sample a part of the PSF delivered by the Herschel telescope. Thetelescope PSF becomes larger with wavelength, and shows substantial departure from a gaussianprofile due to the telescope wavefront errors, mainly caused by the three point mount of the telescopedish. At different wavelengths, different fractions of the PSF structure are seen by the differentspaxels. This is illustrated in Figure Error: Reference source not found.Figure 1: Figure 1: PACS spectrometer detector positions overlaid on the telescope PSF at 75um (left) and 150um(right). Color scaling of the PSF is chosen to enhance the lobes and wings of the psf.Given the pointing accuracy of the spacecraft, this means that the fraction of the PSF falling onto thecentral spaxel can vary substantially. This is presently the main limitation of the flux calibration.The full wavelength dependent characterisation of the PSF is ongoing at the PACS ICC. In this sectionwe provide some crucial first order information to interpret flux values seen in a PACS spaxel.
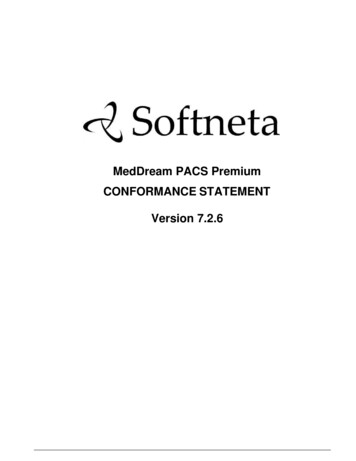
PACS ICCPACS Spectroscopy performance andcalibrationDoc ID:Issue:Date:Page:PICC KL TN 0412.331. May 20116 of 163.2 Measured beam efficienciesA full characterisation of the spectrometer beam efficiencies is ongoing. The beam efficiencies havebeen measured via raster maps on Neptune at a few selected wavelengths. The Neptune visibilitywindow in spring 2011 has been used to complete these measurements at different wavelengths inevery spectral band. Together with the detailed telescope PSF models this will allow us to providereliable model beam efficiencies well sampled across the PACS spectral coverage.The measured beam maps measured in every spaxel will be made available on the HSC PACS webpage.In figure 2 we show the measured beam efficiencies at 62, 75, 125 and 150um. Figure 3 shows thegaussian width of the measured beams as a function of wavelength. The pixel size dominates thewidth of the beam efficiency up to 150um.Figure 2: PACS spectrometer beam efficiency as measured from oversampled raster maps on Neptune. From topleft, to bottom right: 62um, 75um, 125um, 150um. The contours indicate 10%, 50% and 90% of the peak response.
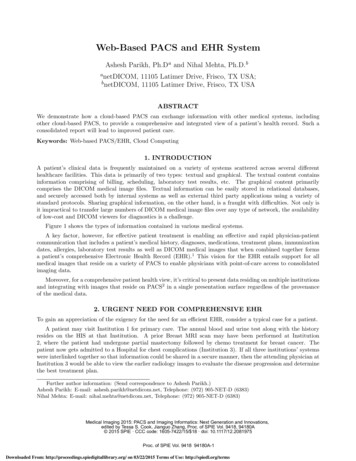
PACS ICCPACS Spectroscopy performance andcalibrationDoc ID:Issue:Date:Page:PICC KL TN 0412.331. May 20117 of 16Figure 3: Width of the PACS spectrometer beams as a function of wavelength. We show the FWHM in twodirections of the assymetric 2D gaussian fit (blue squares, red diamonds) and the mean of the two (yellowtriangles). Note that the beams are not gaussian, these numbers are a rough indication of the beam size only,.
PACS ICCPACS Spectroscopy performance andcalibrationDoc ID:Issue:Date:Page:PICC KL TN 0412.331. May 20118 of 163.3 Recovering full beam line fluxes and flux densities for point sourcesThe PACS spaxels have a projected size of 9.4”x9.4” on the sky. The fraction of the Herschel PACSPSF seen in one spaxel varies with wavelength. In order to recover full beam line fluxes or fluxdensities for point sources, a wavelength dependent correction factor needs to be applied to the linefluxes or flux densities as measured in the central spaxel only.The wavelength dependent fraction between the point source flux seen in the central spaxel and thefull beam flux has been modelled and scaled to actual measurements of the PACS spectrometer PSFmaps measured on Neptune. Version 2 of the spectrometer.pointsourceloss calibration file lists thesein orbit correction factors. (PcalSpectrometer PointSourceLoss FM v2.fits, available in the hipe ascalTree.spectrometer.pointSourceLoss.). The correction curve is depicted in Figure 4 and tabulated inappendix This correction curve assumes a perfect centering of the point source in the central spaxel.
PACS ICCPACS Spectroscopy performance andcalibrationDoc ID:Issue:Date:Page:PICC KL TN 0412.331. May 20119 of 164 Spectral leakage and ghosts4.1 First-pass spectral leakage seen in all spaxelsThe order selection filters of the PACS spectrometer have a steep but not perfectly verticaltransmission profile a the cut off wavelengths of the spectral bands. The PACS spectra near the bandborders of Bands R1, B3A and B2B are affected by higher or lower order wavelengths leaking into thespectra. Interpretation of spectral features (unresolved or continuum fluxes) in the spectral leakageregions should be avoided without consulting a PACS expert. Figures 6 5 show the wavelengthregions affected. Band B2A is not affected by this spectral leakage.
PACS ICCPACS Spectroscopy performance andcalibrationDoc ID:Issue:Date:Page:PICC KL TN 0412.331. May 201110 of 16
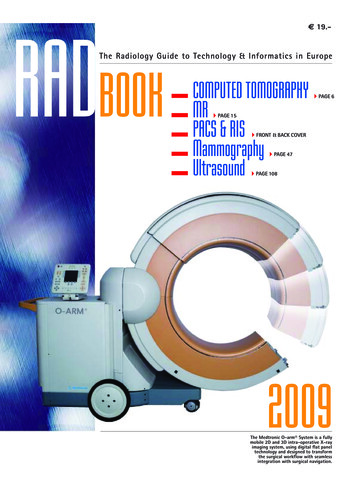
PACS ICCPACS Spectroscopy performance andcalibrationDoc ID:Issue:Date:Page:PICC KL TN 0412.331. May 201111 of 164.2 Second-pass ghost seen in some non-central spaxelsA second pass in the optics of the PACS spectrometer can cause a ghost image on some spaxels.Figure 8 shows the spaxels where a second pass ghost might appear, and the location of thecorresponding spaxels where the originating, real emission is located. The ghost appears shifted inwavelength.Figure 8: Location of the spaxels where a second pass ghost might appear. In black are the module numbers(this is the numbering in the PACS frames product), in white the row and column numbers in the PACS cubeproducts. The arrows indicate the spaxel where the originating, real emission is located.If a source in one of the originating spaxels shows a strong spectral line, typically an atomic finestructure line, a weak, broadened line can be seen at an offset wavelength in the corresponding spaxelaffected by 2nd pass ghosts. The peak flux of this line is typically 5% of the line peak of theoriginating line. The integrated line flux can be up to 14% of the integrated line flux of the originatingline. An example is shown in figure 12. The wavelength offset between the originating line and theghost line depends on the spectral order of the band, and varies with wavelength. A few examples forthe strongest fine structure lines in the PACS wavelength range are given in table 1. Appendix B.tabulates ghost wavelength against originating wavelength for all PACS bands affected.Before interpreting broad spectral lines in spaxels potentially affected by the 2 nd pass ghosts, observersshould use these tables and, if available, the spectra observed in the corresponding ghost sourcespaxel, for the presence of a strong line at the originating wavelength.Point source observations, well centered on the central spaxel, are not affected. The central column ofthe IFU is not contaminated by 2nd pass ghosts.
PACS ICCPACS Spectroscopy performance andcalibrationDoc ID:Issue:Date:Page:PICC KL TN 0412.331. May 201112 of 16Figure 9: Example of the second pass spectral leak: the strong (real) line emission at 145.5 (OI) and 157.7 (CII) inmodule 13 leak into module 10, where they are seen as broadened spectral lines around 108 and 122 micron.BandB3AB2BR1R1R1Originating lineOIO IIIOICIIN IIwavelength63.288.4145.5157.7205.3ghost wavelength5472108122178Table 1: Example 2nd pass ghost wavelengths corresponding to prominent fine structure lines in the PACSwavelength range
PACS ICCPACS Spectroscopy performance andcalibrationDoc ID:Issue:Date:Page:PICC KL TN 0412.331. May 201113 of 165 Wavelength calibration5.1 Wavelenght calibration accuracyThe PACS wavelength calibration relates the diffraction grating position to the wavelength seen inevery detector pixel. This calibration was derived from laboratory measurements of a water vapourabsorption cell, and further refined in flight based on fine structure lines in planetary nebulae. For idealextended sources the required accuracy of better than 20% of a spectral resolution element is metthroughout all bands. While at band borders, due to leakage effects and lower S/ N, the RMScalibration accuracy is closer to 20%, values even better than 10% are obtained in band centres.For point sources the wavelength calibration may be dominated by pointing accuracy.5.2 Wavelength shifts with source positionThe 5x5 PACS spaxels of the integral field unit are imaged onto a 1D slit. The 1D slit image is thendispersed by the diffraction grating. As with any diffraction grating spectrometer, moving the sourcecenter with respect to the slit center in the dispersion direction will result in a slight shift of thewavelength seen in a detector pixel. Therefore, lines observed in a point source with PACS will appearslightly shifted in wavelengths if the source is not perfectly centered on the spaxel. This is illustrated infigure 10. Since the PSF peak is resolved in the slit, a distinct skew can be seen as well when thesource is near or beyond the spaxel edge. These features should be taken into account beforeinterpreting wavelength shifts or line profiles in terms of velocity. Pointing offsets along the dispersiondirection do not result in a wavelength shift. The sign (red or blu shift) and magnitude of the shift fordifferent wavelenths is shown in figures 11and 12.Figure 10: When a point source is offset in dispersion direction with respect to the center of a spaxel, the observedlines will show a distinct shift in wavelength and a skew.
PACS ICCPACS Spectroscopy performance andcalibrationDoc ID:Issue:Date:Page:PICC KL TN 0412.331. May 201114 of 16Figure 11: If a point source is offset in dispersion direction, wavelengths will be shifted to the red whenmoving 'up', e.g. from module 12 to module 17 in the PACS IFU. When the source is offset 'down', thewavelengths will be blueshifted.Figure 12: The wavelength shift, seen when a point source is not centered perfectly, depends on the observedwavelength and band, and the pointing offset. The black dashed line shows the wavelength shift seen for a pointsource offset by 1.5". The blue, green and red dashed line shows the wavelength shift for a pointing offset of 2".The solid red, green and blue line show the wavelength shift seen when the source is centered on the spaxel edge.
PACS ICCPACS Spectroscopy performance andcalibrationDoc ID:Issue:Date:Page:PICC KL TN 0412.331. May 201115 of 16A.Point source correction factorsFraction of a point source full beam flux seen in one PACS spaxel. Values are based onPcalSpectrometer PointSourceLoss FM v2.fits. Wavelengths are in 0.492190.341060.661630.492200.33
PACS ICCPACS Spectroscopy performance andcalibrationDoc ID:Issue:Date:Page:PICC KL TN 0412.331. May 201116 of 16B.Second-pass ghosts - wavelength offsetsIn the table below we list for each band the correspondence between wavelength at which a secondpass ghost is seen, and the wavelength of the originating emission. See section 4.2 .Band R1ghost ginating 206.9Band 2Bghost 8889originating 5Band B3Aghost inating 68.168.969.770.571.372.173.073.8
Corrections for both effects are under study by the PACS ICC and will be provided to the user in forthcoming hipe software versions. Awaiting these corrections, the following accuracies shall be assumed when interpreting PACS spectroscopy data: 2.2.1 Absolute flux calibration accuracy