Transcription
GUIDE TO THE ANALYSIS AND USE OF HOUSEHOLDSURVEY AND CENSUS EDUCATION DATAUEPA / UAPS
The Network on Family and Schooling in Africa (FASAF), created in 1997, is a network ofresearchers, statisticians and education planners dedicated to using secondary data sources on thedemand for schooling, and to strengthening national research capacities and collaborative researchbetween institutions and national statistics and education offices. FASAF operates under the purview ofUAPS.UERD, BP 7118, Ouagadougou 03, Burkina FasoTelephone: (226) 36.21.15 Fax: (226) 36.21.38 E-mail: pilon@ird.bf; yacoubay@yahoo.comThe Union for African Population Study (UAPS), created in 1984, is a non-profit pan-African scientificorganization composed of specialists working on population issues. UAPS publishes scientific reviews,supports researchers, offers technical assistance, and coordinates seven thematic research networks.UAPS, BP 21007, Dakar Ponty – Dakar, SénégalTelephone: (221-8) 25.59.51 Fax: (221-8) 25.59.55 E-mail: uepa@cyg.snThe United Nations Educational, Scientific and Cultural Organization (UNESCO) is an agency thatseeks to contribute to the maintenance of peace and security by fostering collaboration between nationsthrough education, science and culture. The UNESCO Institute for Statistics has as its global mandatethe collection, analysis and dissemination of comparable statistics and indicators on education, scienceand culture and enabling national capacity in member states to address these same areas.UNESCO Institute for Statistics, C.P. 6128, Succursale Centre-Ville, Montréal, QuébecCanadaTelephone: (1-514) 343-6880 Fax: (1-514) 343-6882 E-mail: information@uis.unesco.orgWebsite: http://www.uis.unesco.orgH3C 3J7,The United Nations Children’s Fund (UNICEF) is an agency that aims to help children living in povertyin developing countries, including the care and stimulation they need in the early years of life, andprotection from illness, war and natural disasters.Strategic Information Section, UNICEF, 3 UN Plaza, New York, NY 10017 USATelephone: (1-212) 824-6745 Fax: (1-212) 824-6474 E-mail: eloaiza@unicef.orgWebsite: http://www.unicef.orgThe United States Agency for International Development (USAID) Office for Human CapacityDevelopment in the Bureau for Economic Growth, Agriculture, and Trade is responsible forimplementing USAID’s goal of building human capacity through education and training. The officeprovides field support, technical leadership and research to help nations and USAID field missionsimprove education and training and to help develop stable, democratic countries with thriving marketeconomies and healthy, well-educated families.USAID/G/HCD, DHS EdData Mgr., 1300 Pennsylvania Ave., NW, Washington, D.C. 20523-3901 USATelephone: (1-202) 712-4273 Fax: (1-202) 216-3229Website: http://www.usaid.gov/educ trainingORC Macro is an international research, management consulting and information technology firm, whichprovides survey research, policy analysis, evaluation, and training. ORC Macro implements MEASUREDHS with the Population Council and the East-West Center, and the DHS EdData Activity, a USAIDOffice for Human Capacity Development activity. DHS EdData provides information for education policyand programme planning through the collection and dissemination of education data.ORC Macro, 11785 Beltsville Drive, Calverton, MD 21202 USATelephone: (1-301) 572-0200 Fax: (1-301) 572-0999 E-mail: measure@macroint.comWebsite: http://www.dhseddata.comISBN 92-9189-016-2 UIS 2004Ref: UIS/TD/04-03Cover design: JCNicholls DesignPrinted by: ICAO
CONTENTSPageTables and Figures . 5List of Acronyms. 6Preface. 7INTRODUCTION. 8CHAPTER 1 SOURCES OF EDUCATION DATA . 101.11.21.3Education Statistics Based on Administrative Data . 10Household Survey and Census Education Data as aComplement to Administrative Data . 10Comparing Education Indicators Based on Administrativeand Survey Data . 11CHAPTER 2 EDUCATION INDICATORS FROM NATIONAL POPULATIONCENSUSES AND HOUSEHOLD SURVEYS. 132.12.22.32.42.5An Analytical Framework . 13Literacy . 16Educational Attainment . 17School Participation Ratios . 18Student Flow Ratios. 20CHAPTER 3 NATIONAL POPULATION CENSUSES AND SELECTEDHOUSEHOLD SURVEYS . 223.13.2National Population Censuses. 22Selected Household Surveys. 23CHAPTER 4 SURVEY METHODOLOGY AND THE USE OF EDUCATION DATA. 294.14.24.34.44.5Defining the Household. 29Variation in Measures of Educational Participation. 30Timing and Duration of Survey Fieldwork . 31Sample Sizes and Representativeness of Data. 32General Guidance in Data Analysis . 33-3-
PageCHAPTER 5 PRESENTATION OF HOUSEHOLD SURVEY DATA. 385.15.25.3Selecting and Presenting Standard Education Indicators . 38Presenting Clear and Complete Information . 44Presenting Data Graphically . 46REFERENCES . 51APPENDIX ACALCULATION OF EDUCATION INDICATORS . 53APPENDIX BSURVEY AND CENSUS CONTACT INFORMATION . 59APPENDIX CSURVEYS BY TYPE AND COUNTRY. 63APPENDIX DSAMPLE TABLES . 76APPENDIX EANALYSING DATA: A PRACTICAL EXAMPLE . 103-4-
TABLES AND FIGURESPageTable 1Percentage of children of primary school age attending primaryschool, Azerbaijan, 2000 MICS. 39Table 2School attendance rate, Guinea, 1999 DHS . 40Table 3Percentage of children entering first grade of primary school whoeventually reach grade 5, Chad, 2000 MICS . 41Table 4Percentage of children age 36-59 months who are attending someform of organised early childhood education programme, Côted’Ivoire, 2000 MICS . 42Table 5Percentage of the population age 15 years and older that is literate,Côte d’Ivoire, 2000 MICS. 43Table 6School attendance ratio by location, sex, and expenditure quintile(percent), Ghana, 1996 LSMS . 44Table 7Percentage of the de facto household population attending school, byage group, sex and urban-rural residence, Namibia, 1992 DHS. 45Figure 1A framework for analysing education data from household surveysand censuses. 15Figure 2Literacy rate among men age 15-59 and women age 15-49, Guinea,1999 DHS . 46Figure 3Attendance ratio among boys and girls in rural areas, Algeria, 2000MICS. 46Figure 4Age-specific attendance rates by sex, Cambodia, 2000 DHS. 47Figure 5Percentage of children age 7-12 in Ouagadougou who are enrolled inschool, by sex and relationship to household head, Burkina Faso,1996 Census. 47Figure 6Proportion of primary school students under-age, over-age, and ontime, by grade and sex, Zambia, 1996 DHS . 48Figure 7Distribution of students by age and education, Burkina Faso, 1996Census. 49Figure 8Percentage of boys and girls who attend school, according to the sexof the head of the household, Burkina Faso, EP 1994-95. 49Figure 9Percentage of households with children 6-14 years old attendingschool by location, Madagascar, Census 1993. 50-5-
LIST OF ACRONYMSAIRApparent intake ratioDHSDemographic and health surveyEFAEducation for AllEPEnquête prioritaireGARGross attendance rateGERGross enrolment ratioMICSMultiple indicator cluster surveyLSMSLiving standards and measurement studiesNARNet attendance rateNERNet enrolment ratioUISUNESCO Institute for Statistics-6-
PREFACEThere is a renewed awareness of the potential of household surveys and populationcensuses to provide the kind of information on household and individual characteristicsand their multiple interactions that is needed to formulate and monitor development.More and more countries are organising multiple-topic household surveys usingstandardised approaches to measuring on a regular basis. If properly designed andimplemented, these surveys can provide important and unique information. This Guidehas been compiled with the aim of facilitating and promoting education policy analysisand utilisation of education indicators based on household survey and census data.The Guide was first conceived and produced in French by the Research ThematicNetwork, Family and Schooling in Africa (FASAF) of the Union for the AfricanPopulation Study (UAPS), which comprises a working group of researchers, statisticiansand education planners from eight countries (Benin, Burkina Faso, Cameroon,Democratic Republic of the Congo, Côte d’Ivoire, Mali, Niger, and Togo). Otherresearchers and members of the UNESCO Institute for Statistics also madecontributions to the Guide. It was published by the French Center for Population andDevelopment (CEPED) in collaboration with UAPS and UNESCO in 1999.This English version is a collaborative effort between FASAF, the UNESCO Institute forStatistics, UNICEF, the United States Agency for International Development (USAID),and ORC Macro. It is not simply a translation of the French version but rather anextension of the original document, refining its main tenets and adding new insights.Within each contributing organization, the following staff collaborated on the Englishversion of the Guide: Jean-Francois Kobiane and Marc Pilon (FASAF)S.K. Chu, Albert Motivans, Diane Stukel, Bertrand Tchatchoua and Nghia Bui Quang(UNESCO Institute for Statistics)Edilberto Loaiza (UNICEF)Kimberly Bolyard and Linda Padgett (USAID)Kristi Fair and Anne Genereux (ORC Macro)We hope the readers of this Guide find information and ideas that will enable them tocarry out meaningful and useful analysis of education data from demographic censusesand household surveys. The authors invite you to share your experiences and findingsin order to further enrich and upgrade this Guide into a more substantive and practicalreference tool.-7-
INTRODUCTIONThe demand for data on education has never been greater, both at the national andinternational levels. In many countries, large-scale household surveys are conductedregularly to provide information on population, health, education, household income andexpenditure, employment, and other critical areas of study. In many instances, theeducation information from these data collection efforts is underutilised. However,these data can provide invaluable information to inform policy debates.The information is underutilised for two main reasons: first, because potential data usersare unaware of the education data collected by these censuses and surveys; and,second, because reports of the findings present education data primarily as abackground characteristic rather than an object of study per se.For example, reports often discuss data on education in relation to householdexpenditure or as a factor in decisions about childbearing rather than presenting data ondifferences in educational attainment by sex, age, urban/rural residence, and othercharacteristics.At the same time, it is important to accurately report and interpret survey data that aresubject to error (due to sampling design and to non-sampling error), particularly indeveloping countries where special sampling designs, such as cluster approaches, mayaffect the likelihood for error.This Guide is intended for staff in the Ministry of Education (MOE) and others who workwith education indicators, including education trainers and planners, educationresearchers, staff from national statistics offices responsible for conducting large-scalehousehold surveys and census operations, and international agencies involved ineducation issues.The Guide may also be useful to staff from Ministries of Education and theorganizations that collaborate in survey design and data analysis in the framework ofcensus and household surveys. Such collaboration allows education experts and thosein survey methodology to confer on which data are of most interest, how best to collectthese data, and how to analyse the data and present results. Hopefully, thecollaboration between these organizations will also result in greater attention toeducation issues in the design of future multiple-topic surveys. In addition, MOE staffcollaborating with survey implementing organizations are likely to utilise the data set toconduct ongoing analyses, possibly in conjunction with administrative data.Specifically, this Guide intends to: provide an overview of household-level education data that are available fromvarious sources and to describe their usefulness; provide guidance on the analysis and presentation of descriptive data so thatthey are most useful to Ministries of Education and to policy-makers; and-8-
contribute to the standardisation of indicators and calculation methods based onhousehold-level education data.The guide is organised in five chapters. The first chapter examines different sources foreducation data. Chapter 2 describes and discusses some of the education indicatorsthat can be produced based on these data sources. Chapter 3 describes nationalpopulation censuses and the major international household survey programmes.Chapter 4 discusses survey methodology and its implications for the analysis ofeducation data, while Chapter 5 addresses various ways of presenting education surveydata and provides ideas for graphically representing survey data.-9-
1SOURCES OF EDUCATION DATA1.1EDUCATION STATISTICS BASED ON ADMINISTRATIVE DATAGovernments regularly collect education statistics to monitor and manage the educationsystem. Schools and other educational institutions regularly report data on students,teachers, expenditures, and physical facilities. These data and the indicators derivedfrom them are then used to gauge the capacity and performance of schools in relationto national education goals and plans, and to determine future development policies,plans and management arrangements. Typically, they are inexpensive, as a by-productof the administrative data collection. They usually cover the whole country and areavailable on an annual basis.As in other areas (such as health and social welfare), the data collected throughadministrative channels on education sometimes face shortcomings related to dataquality. Some aspects of quality include coverage, accuracy and timeliness. In thecase of education, in many countries, there is less than universal reporting by schools,so various data points for the non-reporting schools have be estimated. Also, in manycountries, administrative data are only available for schools, teachers and students inthe formal government sector or for private schools that receive significant governmentfunding. Private educational institutions and non-formal educational programmesmanaged by non-governmental organizations and local communities are often notcovered by administrative statistics.Questions also arise as to the reliability of data reported by government and publicschools, particularly when resource allocation from the government is tied to enrolmentand the number of teachers or classrooms. Schools may report higher enrolmentfigures in order to obtain greater resources, producing distortions in the estimates ofstudent enrolments. There is also anecdotal evidence of private schools that underreport income and expenditure in order to derive greater benefits or lower their taxliability.1.2HOUSEHOLD SURVEY AND CENSUSADMINISTRATIVE DATAEDUCATION DATAAS ACOMPLEMENTTOAdministrative data typically provides limited information on the individual characteristicsof pupils (such as age, sex and residence), and little information on the characteristicsof their households. Moreover as school-based surveys and censuses focus onchildren who attend school, there is no information on the individual characteristics andfamily backgrounds of children who do not attend school.Household surveys and censuses provide important education data that can beanalysed according to household and individual characteristics. The availability ofmultiple censuses and surveys conducted over time enables changes to be trackedwithin a given timeframe, assuming consistency in survey questions and methodology.- 10 -
Data from household surveys and censuses can complement the school-based data byproviding information on aspects of children’s background that may influence householdschooling decisions. Censuses and multi-topic household surveys provide considerableinformation on household and individual household member characteristics, includingdata on children’s school participation. These data on children’s school enrollment orschool attendance can then be analysed according to household and childcharacteristics.For example, depending on the survey, the percentages of school-age childrenattending school can be compared by urban-rural residence, household wealth, sex,and other characteristics critical for decision-making. Knowing that 33% of poor ruralgirls of primary school age currently attend school, compared to 57% of wealthy ruralgirls, for example, provides insight into the relationship between household wealth andschool participation.Censuses and household surveys also provide data on adult educational attainmentand often, on self-reported literacy skills. These surveys and censuses can providenational-level sources of data on adult educational attainment and literacy and allowcomparisons by different household characteristics.1.3COMPARING EDUCATION INDICATORS BASED ON ADMINISTRATIVE AND SURVEY DATAAdministrative and household survey data sources measure educational participation indifferent ways. Administrative data are based on school reporting at the beginning ofthe school year, but in some cases it can include reporting at the middle or end of theschool year. Enrolment ratios are based on the numbers of children enrolled in schooland the school-age population estimated from national censuses and/or vital statistics.Ideally, household surveys collect data on enrolment and/or school attendance among arepresentative sample of children. Questions concerning children’s school participationare typically asked of the head of household. The timing of the survey is not related toany point in the school year and may actually even cross two different school years.Estimates of educational participation from these two sources may differ for a number ofreasons. One major factor is that the question asked in the household surveys queryingchildren’s school attendance is different from that answered by school censuses:Attending school is not necessarily the same as being enrolled in school. Children maybe recorded in school enrolment records and yet not actually be attending school.The different rates of participation can also be attributed to the timing of data collectionrelative to the school year. A school census conducted at the beginning of the schoolyear and a household survey collecting data at the end of the school year will likely finddifferent rates of participation since some children will have enrolled in school withoutever actually attending, and other children will have dropped out of school during theschool year.- 11 -
In addition, the accuracy of the population estimate and the completeness of schoollevel data can affect the calculation of participation ratios from administrative data.Similarly, the completeness of the census enumeration and the sample design for thehousehold survey may also affect the accuracy of estimates produced by censuses andsurveys.In short, many factors may contribute to variations in estimates of enrollment andattendance ratios. Further research is needed to explore the reasons for similarities ordifferences between these two different measures of participation.- 12 -
EDUCATION INDICATORS FROM NATIONALPOPULATION CENSUSES AND HOUSEHOLD SURVEYS2.12AN ANALYTICAL FRAMEWORKNational censuses and multiple-topic household surveys collect data on thecharacteristics of both households and individuals within those households. Thischapter looks at education indicators that are commonly derived from data sets or thatcan be constructed using existing variables.Most surveys and censuses collect information on household characteristics, includingthose related to location (such as urban-rural residence or region); householdcomposition and characteristics (household size, sex of the household head and soon.); and socio-economic characteristics (household wealth, dwelling quality and type).Measuring the socioeconomic status of a household is a complex issue. Some surveyscollect detailed data on household income and expenditures which are then used toconstruct distributions of households, for example, to identify the 20% of the populationwith the greatest income and the 20% of the population with the lowest income.However, in most multi-purpose surveys, it is not possible to collect this information. Aproxy used for household socioeconomic status when detailed data are not available iscommonly called a household wealth or assets index. An asset index, for example,proxies socio-economic status by household access to amenities or ownership of items.The composition of an asset index varies by survey, but assets commonly included inthe index are electricity, radio, television, refrigerator, bicycle, motorcycle, car,telephone, number of persons per sleeping room, water source, sanitation facilities, andtype of flooring. Each household asset used in the index is assigned a weightgenerated through an analysis of principal components, which calculates theimportance of each element of the index.Data on individual household members are collected on variables such as sex, age,relationship to the household head, marital status, schooling attainment by level andgrade at that level (and sometimes the highest degree completed). Data are also oftencollected on employment status and other characteristics.For children in the household (usually those under age 15), data are often collected onparental survivorship (whether each child’s mother and father is alive, and whether eachparent lives in the household).Data on current school participation (whether currently attending, and if so, at what leveland grade) are collected for youth. The age ranges for data on education participationvary widely, and may include children of pre-school age, those of primary andsecondary school age, youth and even adults. Some surveys also collect literacy datafor adults and youth using either self-assessment or testing as a baseline. Manysurveys also collect time-use data or labour data (such as unemployed or employed orworking unpaid/paid in kind/paid in cash).- 13 -
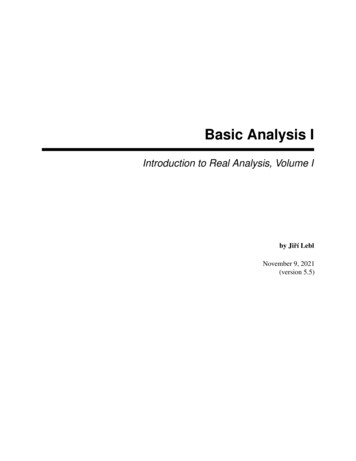
Access to background information on children and their households facilitates dataanalysis by various characteristics and groups. The analytical framework (see Figure 1)illustrates the kinds of data often available from national censuses and householdsurveys, as well as interrelationships between the data First, the geographic context inwhich households are situated is determined: urban or rural areas, villages or towns,districts, and so on. The household is located within that square and is characterised byselected variables (such as, wealth, size, and number of school-age children). Withinthe household, the household members are characterised by age, sex, educationalattainment and literacy, and employment status. The rounded rectangle with thedashed border outlines the schooling status of children (attending school, dropped outof school, and never attended school).This approach provides a framework that can be used to analyse data on children’sschool participation by urban-rural location, region, household wealth, parents’educational attainment, children’s sex and age, and other household and individualcharacteristics. Another way of studying these differences in educational participation isto attribute causation through statistical analysis. This more advanced analysis is notthe topic of this Guide, though a brief overview to statistical analysis is provided inChapter 4.Various education indicators can be calculated based on the data collected in a givensurvey or census. This chapter presents a set of education indicators and explainsbriefly how they are calculated (see Appendix A). The discussion includes indicatorsthat have been established through many years of use in the international educationcommunity and those that are the result of more recent indicator development.Before discussing each indicator in turn, it must be emphasised more broadly thatstatistics and indicators—which are data organised and presented as information—mustbe interpreted before being used to inform policy-making or programme planning.Indicators themselves do not explain anything; rather, they point to achievements orchange (Bottani, 1990). Indicators must be interpreted and placed in different contexts,including the socioeconomic, cultural, and demographic characteristics of thepopulation; educational programmes and reforms underway; the quality of thecurriculum, teachers, school management, school facilities; and so on. In summary,the indicators can be used in conjunction with other available contextual data toanalyse changes in education indicators.- 14 -
Figure 1A framework for analysing education data from household surveys and censusesPlace/Area/Locality of Residence: Urban/Rural Residence Prefecture/Province, Region, District,Department/Subprefecture, Commune, City, Village DepartmentCharacteristics of the HouseholdCharacteristics ofChildrenAge, Sex, Parentalsuvivalship/Orhanstatus, Literacy,Employment/work/labourCharacteristics ofHousehold HeadAge, Sex,Educationalattainment, Literacy,Employment status,Relation to childCharacteristics ofOther HouseholdMembersEducationalattainment andLiteracy of mother,father and ional Participationamong School Age Population Currently Attending Dropped Out of School Never Attended SchoolHousehold Wealth, Number of household members,Number of children, Household age and sexcomposition/structure, Householdexpenditures on schoolingNote: Not all of the indicators listed in the framework will be available in all householdsurveys. This analytical framework is meant to be indicative of the types of informationavailable and suggestive of possible analyses.- 15 -
2.2LITERACYLiteracy generally denotes the ability to read and write and to use written words (in anywritten language) in everyday life. Literacy is one of the intended outcomes ofschooling, as well as a measure of a person’s ability to function in society and tocontinue to learn.Literacy is measured in different ways across national censuses and householdsurveys. A common approach is to ask whether each person within a household canread and write, with understanding, a simple statement about his/her everyday life. Aperson who can do so is considered to be literate; a person who cannot is classified asilliterate. Some surveys classify a person as “semi-illiterate” if he/she can read butcannot write or can read and write only figures or his/her own name; but this category isnot used in international comparisons.Some critics suggest that literacy estimates based on self-reported declarations may notbe reliable since some illiterate persons may be reluctant to admit to their illiteracy. Inaddition, if one household respondent, such as the household head, reports on literacyfor all household membe
has been compiled with the aim of facilitating and promoting education policy analysis and utilisation of education indicators based on household survey and census data. The Guide was first conceived and produced in French by the Research Thematic Network, Family and