Transcription
Cancer CellArticleMetabolic Signatures Uncover Distinct Targetsin Molecular Subsetsof Diffuse Large B Cell LymphomaPilar Caro,1,10 Amar U. Kishan,1,4,10 Erik Norberg,1,5,10 Illana A. Stanley,1,5 Bjoern Chapuy,2 Scott B. Ficarro,1,3,6Klaudia Polak,1 Daniel Tondera,1 John Gounarides,7 Hong Yin,7 Feng Zhou,1,3,6 Michael R. Green,2 Linfeng Chen,2Stefano Monti,8,9 Jarrod A. Marto,1,3,6 Margaret A. Shipp,2 and Nika N. Danial1,5,*1Departmentof Cancer Biologyof Medical Oncology3Blais Proteomics CenterDana-Farber Cancer Institute, Boston, MA 02115, USA4Harvard-MIT Division of Health Sciences and Technology, Cambridge, MA 02139, USA5Department of Cell Biology6Department of Biological Chemistry and Molecular PharmacologyHarvard Medical School, Boston, MA 02115, USA7Novartis Institutes for Biomedical Research, Cambridge, MA 02139, USA8The Broad Institute, Cambridge, MA 02142, USA9Section of Computational Biomedicine, Boston University School of Medicine, Boston, MA 02218, USA10These authors contributed equally to this work*Correspondence: nika .ccr.2012.08.0142DepartmentSUMMARYMolecular signatures have identified several subsets of diffuse large B cell lymphoma (DLBCL) and rationaltargets within the B cell receptor (BCR) signaling axis. The OxPhos-DLBCL subset, which harbors the signature of genes involved in mitochondrial metabolism, is insensitive to inhibition of BCR survival signaling butis functionally undefined. We show that, compared with BCR-DLBCLs, OxPhos-DLBCLs display enhancedmitochondrial energy transduction, greater incorporation of nutrient-derived carbons into the tricarboxylicacid cycle, and increased glutathione levels. Moreover, perturbation of the fatty acid oxidation programand glutathione synthesis proved selectively toxic to this tumor subset. Our analysis provides evidence fordistinct metabolic fingerprints and associated survival mechanisms in DLBCL and may have therapeuticimplications.INTRODUCTIONTumors often rewire their metabolism to ensure a steady supplyof intermediary metabolites for synthesis of new biomass, aswell as generation of ATP and reducing equivalents (Bargerand Plas, 2010; DeBerardinis et al., 2008; Tennant et al., 2010).This metabolic reprogramming is a dynamic process shapedby oncogenes and tumor suppressors (Barger and Plas, 2010;Morrish et al., 2008; Yuneva et al., 2012). One of the first metabolic alterations identified in tumors is elevated glycolysis,even in the presence of sufficient oxygen. This program, alsoknown as the Warburg effect or aerobic glycolysis, fulfills important biosynthetic needs (Barger and Plas, 2010; Koppenol et al.,2011; Vander Heiden et al., 2009). The Warburg effect has oftenbeen interpreted as an indication of impaired mitochondrialrespiration (Koppenol et al., 2011). However, the relevance ofSignificanceB cell receptor (BCR) survival signals are central to pathogenesis of certain DLBCLs. Among transcriptionally definedgroups of DLBCL, the ‘‘OxPhos’’ subset displays increased expression of genes involved in mitochondrial oxidative phosphorylation but lacks an intact BCR signaling network, suggesting dependence on alternative survival mechanisms.However, the functional basis of the OxPhos signature has not been defined. Using an integrative approach, we have carefully dissected the patterns of fuel utilization and energy metabolism in DLBCL, with a primary focus on the ‘‘OxPhos’’subset. We show that fatty acid oxidation and glutathione synthesis are distinct metabolic features of OxPhos-DLBCLsselectively required for their survival. Metabolic signatures may provide important insights into the molecular heterogeneityof DLBCL and reveal rational targets in these lymphomas.Cancer Cell 22, 547–560, October 16, 2012 ª2012 Elsevier Inc. 547
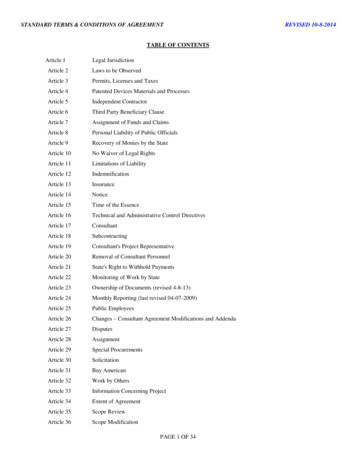
Cancer CellMetabolic Fingerprints in DLBCL Molecular Subsetsmitochondrial respiration in tumors is varied depending on tumortype, and evidence for an oxidative class of tumors and tumorswith dual capacity for glycolytic and oxidative metabolism exists(Marin-Valencia et al., 2012; Moreno-Sánchez et al., 2009).Moreover, the importance of mitochondria in tumor cell survivaland proliferation, including utilization of alternative oxidizablesubstrates such as glutamine and fatty acids, has been increasingly appreciated (Le et al., 2012; Rossignol et al., 2004; Zaugget al., 2011). The diversity of carbon substrate utilization pathways in tumors is indicative of metabolic heterogeneity thatmay not only be relevant across different types of cancer butalso manifest within a group of tumors that otherwise sharea common diagnosis.Diffuse large B cell lymphomas (DLBCLs) are a geneticallyheterogeneous group of tumors and the most common nonHodgkin’s lymphomas in adults (Abramson and Shipp, 2005;Lenz and Staudt, 2010). However, the spectrum of fuel utilizationpathways and the metabolic fingerprints within DLBCL andother similarly heterogeneous groups of tumors have not beenfully elucidated. To date, efforts to capture the molecular heterogeneity of DLBCL have relied on gene expression profiling thathas uncovered coordinate signaling and survival paradigms indistinct subsets of DLBCL. In one approach, comparison of thegenetic signatures across DLBCLs using genome-wide arraysand multiple clustering algorithms captured tumor-intrinsicdistinctions in three separate and reproducible clusters (Montiet al., 2005). Groups of DLBCLs identified by this consensuscluster classification (CCC) scheme are the B cell receptor(BCR)/proliferation cluster (BCR-DLBCL) displaying upregulation of genes encoding BCR signaling components, theOxPhos cluster (OxPhos-DLBCL), which is significantly enrichedin genes involved in mitochondrial oxidative phosphorylation(OxPhos), and the host response (HR) tumors largely characterized by a brisk host inflammatory infiltrate (Monti et al., 2005).Another classification framework known as cell of origin (COO)delineated DLBCL subsets that shared components of theirtranscriptional profiles with normal B cell subtypes, includinggerminal center B cell (GCB)-like and activated B cell (ABC)like (Alizadeh et al., 2000), and a third undefined category,designated ‘‘type 3’’ (Wright et al., 2003). CCC and COOclassifications capture largely different molecular aspects ofDLBCL (Monti et al., 2005).Unlike tumors that rely on signaling pathways downstream ofthe BCR, OxPhos-DLBCLs do not display active/functionalBCR signaling (Chen et al., 2008). However, the nature of survivalpathways in this group of tumors is not known, and beyondthe original CCC assignment, the actual functional attributes ofthe OxPhos molecular signature have not been fully examined.This signature includes multiple subunits of mitochondrialrespiratory chain complexes I (NADH dehydrogenase) and V(mitochondrial ATP synthase) that may suggest alterations inmitochondrial energy transduction. However, given the integrative aspect of cellular metabolism and the requirementof both nuclear and mitochondria-encoded genes for properfunctioning of the electron transport machinery, the precisemetabolic landscape of this molecular subset could not bepredicted.In the present study, we conducted an integrative analysis todissect the metabolic fingerprints of DLBCL and to delineate548 Cancer Cell 22, 547–560, October 16, 2012 ª2012 Elsevier Inc.subtype-specific differences that may selectively contribute tothe growth and survival of DLBCL subsets.RESULTSSubtype-Specific Differences in the DLBCLMitochondrial ProteomeThe upregulation of select genes encoding for subunits ofelectron transport chain (ETC) complexes in OxPhos-DLBCLspredicts potential differences in mitochondrial oxidative metabolism compared with other DLBCL groups. However, as ETCactivity is linked to the supply of carbon substrates and reducingequivalents, the OxPhos signature is likely part of a broaderspectrum of changes in mitochondrial nutrient metabolism thatmay shed light on the actual functional attributes of an ‘‘OxPhos’’program in this DLBCL subset. To search for additional components of this metabolic program, we initially performedtwo-dimensional differential gel electrophoresis (2D-DIGE) tocompare the proteome of mitochondria purified from representative OxPhos- and BCR-DLBCL cell lines Karpas 422 andOCI-Ly1, respectively (Chen et al., 2008). Mitochondrial proteinsthat were R2.5 times more abundant in the OxPhos cell line wereidentified by mass spectrometry (Figure S1A available online).Among 2D-DIGE candidates were subunits of mitochondrialrespiratory chain complex I (NADH dehydrogenase), complex II(succinate dehydrogenase, also a tricarboxylic acid [TCA] cycleenzyme), complex V (ATP synthase), subunits of the pyruvatedehydrogenase (PDH) complex and several other TCA cycleenzymes, mitochondrial reactive oxygen species (ROS) detoxification enzyme manganese superoxide dismutase (MnSOD orSOD2), and enzymes involved in mitochondrial b-oxidation offatty acids and metabolism of ketone bodies and amino acids(Figure S1A).We next set out to interrogate the mitochondrial proteinsignature defined by 2D-DIGE in a larger panel of OxPhosand BCR-DLBCL cell lines. This required an independent proteomics approach amenable to multiplexing—isobaric tags forrelative and absolute quantification (iTRAQ) (Figure S1B) (Choeet al., 2007; Ross et al., 2004)—for simultaneous quantitativecomparison of multiple unique tryptic peptides per candidatemitochondrial protein across three pairs of OxPhos- and BCRDLBCL cell lines. This analysis confirmed significant quantitativeenrichment of mitochondrial b-oxidation enzymes and multiplesubunits of respiratory chain complexes, as well as TCA cycleenzymes and MnSOD in OxPhos-DLBCL mitochondria (Figure 1;Table S1).Beyond confirming the differential expression of complex Iand V components that were in the original OxPhos-DLBCLcluster signature (Monti et al., 2005), the 2D-DIGE and iTRAQproteomic analyses identified additional components of theOxPhos-DLBCL mitochondrial signature that were not fullycaptured by the previous RNA profile analysis of total tumors.To examine whether these observations could also be substantiated in primary OxPhos-DLBCLs, we examined tumor biopsiesfor differences in the abundance of these newly identifiedcomponents of the mitochondrial signature at both protein andRNA levels. The small en bloc primary DLBCL biopsies precluded isolation of tumor mitochondria; however, iTRAQ-basedquantification in a limited number of primary cases that
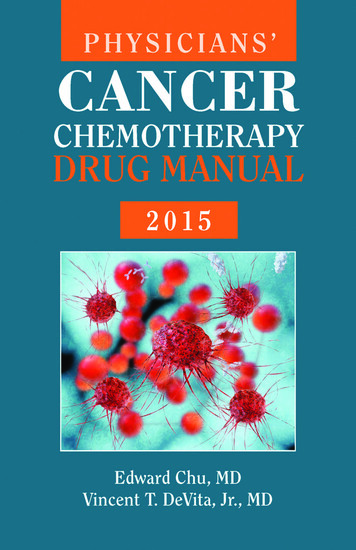
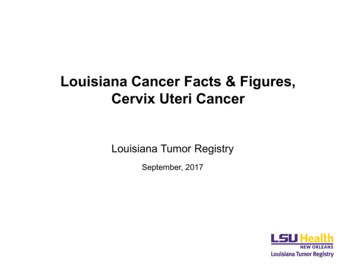
Cancer CellMetabolic Fingerprints in DLBCL Molecular SubsetsA0.81 ACADVL2 ACAT13 AK24 ALDH18A15 ALDH1B16 ALDH27 ALDH5A18 ATP5A19 ATP5B10 ATP5C111 ATP5H12 ATP5I13 ATP5J14 ATP5L15 ATP5O16 CPT217 ECHS118 ETFA19 ETFB20 HADHA21 HADHB0.6log Ratio OxPhos/BCR0.40.20.0-0.2-0.4-0.622 IDH223 IDH3A24 NDUFA525 NDUFA826 NDUFA927 NDUFAF228 NDUFS129 NDUFS230 NDUFS331 NDUFV132 NDUFV233 NDUFV334 OAT35 OGDH36 OXCT137 PDHB38 SDHA39 SDHB40 SHMT241 SOD242 VDAC3BTCA CyclePyruvate dehydrogenase (PDH) BIsocitrate dehydrogenase (IDH) 2 (NADP )Isocitrate dehydrogenase (IDH) 3A (NAD )α-Ketoglutarate dehydrogenase (OGDH)Succinate dehydrogenase (SDH) subunits A and BElectron Transport and OxPhos ApparatusComplex I, α subcomplex subunits (NDUFA) 5, 8, 9Complex I, α subcomplex assembly factor (NDUFAF) 2Complex I, Fe-S protein (NDUFS) 1, 2, 3Complex I, flavoprotein (NDUFV) 1, 2, 3ATP synthase (ATP5) F1 complex subunitsATP synthase (ATP5) F0 complex subunitsβ-OxidationAcyl-CoA dehydrogenase (ACAD) VLCarnitine palmitoyltransferease (CPT) 2Enoyl-CoA hydratase, short chain (ECHS) 1Electron-transfer-flavoprotein (ETF) A and BHydroxyacyl-CoA dehydrogenase (HADH) A and BKetone Body Metabolism-0.82.53.03.54.04.55.05.56.03-oxoacid CoA transferase (OXCT1) 1Mitochondrial acetoacetyl-CoA thiolase (ACAT1)6.5Amino Acid and One Carbon MetabolismMitochondrial aldehyde dehydrogenase (ALDH) 2Aldehyde dehydrogenase (ALDH) 1B1Succinate semialdehyde dehydrogenase (ALDH5A1)Pyrroline-5-carboxylate synthetase (ALDH18A1)Mitochondrial serine hydroxymethyltransferase (SHMT2)Ornithine aminotransferase (OAT)log Reporter Ion SignalROS DetoxificationManganese Superoxide dismutase (SOD2)Figure 1. Comparison of Mitochondrial Proteome in OxPhos- and BCR-DLBCLs(A and B) Multiplex iTRAQ analysis of mitochondria derived from three OxPhos- (Karpas 422, Toledo, and Pfeiffer) and three BCR- (OCI-Ly1, SU-DHL-4, and SUDHL-6) DLBCL cell lines. Log-log plots of reporter ion abundance ratios versus reporter ion intensities for proteins detected in replicate nanoflow LC-MS/MSanalyses are shown in (A). Proteins within the mitochondrial signature that are enriched in OxPhos-DLBCLs are shown as red circles in (A) and grouped permetabolic pathway in (B). Red lines in (A) represent global thresholds based on a 1.5-fold change between OxPhos and BCR subtypes.See also Figure S1 and Table S1.produced protein samples of suitable purity and grade for liquidchromatography/tandem mass spectrometry (LC-MS/MS)indicated increased expression of several TCA cycle and mitochondrial b-oxidation enzymes, as well as MnSOD (Table S1).The RNA abundance for candidate components of the mitochondrial proteome signature was also queried in two extensiveprimary DLBCL expression profile data sets (Lenz et al., 2008;Monti et al., 2005) with CCC designations (Tables S2 and S3)and found to be significantly higher in primary OxPhos- than inBCR-DLBCLs in both data sets (Figure 2). These observationsconfirm that the differences in mitochondrial signature identifiedin DLBCL cell lines translate to primary tumor biopsies.The functional categories of proteins in the OxPhos-DLBCLmitochondrial signature predict differences in mitochondrialhandling of fatty acids and pyruvate, ETC activity, mitochondrialenergy production, and ROS content. We next set out to validateeach of these predictions.Mitochondrial Substrate Oxidation in DLBCL SubsetsTo assess potential differences in mitochondrial carbonsubstrate utilization, mitochondrial oxygen consumption rate(OCR) was measured in real time in the absence or presenceof exogenously added substrates such as glucose, glutamine,and palmitate, using a panel of 3–4 independent OxPhos and‘‘non-OxPhos’’ DLBCL cell lines. The non-OxPhos panelincluded cell lines with known CCC assignment as BCR-DLBCLs(Polo et al., 2007) and COO classification as GCB-, ABC-, orType 3-DLBCLs (Alizadeh et al., 2000; Wright et al., 2003)(see Supplemental Experimental Procedures). Basal OCR inresponse to exogenously supplied palmitate was significantlyhigher in OxPhos-DLBCLs relative to non-OxPhos DLBCL celllines (no substrate [NS] versus palmitate; Figure 3A). BasalOCR values per individual DLBCL cell line are shown in Figure S2A. The non-OxPhos DLBCLs displayed either no increasein OCR or an increase that was significantly less than thatobserved in the OxPhos-DLBCLs (Figures 3A and S2A). Notably,the majority of palmitate-stimulated OCR in OxPhos-DLBCLswas sensitive to the mitochondrial ATP synthase inhibitoroligomycin, indicating that mitochondrial fatty acid oxidation(FAO) in this setting is associated with ATP synthesis (Figures3A and S2A). These observations provide quantitative evidence for increased mitochondrial FAO in OxPhos-DLBCLs.Analysis of other oxidizable substrates showed that none ofthe DLBCL subsets respire on glucose (NS vs. glucose; Figures3A and S2A). However, in response to glutamine, all DLBCLsubsets exhibited a comparable increase in basal and ATPassociated (oligomycin-inhibitable) OCR (NS versus glutamine;Figures 3A and S2A). Taken together, comparison of the threecarbon substrates across and within DLBCL subsets indicatesthat palmitate is a predominant respiratory fuel in OxPhosDLBCLs.A marked increase in palmitate-induced OCR in OxPhosDLBCL compared with non-OxPhos DLBCL cell lines parallelsthe absence or presence of functional BCR signaling in theseCancer Cell 22, 547–560, October 16, 2012 ª2012 Elsevier Inc. 549
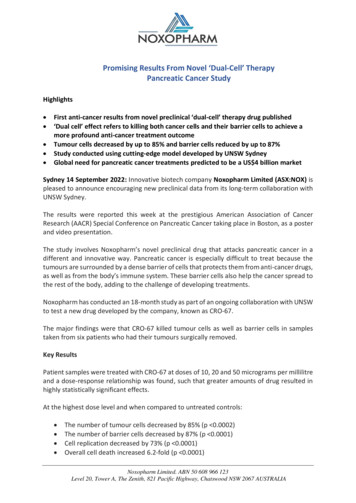
Cancer CellMetabolic Fingerprints in DLBCL Molecular SubsetsAOxPhos (n 71)BCR (n 64)OxPhos (n 56)211023 at201304 at201740 at205412 at201931 at201761 at216841 s atBPDHBNDUFA5NDUFS3ACAT1ETFAMTHFD2SOD2PDHB (211023 at)800p 0.0001FDR 0.0002NDUFA5 (201304 at)400p 0.0001FDR 0.0002800600300600400200400p 0.0001FDR 0.00021000p 0.0001FDR 0.0002Transcript Abundance0OxPhos2000BCRp 0.0022FDR 0.00282000OxPhos2000BCRp 0.0001FDR CRBCR0OxPhosBCRSOD2 (216841 s at)3001000200200500100p 0.0001FDR 0.000200OxPhos1500OxPhosBCRp 0.0074FDR 0.00832000p 0.0001FDR 0.0002BCRp 0.0001FDR 0.000200OxPhos3000BCRp 0.0004FDR 0.0006OxPhos1500BCRp 0.0001FDR 0.000215002000100010005001000500OxPhosp 0.0004FDR 0.000640010000MTHFD2 (201761 at)20001500p 0.0001FDR 0.0002800400100ETFA (201931 T1 (205412 at)NDUFS3 (201740 at)BCR (n 83)211023 at201304 at201740 at205412 at201931 at201761 at216841 s osBCRFigure 2. Increased Abundance of Transcripts Encoding Mitochondrial Proteins in Primary DLBCL Tumor Biopsies(A) Heat map representation of the relative mRNA levels of genes corresponding to the components of the mitochondrial proteome signature using the Monti et al.(left) and Lenz et al. (right) expression array data sets of primary DLBCL cases with OxPhos and BCR consensus cluster assignments.(B) Transcript abundance (probe intensity) of the indicated genes in primary OxPhos- and BCR-DLBCLs from the Monti et al. (top) and Lenz et al. (bottom) datasets. Differential expression was determined by a two-sided Mann-Whitney test and p values were corrected for multiple hypothesis testing using the falsediscovery rate (FDR) procedure.NDUFA5, NADH dehydrogenase (ubiquinone) 1a subcomplex subunit 5; NDUFS3, NADH dehydrogenase (ubiquinone) Fe-S protein 3; ETFA, electron-transferflavoprotein A; ACAT1, acetoacetyl-CoA thiolase 1; MTHFD2, methylenetetrahydrofolate dehydrogenase 2; SOD2, manganese superoxide dismutase.See also Tables S2 and S3.subsets, respectively (Chen et al., 2008). This prompted examination of a potential reciprocal relationship between activeBCR signaling and mitochondrial FAO. Such a scenario wouldpredict that inhibition of BCR signaling in non-OxPhos/BCRDLBCLs may manifest in increased mitochondrial FAO. Indeed,acute interference with BCR signaling using multiple independent shRNAs against SYK, an upstream component of thissignaling axis, was associated with significant elevation ofbasal palmitate-induced OCR (Figure 3B). Notably, OCR measurements were taken after 24 hr treatment with shRNAs, whichenabled sufficient depletion of SYK (Figure S2B) withoutaffecting cell viability (data not shown). These observations aresuggestive of an underlying metabolic plasticity that governsthe pattern of fuel oxidation in DLBCL subsets.To provide independent and parallel evidence for differentialutilization of fatty acids in DLBCL subsets, a targeted 13C isotopomer approach was undertaken. A total of eight cell lineswith known designation as OxPhos or BCR were cultured inmedia containing uniformly labeled 13C-palmitate (U13C-palmitate), and 13C enrichment was assessed in a defined set ofintermediates derived from fatty acid metabolism. The completeoxidation of 13C-palmitate by mitochondria yields eight acetylunits that can donate carbons to the TCA cycle in the formof citrate labeled on two carbons (13C2-citrate), which can, inturn, lead to the formation of 13C2-a-ketoglutarate that is in550 Cancer Cell 22, 547–560, October 16, 2012 ª2012 Elsevier Inc.isotopic equilibrium with 13C2-glutamate (Figure 4A). The relativelevel of 13C enrichment in both 13C2-citrate and 13C2-glutamatewas significantly higher in the OxPhos-DLBCL cell lines (Figure 4B). This is consistent with greater entry of palmitate carbonsinto the TCA cycle.In addition to oxidative metabolism for energy production,palmitate may have important biosynthetic roles, includingdirect incorporation into phosphatidyl choline (PC) to yieldU13C-Palmitate-PC (Figure 4A). Alternatively, palmitate-derivedcitrate can be exported from mitochondria and its carbonssubsequently incorporated into the head group of PC(13C2-acetyl-PC; Figure 4A). In both DLBCL subtypes, directincorporation of palmitate into PC (U13C-palmitate-PC) wasobserved. In addition, a larger enrichment of palmitate carbons in 13C2-acetyl-PC was detected in OxPhos cell lines(Figure 4B).A preferential increase in palmitate utilization in OxPhosDLBCLs prompted examination of its effect on proliferationin these cells. Supplementation of serum-free media containing amino acids with palmitate and carnitine led to amodest but significant and selective increase in the proliferation of OxPhos-DLBCLs (Figure 4C). In the absence ofpalmitate, carnitine, which is required for mitochondrial importof long-chain fatty acids, did not influence proliferation(Figure 4C).
Cancer CellMetabolic Fingerprints in DLBCL Molecular SubsetsOxPhosABCRKarpas 422SU-DHL-6Pfeiffer******ATP-Coupled OCR(pmoles O2 / **800700600500400********300200100BNlm SiG tatelG ucolu setaminePaNlm SiG tatelG ucolu setaminePaNlm SitaG telG ucolu setaminePaNlm SiG tatelG ucolu setaminePaPaPaNlm SitaG telG ucolu setamine0Nlm SiG tatelG ucolu setamineBasal OCR(pmoles O2 / min)1000900800700600ABCOCI-Ly1OCI-Ly7Type 31100OCI-Ly3SU-DHL-4GCBnon-ABCOCI-Ly4***ABCsh Ctrlsh SYK #1sh SYK #3sh SYK #4******Basal OCR(pmoles O2 / min)non-ABCsh Ctrlsh SYK #1sh SYK #3sh SYK *OCI-Ly7******U2932Figure 3. Mitochondrial Carbon Substrate Oxidation in DLBCL Subsets and Its Regulation by BCR Signaling(A) Basal (left) and ATP-coupled (right) OCR in DLBCL subsets. OCR values shown are the average of all cell lines per DLBCL subtype indicated on top. For eachcell line, 7–13 independent OCR measurements were taken. NS, no substrate added exogenously.(B) Palmitate-stimulated basal OCR in non-OxPhos DLBCL cell lines after acute knockdown of SYK.Error bars, SEM. *p 0.05; **p 0.01; ***p 0.001; two-tailed Student’s t test.See also Figure S2.To probe the prosurvival benefit of mitochondrial FAOin DLBCL subsets, this program was inhibited using 4-bromocrotonic acid (BrCA), which irreversibly inhibits mitochondrialb-oxidation of both long- and short-chain fatty acids (el-Aleemand Schulz, 1987). Acute treatment of DLBCL cell lines (4 hr)with BrCA interfered with palmitate stimulation of basal OCRin OxPhos-DLBCL cell lines (Figure S3), while longer treatment(24 hr) was selectively toxic to this subset compared withBCR-DLBCLs (Figure 4D). These results suggest that themitochondrial FAO program provides prosurvival benefits toOxPhos-DLBCLs.Programmatic Regulation of FAO and Its Relevanceto OxPhos-DLBCL SurvivalThe concomitant increase in the abundance of several mitochondrial FAO enzymes in OxPhos-DLBCLs is consistent, atleast in part, with a programmatic increase in the transcriptionalregulation of this pathway. These observations warrantedsystematic interrogation of the primary DLBCL transcript datasets for the prevalence of a defined list of transcriptional regulators of this pathway. Nuclear receptor peroxisome proliferator-activated receptor (PPAR) g transcripts were found tobe significantly more abundant in primary OxPhos-DLBCLs intwo independent cohorts of DLBCL tumors (Figure S4A). Thisis consistent with the observation that several enzymes identified in the mitochondrial protein signature of OxPhos-DLBCLssuch as ETF, ACAD, and HADH, as well as multiple subunits ofmitochondrial respiratory chain complexes I, II, and ATP synthase, are downstream targets of PPARg (Hsiao et al., 2011).To probe the functional relevance of PPARg in DLBCL subsets,we tested the effect of its depletion using three independentsiRNAs and their corresponding mixture (Figures 5A and S4B).Cancer Cell 22, 547–560, October 16, 2012 ª2012 Elsevier Inc. 551
Cancer CellMetabolic Fingerprints in DLBCL Molecular SubsetsABU C-Palmitate-PC1313C2-Glutamate NADHTCACYCLE13Relative 13C EnrichmentNADHNAD C2-αketoglutarateNAD NADHFADH2FADCCtrlCarnitineCarnitine PalmitateProliferation over 24 hr% Edu Positive Cells100OxPhos80**60C2-αketoglutarate 20.5100***CtrlCarnitineCarnitine HL-4SDU-HL-6y7y1I-LOCI-LOC*** *** *** ***100% SurvivalAnnexin V and PI s 422PC13C2-Acetyl-PC13Relative 13C OxPhosCtrlBrCA 7.5 μMBCRCtrlBrCA 7.5 μM4020022s4aarpK4-LyIOCriffePfeToledoSUDHL-4 HL-6 -Ly1y7I-L-D OCIOCSUFigure 4. Palmitate Metabolism and Its Effect on DLBCL Proliferation and Survival(A and B) 13C isotopomer analysis of uniformly labeled palmitate (U13C-Palmitate). (A) Schematics depicting the number of carbons labeled (filled circles) ina defined set of metabolites derived from palmitate. Metabolites marked in red are selectively elevated in OxPhos-DLBCL cell lines in (B). (B) 13C enrichment inpalmitate-derived metabolites. For each metabolite, cumulative data obtained from all four OxPhos-DLBCL cell lines are shown relative to the mean value of thatmetabolite in all four BCR-DLBCL cell lines listed on top.552 Cancer Cell 22, 547–560, October 16, 2012 ª2012 Elsevier Inc.
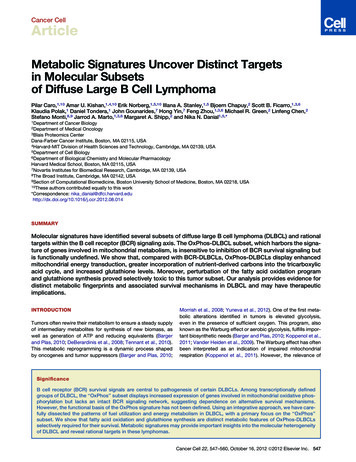
Cancer CellMetabolic Fingerprints in DLBCL Molecular SubsetsAFigure 5. Programmatic Regulation of FAOand Its Relevance to DLBCL Survival(A) Effect of siRNA-mediated depletion of PPARgon the survival of DLBCL subsets.(B) Survival of the indicated DLBCL cell linescultured in the absence or presence of increasingconcentrations of T0070907 for 96 hr.Error bars, SEM. **p 0.01; ***p 0.001; twotailed Student’s t test.See also Figure S4.BThe most robust decrease in PPARg protein levels was achievedusing the siRNA mix (Figure S4C) and was accompanied bysignificant apoptosis in OxPhos-DLBCLs compared with theBCR subset (Figure 5A).To provide a pharmacologic correlate to these findings, wealso tested the effect of two selective PPARg antagonistsT0070907 and GW9662 (Lee et al., 2002; Leesnitzer et al.,2002). Short-term treatment of DLBCL cell lines with thesecompounds blocked palmitate stimulation of OCR (data notshown). Upon longer incubation periods (96 hr), these compounds proved selectively toxic to OxPhos-DLBCLs (Figures5B and S4D). The aforementioned genetic and pharmacologicapproaches to PPARg inhibition complement and extend theresults shown in Figure 4D that pharmacologic inhibition ofmitochondrial b-oxidation program is toxic to OxPhos-DLBCLsand are collectively congruent with the idea that a sustainedmitochondrial FAO program may be relevant for the survival ofOxPhos-DLBCLs.Differential Utilization of GlucoseDerived Carbonsin DLBCL SubsetsIdentification of PDH as a componentof the mitochondrial proteome signaturein OxPhos-DLBCLs predicts differentialmitochondrial handling of pyruvate.Indeed, biochemical analysis of isolatedmitochondria derived from a panel ofDLBCL cell lines indicated significantincrease in PDH enzyme activity inOxPhos-DLBCLs (Figure 6A). IncreasedPDH activity would further predictdiminished availability of glucose-derivedpyruvate for lactate synthesis. Biochemical quantification of glucose-derivedlactate secreted by OxPhos-DLBCL celllines compared to non-OxPhos/BCRcounterparts indicated that this isindeed the case (Figure 6A). These observations prompted a more detailedexamination of the fate of glucosecarbons in DLBCL subsets.Beyond generation of pyruvate, glucose-derived metabolitesare central to several biosynthetic pathways (Figure 6B). Forexample, glucose-6-phosphate can enter the pentose phosphate pathway to yield ribose sugars for nucleic acid synthesisand NADPH generation for lipid synthesis and ROS detoxification (Tennant et al., 2010; Vander Heiden et al., 2009).Dihydroxyacetone phosphate, which is in equilibrium withglyceraldehyde-3-phosphate, is used in glycerol synthesis,providing a necessary backbone for membrane phospholipids.Finally, glucose-derived citrate and aspartate, a surrogate foroxaloacetate (OAA), can be used in lipid and nucleotide synthesis, respectively. To examine differences in the terminal fateof glucose-derived pyruvate and the branch points at whichglucose carbons divert to biosynthetic pathways in differentDLBCL subsets, we carried out a targeted 13C isotopomer analysis using uniformly labeled 13C-glucose (U13C-glucose).Glucose uptake was comparable in DLBCL cell lines asevident from the similar levels of remaining U13C-glucose in the(C) Effect of palmitate supplementation on the proliferation of DLBCL cell lines. Control denotes serum-free media containing all amino acids except L-glutamine.(D) Survival of DLBCL subsets cultured in the absence or presence of BrCA for 24 hr.Error bars, SEM. *p 0.05; **p 0.01; ***p 0.001; two-tailed Student’s t test.See also Figure S3.Cancer Cell 22, 547–560, October 16, 2012 ª2012 Elsevier Inc. 553
Cancer CellMetabolic Fingerprints in DLBCL Molecular SubsetsABOxPhosKarpas C13PCC-Acetyl-PCHBL-1U13C-Glucose-6-Phosphate C2-CitrateC3-Pyruvate0.50Lactate (nmoles)25MITOCHONDRIONPDH Activity 2015**PDH13C2-Aspartate 0135C2-αketoglutarate0Relative 13C EnrichmentCU13C-Glucosein Media1.5U13C-Glucose-6-Phosphate2.0Relative 13C 3C2-Acetyl-PC1313C2-αketoglutarate1.51.51.5
Stefano Monti,8 ,9 Jarrod A. Marto,1 3 6 Margaret A. Shipp,2 and Nika N. Danial1 ,5 * 1Department of Cancer Biology 2Department of Medical Oncology 3Blais Proteomics Center Dana-Farber Cancer Institute, Boston, MA 02115, USA 4Harvard-MIT Division of Health Sciences and Technology, Cambridge, MA 02139, USA 5Department of Cell Biology