Transcription
View metadata, citation and similar papers at core.ac.ukbrought to you byCOREprovided by AIS Electronic Library (AISeL)GDSS To Optimize DERs’ PlacementGeographic Decision Support Systems ToOptimize The Placement Of DistributedEnergy ResourcesEmergent Research Forum papersVivian SultanClaremont Graduate universityVivian.Sultan@cgu.eduHind BitarClaremont Graduate universityHind.Bitar@cgu.eduAbstractThe United States electric utility industry is moving toward a new power grid that will accommodate bidirectional energy flow and the incorporation of Distributed Energy Resources (DERs). Currently, utilitycompanies lack tools to identify locations on the electric grid that can sustain DERs’ adoption. Thisresearch explores the use of Geographic Information Systems (GIS), a class of tools for developing spatialmodels, with the aim of optimizing the placement of DERs. The intent of this research paper is to proposea Geographic Decision Support Systems (GDSS) model as a solution for the utility industry to assist in theDERs’ portfolio choices and provide actionable information for utilities, system operators, and powerproducers. Claremont city has been chosen as the research site to demonstrate the applicability of theproposed model. This will also serve as the basis for future research.KeywordsGDSS, new power grid, smart grid, DERsIntroductionAmerica’s paradigm of one-way electric power generation and distribution is no longer sustainable(Department of Energy, 2015a; Department of Energy, 2015d, p.54). The electric distribution systemcannot meet the demand for cleaner power and more customer control of energy bills. Additionally, theexisting one-way power grid cannot accommodate the growth in the penetration of Distributed EnergyResources (DERs) such as solar rooftops (Gergen, Campopiano & Meyer, 2014). In 2014, the CaliforniaPublic Utilities Commission (CPUC), which is the state regulatory body responsible for electric utilities,asked for DERs integration into the electric distribution system. Later, in 2015, the CPUC issued aDistribution Resources Plan (DRP) ruling to change the current electric distribution system into a newsystem that accepts two-way energy flow between customers and their respective utility companies. Thetwo-way grid allows customer involvement and their choice of new technologies for power generation,transmission, and consumption (California Public Utility Commission, 2015a; Gergen et al, 2014).Despite the availability of new technologies for solar, wind, and hydro energy generation, along with othergreat improvements in the electric utility industry, the electric transmission and distribution systems haveremained largely unchanged (Department of Energy, 2015b). The key question is how utility companiescan match supply and demand across the power grid, especially since the electric grid’s bi-directionaltraffic congestion is growing rapidly. According to United States Department of Energy assessments, asuperior system for matching supply and demand is necessary (Department of Energy, 2015d).
GDSS To Optimize DERs’ PlacementAs stated in the “Analytic Research Foundations for the Next-Generation Electric Grid” 2015 report, thereare many important characteristics that the next-generation electric grid system has to implement toimprove the current grid system. Some of the features are combining generation and storage, involvingcustomers, allowing DERs’ adoption, and improving power quality. The report’s producers developed amathematical model that could be implemented in an effort to design, monitor, analyze, and control thenext-generation electric grid system. The authors argued that this mathematical model could be used in aDecision Support tool to determine the emerging problems and instantaneously calculate correctiveactions, which are extremely difficult tasks based on today’s current system capabilities. The proposedmodel in the report aimed at ensuring optimal operation and robustness of the grid. Physics andengineering theories were the backbone of this model.In the aforementioned report, GIS was only used as a display tool that showed the transmission grid,electricity interconnections, electric load, and the geomagnetically induced currents (GICs). We arguethat, in addition to visualization, GIS is an extremely powerful tool that can be used for decision support,planning, and predictive modeling especially as utility companies are in the process of integrating DERsinto the grid. Being able to build a custom GDSS solution that incorporate the mathematical model in theabove report will enable these capabilities to meet utilities’ specific geo-processing needs.The U.S. Department of Energy Office of Science is calling for researchers to assist the utility industry inits transition to a 21st century grid. In response to the call, our paper addresses this research question:“How can GIS be employed to optimize the placement of DERs?” In this research paper, we develop aGDSS model for the utility industry to aid in DERs portfolio choices and provide actionable informationfor utilities, system operators, and power producers. The intended audiences for this research are utilitycorporations, state-level decision-makers, and other stakeholders who are concerned about the future ofthe United States electric power system.Background and FoundationThe United States’ power grid is incapable of integrating DERs due to the lack of energy storage meansand its inefficiency for transporting excess energy (Department of Energy, 2015a; Department of Energy,2015d, p.54). The current electric power paradigm cannot deal with the fluctuation in energy supply anddemand appropriately. Americans pay high electricity bills as utility companies procure energy fromexpensive sources in order to meet peak demand for excessive-energy-consuming communities (UnitedStates Department of Energy, 2015b; Investopedia, 2015).The utility industry aims to transform the network topology to a smart grid that accommodates variousDERs types. The smart grid can be defined as a new class of technology, which uses computer-basedremote automation to bring the electricity delivery system into the 21st century (The Department ofEnergy, 2015). Advanced electrical network technology permits the two-way energy flow betweensuppliers and consumers. Improvement of power quality, customer participation in distributed energygeneration, optimization of energy resources, and electricity cost reduction are among the key benefits ofthis new grid (Department of Energy, 2015f). The new grid must be robust, flexible, and responsive to theintegration of DERs and must accommodate additional customers’ low energy generation resources. TheElectric Power Research Institute estimates that 338– 476 billion will be invested in DERs, intelligentgrid technologies, advanced electrical network systems, and applications for the utilities’ new grid in thenext twenty years (Department of Energy, 2015d, p.55). Tools for optimizing grid operations and thosethat can predict future problems are vital within the modern grid design. Forecasting tools to balance thesupply and demand of electric power are essential for the utility industry to resolve the potential bidirectional grid traffic congestion.According to the U.S. Department of Energy Quadrennial Technology Review (2015e), energy-relatedresearch is essential to help create a resilient, economically efficient, secure, and environmentallyresponsible energy system. The research community must seize this opportunity and collaborate withenergy officials if a revolution in the United States electric power system is underway (Department ofEnergy, 2015e). In the next section, GIS, its applications in utilities, and its use for predictive modeling inother industry sectors are examined. The intent of that section is to prove the suitability of GIS to2
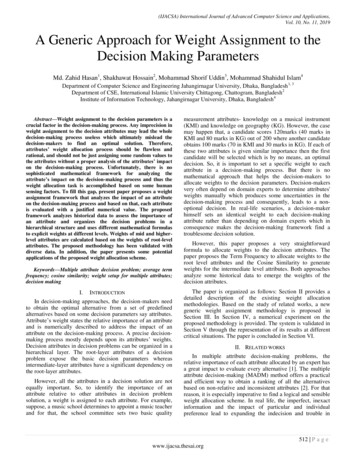
GDSS To Optimize DERs’ Placementoptimize the placement of DERs. Then, we develop a GDSS model. Claremont city has been chosen as theresearch site to demonstrate the applicability of the proposed GDSS model.Literature ReviewGIS Application in UtilitiesThe finding from the National Electric Transmission Congestion research project is the primary resourcehighlighting the congestion problem. This study provides an overview of the congestion issue across theUnited States and the use of GIS to provide analysis. However, the findings were inconclusive regardingresolutions or recommendations (U.S. Department of Energy, 2015c). Many GIS-based maps andresources are available, for example, the Renewable Auction Mechanism (RAM) Program Map, SouthernCalifornia Edison (SCE) Distributed Energy Resource Interconnection Map (DERiM), and San Diego Gasand Electric’s Interconnection Information Map. SCE relies on Cooper Power Systems’ modeling softwareto execute the integrated capacity analysis and utilizes GIS maps, DERiM, to present their congestionstudy results. The reason for which SCE developed DERiM in July of 2015 was to primarily connect thecompany with DERs’ developers and presents the results of their capacity analyses (Southern CaliforniaEdison, 2015).GIS for Predictive ModelingPredictive modeling is a process for determining a mathematical correlation between two or morevariables (Dickey, 2012). Future dependent variables can be estimated and derived if their relationships toindependent variables are understood. Predictive modeling has become a useful aspect of GIS due to itsapplication in public health (Idowu, A., Okoronkwo, N., & Adagunodo, R., 2009) and public work assetmanagement (Totman, 2013). GIS has been employed to improve public works predictive modelingprocedures in the area of maintenance and asset management. GIS can be used in practically any field,and is only limited by the availability of geospatial data.Model DesignThis study proposes a GDSS solution to assist in DERs portfolio choices and provide actionableinformation for utilities, system operators, and power producers. The goal is to optimize the placement ofDERs considering the electric circuit capacity constraints, the households’ solar rooftops potentialelectricity output, and the projection of households’ profiles adopting DERs.Input data is the households’ demographics, SCE parcel map that includes power electric lines and thepotential solar energy with the capacity in kilowatts for a specific area in Los Angeles County, USA. Basedon the input data, the following three sub-models are created as shown in Figure 1:1. A predictive analysis model based on households’ demographics data to yield a projection ofhouseholds’ profiles adopting DERs. Utilizing logistic regression, a model has been designed inMicrosoft Azure machine learning with the following key variables: Dependent variable: Customer’s adoption of the solar rooftop, where the model output iseither “yes” to the solar rooftop adoption or no (Y/N). Independent variables: such as the solar system cost saving, solar system value, electricityusage, customer’s demographics and expenditure data.2. A model to calculate households’ solar rooftops electricity output based on LA County solarrooftops’ rankings. According to the Photovoltaic software (2016), the key elements to computethe energy resource are the total solar panel area, the solar panel yield, and the performance ratio,which is the coefficient for losses.3. A model to combine electricity output from the current system with the solar rooftops’ potentialelectricity yield. The output map from sub-model 2 is spatially joined with DERiM map (DERiMWeb Map, 2016) in order to do the integrated capacity analysis by circuit line.3
GDSS To Optimize DERs’ PlacementThe outputs are property location and boundaries (geospatial data), proximity to power lines, andpotential residential sites suitable for DERs’ adoption. The required data is mainly retrieved from the LosAngeles County GIS Data Portal and the SCE’s DRiEM.The proposed predictive model can be applied for all Energy Informatics use cases such as commercial,residential, and factories. In this paper, we chose to focus on the “residential” parcel type in LA Countydue to the data availability. We further chose to use Claremont City as a demonstration to provide anevidence for our research findings. Claremont city is located in the eastern border of Los Angeles Countyin California. According to 2014 United States Census, the population is 36.054. The main reason forchoosing this city is the data availability. Electricity service is provided by SCE in the city of Claremont.Hence, data is available and accessible from SCE DERiM and LA County solar map.Figure 1: Geographic Decision Support System Model To Optimize DERs' PlacementConcluding RemarksThis study aims at addressing “How can GIS be employed to optimize the placement of DERs?” To answerthe research question, we have defined GIS, investigated its applications in utilities, and examined how itcan be employed for predictive modeling. A GDSS model is developed utilizing ArcMap 10.3 software toassist utility companies in prioritizing locations, which need infrastructure work, and detecting regionswhere DERs may provide net benefits.From this research, we argue that not only can GIS be used as a display tool, but it also offers a solution toanalyze the electric grid distribution system. Our model provides evidence that GIS can perform the grid’sintegrated capacity analysis in replacement of the software currently employed by utilities.REFERENCESCalifornia Energy Commission. (2015). California Electricity Data, Facts, & Statistics. (Retrieved October7, 2015, from htmlCalifornia Public Utility Commission (2015a). Distribution Resources Plan. Retrieved October 10, 2015,from http://www.cpuc.ca.gov/PUC/energy/drp/index.htm4
GDSS To Optimize DERs’ PlacementCalifornia Public Utility Commission (2015b). Electricity and Natural Gas Regulation in California.Retrieved October 11, 2015, from http://www.cpuc.ca.gov/PUC/energy/Committee on Analytical Research Foundations for the Next-Generation Electric Grid; Board onMathematical Sciences and Their Applications; Division on Engineering and Physical Sciences;National Academies of Sciences, Engineering, and Medicine. (2015). Analytic ResearchFoundations for the Next-Generation Electric Grid. Retrieved April 1, 2016, fromhttp://www.nap.edu/21919Dickey, David. (2012). Introduction to Predictive Modeling with Examples SAS Global 37-2012.pdfDiesel Service & Supply. (2015). Electric Power Grid Modernization and Expansion. Retrieved October 18,2015, from http://www.dieselserviceandsupply.com/Power Grid Upgrades and Expansion.aspxEnvironmental Systems Research Institute (2015). How Hot Spot Analysis: Getis-Ord Gi* /java/gp toolref/spatial statistics tools/how hotspot analysis colon getis ord gi star spatial statistics works.htmGergen, M., Campopiano, M., & Meyer, A. (2014, August 20). CPUC Opens Rulemaking to IncorporateDistributed Energy Resources Into Grid Planning Process for California’s Investor-Owned Utilities :Clean Energy Law Report : Renewable Energy Lawyer and Environmental Law Attorney : Latham ess-for-cal/Idowu, A., Okoronkwo, N., & Adagunodo, R. (2009). Spatial Predictive Model for Malaria in Nigeria Journal of Health Informatics in Developing Countries. Retrieved October 19, 2015, iew/34Investopedia. (2015). The Industry Handbook: The Utilties Industry. Retrieved October 11, 2015, andbook/utilities.aspPhotovoltaic software (2016). How to calculate the annual solar energy output of a photovoltaic system.RetrievedMarch 6, 2016, gycalculation.phpSouthern California Edison. (2015). Distribution Resources Plan. Retrieved November 28, 2015, FD4-44C6-9818A04452961CEC/0/A1507XXX DRP Application SCE Application and Distribution ResourcesPlan and Appendices AJ1.pdfTotman, David. (2013). Model predictions: GIS helps public works manage assets. Retrieved October 19,2015, from ited States Census (2016). Quick Facts Claremont City, California. Retrieved April 22, 2016, 15/0613756United States Department of Energy: Office of Electricity Delivery and Energy Reliability. (2015a). United States Department of Energy: Office of Electricity Delivery and Energy Reliability. (2015b). https://www.smartgrid.gov/the smart grid/renewable energy.htmlUnited States Department of Energy. (2015c). National Electric Transmission Congestion Study.Retrieved October 10, 2015, from rictransmission-congestion-studyUnited States Department of Energy. (2015d). Quadrennial Technology Review: An Assessment of EnergyTechnologies And Research Opportunities: Chapter 3 - Enabling Modernization of the ElectricPower System. Retrieved October 11, 2015, from rnization-electric-power-systemUnited States Department of Energy. (2015e). Quadrennial Technology Review: Executive Summary.Retrieved October 11, 2015, from d States Department of Energy. (2015f). Smart Grid. Retrieved October 11, 2015, power/smart-grid5
Claremont Graduate university Vivian.Sultan@cgu.edu Hind Bitar Claremont Graduate university Hind.Bitar@cgu.edu Abstract The United States electric utility industry is moving toward a new power grid that will accommodate bi- . rooftops' rankings. According to the Photovoltaic software (2016), the key elements to compute .