Transcription
Q2 Fiscal 2021Earnings PresentationFEBRUARY 24, 2021
Safe HarborNon-GAAP Financial Measures and Other Key Performance MeasuresTo supplement our consolidated financial statements, which are prepared and presented in accordance with GAAP, we use the following non-GAAP financial and other key performance measures: billings,non-GAAP gross margin, non-GAAP operating expenses, non-GAAP net loss, non-GAAP net loss per share, free cash flow, subscription revenue, subscription billings, subscription revenue mix, subscriptionbillings mix, professional services billings, Total Contract Value Bookings (or TCV Bookings), Annual Contract Value Billings (or ACV Billings), and Run-rate Annual Contract Value (or Run-rate ACV). Incomputing these non-GAAP financial measures and key performance measures, we exclude certain items such as stock-based compensation and the related income tax impact, costs associated with ouracquisitions (such as amortization of acquired intangible assets, income tax-related impact, and other acquisition-related costs), impairment of operating lease-related assets, change in fair value ofderivative liability, amortization of debt discount and issuance costs, non-cash interest expense, other non-recurring transactions and the related tax impact, and the revenue and billings associated withpass-through hardware sales. Billings is a performance measure which we believe provides useful information to investors because it represents the amounts under binding purchase orders received by usduring a given period that have been billed, and we calculate billings by adding the change in deferred revenue between the start and end of the period to total revenue recognized in the same period.Non-GAAP gross margin, non-GAAP operating expenses, non-GAAP net loss, and non-GAAP net loss per share are financial measures which we believe provide useful information to investors becausethey provide meaningful supplemental information regarding our performance and liquidity by excluding certain expenses and expenditures such as stock-based compensation expense that may not beindicative of our ongoing core business operating results. Free cash flow is a performance measure that we believe provides useful information to our management and investors about the amount of cashgenerated by the business after necessary capital expenditures, and we define free cash flow as net cash (used in) provided by operating activities less purchases of property and equipment. Subscriptionrevenue, subscription billings, subscription revenue mix, subscription billings mix, and professional services billings are performance measures that we believe provide useful information to ourmanagement and investors as they allow us to better track the growth of the subscription-based portion of our business, which is a critical part of our business plan. TCV Bookings is a performancemeasure that the Company believes provide useful information to its management and investors as it allows the Company to better track the true growth of its software business by excluding the amountsattributable to the pass-through hardware sales that the Company uses to deliver its solutions. ACV Billings and Run-rate ACV are performance measures that we believe provide useful information to ourmanagement and investors as they allow us to better track the topline growth of our business during our transition to a subscription-based business model because they take into account variability interm lengths. We use these non-GAAP financial and key performance measures for financial and operational decision-making and as a means to evaluate period-to-period comparisons. However, thesenon-GAAP financial and key performance measures have limitations as analytical tools and you should not consider them in isolation or as substitutes for analysis of our results as reported under GAAP.Billings, non-GAAP gross margin, non-GAAP operating expenses, non-GAAP net loss, non-GAAP net loss per share, and free cash flow are not substitutes for total revenue, gross margin, operatingexpenses, net loss, net loss per share, or net cash (used in) provided by operating activities, respectively; subscription revenue and TCV Bookings are not substitutes for total revenue; and subscription andprofessional services billings are not substitutes for subscription and professional services revenue, respectively. There is no GAAP measure that is comparable to ACV Billings, Run-rate ACV or TCVBookings, so we have not reconciled the ACV Billings, Run-rate ACV and TCV Bookings numbers included in this presentation to any GAAP measure. In addition, other companies, including companies inour industry, may calculate non-GAAP financial measures and key performance measures differently or may use other measures to evaluate their performance, all of which could reduce the usefulness ofour non-GAAP financial measures and key performance measures as tools for comparison. We urge you to review the reconciliation of our non-GAAP financial measures and key performance measures tothe most directly comparable GAAP financial measures set forth in the tables captioned “GAAP to Non-GAAP Reconciliations and Calculation of Billings” and “Disaggregation of Billings and Revenue”included in the appendix hereto, and not to rely on any single financial measure to evaluate our business.Divider slideConsectetur adipiscing elit.Pellentesque posuere dictum turpis et iaculis. 2021 Nutanix, Inc. All rights reserved. Nutanix, the Nutanix logo, and all Nutanix product, feature, and service names mentioned herein are registered trademarks or trademarks of Nutanix, Inc. in theUnited States and other countries. Other brand names or logos mentioned or used herein are for identification purposes only and may be the trademarks of their respective holder(s). Nutanix may not beassociated with, or be sponsored or endorsed by, any such holder(s).
Safe HarborForward Looking StatementsThis presentation and the accompanying oral commentary contain express and implied forward-looking statements, including, but not limited to, statements relating to: our business plans, goals,strategies, initiatives, objectives and outlook, including our plans to focus on go-to-market sales productivity and execution, customer satisfaction, deepening our strategic alliances and partnerships,growing and diversifying our employee base, and our environmental, social and governance efforts and related disclosures, as well as our outlook regarding the position we anticipate being in futureperiods; our ability to execute on such plans, goals, strategies, initiatives and objectives successfully and in a timely manner, and the benefits and impact of such plans, initiatives and objectives on ourbusiness, operations and financial results, including on our operating expenses, free cash flow, cash usage in future periods, and long-term growth; our plans and timing for, and the success and impact of,any current and future business model transitions, including the impact thereof on our revenue and product mix, average contract term lengths, renewal cycles, go-to-market cost structure, operatingexpenses, free cash flow, and liquidity position; our ability to maintain and strengthen, and form new, strategic alliances and partnerships, as well as the success and benefits thereof on our business,operations and financial results; the timing and potential impact of the COVID-19 pandemic on the global market environment and the IT industry, as well as on our business, operations and financialresults, including the changes we have made or anticipate making in response to the COVID-19 pandemic, our ability to manage our business during the pandemic, and the position we anticipate being infollowing the pandemic; the competitive market, including our competitive position, our projections about our market share, the size of our total addressable market, and the competitive advantages ofour products; macroeconomic environment and industry trends, projected growth or trend analysis; our customer needs and our ability to address those needs successfully and in a timely manner; our goto-market strategy, including our plans regarding product portfolio, pricing and packaging, and the success and impact thereof; the benefits and capabilities of our platform, solutions, products, servicesand technology, including the interoperability and availability of our solutions with and on third-party platforms; our plans and expectations regarding new products, services, product features andtechnology, including those that are still under development or in process; the success and impact of our customer, partner, industry, analyst, investor, and employee events on our business, including onfuture pipeline generation; our guidance on estimated ACV Billings, non-GAAP gross margin, non-GAAP operating expenses and weighted average shares outstanding for any future fiscal periods,including our expectations and assumptions underlying such guidance; and our expectations regarding any future changes to our run-rate ACV, average contract term lengths, operating expenses, freecash flow and cash usage. These forward-looking statements are not historical facts and instead are based on our current expectations, estimates, opinions, and beliefs. Consequently, you should not relyon these forward-looking statements. The accuracy of these forward-looking statements depends upon future events and involves risks, uncertainties, and other factors, including factors that may bebeyond our control, that may cause these statements to be inaccurate and cause our actual results, performance or achievements to differ materially and adversely from those anticipated or implied bysuch statements, including, among others: failure to successfully implement or realize the full benefits of, or unexpected difficulties or delays in successfully implementing or realizing the full benefits of, ourbusiness plans, initiatives and objectives; delays or unexpected accelerations in the transition to a subscription-based business model; our ability to achieve, sustain and/or manage future growtheffectively; the timing, breadth, and impact of the COVID-19 pandemic on our business, operations, and financial results, as well as the impact on our customers, partners, and end markets; failure tosuccessfully manage or realize the benefits of our Chief Executive Officer succession; failure to timely and successfully meet our customer needs; delays in or lack of customer or market acceptance of ournew products, services, product features or technology; the rapid evolution of the markets in which we compete; factors that could result in the significant fluctuation of our future quarterly operatingresults, including, among other things, anticipated changes to our revenue and product mix, including changes as a result of our transition to a subscription-based business model, which will slow revenuegrowth during such transition and make forecasting future performance more difficult, the timing and magnitude of orders, shipments and acceptance of our solutions in any given quarter, our ability toattract new and retain existing end-customers, changes in the pricing of certain components of our solutions, and fluctuations in demand and competitive pricing pressures for our solutions; theintroduction, or acceleration of adoption of, competing solutions, including public cloud infrastructure; and other risks detailed in our Annual Report on Form 10-K for the fiscal year ended July 31, 2020,filed with the U.S. Securities and Exchange Commission, or the SEC, on September 23, 2020. Additional information will also be set forth in our Quarterly Report on Form 10-Q that will be filed for the fiscalquarter ended January 31, 2021 which should be read in conjunction with this presentation and the financial results included herein. Our SEC filings are available on the Investor Relations section of ourwebsite at ir.nutanix.com and on the SEC's website at www.sec.gov. These forward-looking statements speak only as of the date of this presentation and, except as required by law, we assume noobligation, and expressly disclaim any obligation, to update, alter or otherwise revise any of these forward-looking statements to reflect actual results or subsequent events or circumstances.Divider slideConsectetur adipiscing elit.Pellentesque posuere dictum turpis et iaculis.
4Q2’21 Company HighlightsStrong Quarter Across the Board14% YoY growth in ACV Billings, 28% YoY growth in Run-rate ACV, and exceeded guidance across allother key financial metricsHired New President and CEORajiv Ramaswami joined Nutanix in December as President and Chief Executive Officer. He is a seasonedtechnology industry executive who has held senior executive roles at industry leaders including VMware,Broadcom, and CiscoMarket Opportunity Remains Strong Even During PandemicHCI market continues to show strength and grow despite challenging times in certain verticals andindustriesEmerging Product Adoption Continues to Grow(1)New ACV from emerging products up 100 % YoY; emerging product attach rate increased to 37%, up 6points YoYContinued Momentum with Key Customer Wins and Solid ExecutionLarge customers continue to rely on Nutanix’s simple and easy-to-use software to help them withbusiness transformationNote: See Appendix for definitions of ACV Billings, Run-rate ACV, ACV, and New ACV. There is no GAAP measure that is comparable to either ACVBillings or Run-rate ACV, so the Company has not reconciled the ACV Billings and Run-rate ACV numbers in this presentation to any GAAP measure.(1) Defined as the % of deals that involve at least one emerging product, calculated on a rolling four-quarter average.
Management CommentaryRajiv RamaswamiPresident & ChiefExecutive OfficerDuston WilliamsChief Financial Officer“We delivered a strong quarter across the board, exceeding guidanceon all metrics and continuing our momentum with key customer winsand solid execution. In my first two months as CEO of Nutanix, myconviction that we have a talented employee base, loyal customers wholove the simplicity of our software, and a strong market opportunityahead of us has only been reinforced.”“We delivered record ACV Billings with growth of 14 percent year-overyear, bolstered by the strength of our emerging products. We continuedto make progress on our transition to subscription and maintained ourdisciplined approach to managing operating expenses, which werelower than expected this quarter. We look forward to continuing toexecute on our transformation and are confident Nutanix is wellpositioned for long-term value creation.”Note: See Appendix for definitions of ACV Billings. There is no GAAP measure that is comparable to ACV Billings. 5
Q2’21 Financial Summary 6Q2’21 ResultsYoY ChangeQ2’21 Guidance 159.2M14% 145- 148M 1.38B28%approx. 25%3.4 Years(0.5) YearN/A 346.4MFlatN/A82.7%130 bps81.5%Non-GAAP Operating Expenses 353.5M(11)% 360- 370MNon-GAAP Net Loss Per Share (0.37) 0.23N/A (28.5)M 45.2MN/AACV BillingsRun-rate ACVTotal Average Contract Term(1)Total RevenueNon-GAAP Gross MarginFree Cash Flow(1) Q2’21 total revenue was negatively impacted by the year-over-year decline in average contract term associated with the Company’s ongoing transition tosubscription.Note: See Appendix for GAAP to non-GAAP reconciliations, as well as definitions of ACV Billings, Run-rate ACV, and Total Average Contract Term. Thereis no GAAP measure that is comparable to either ACV Billings or Run-rate ACV, so the Company has not reconciled the ACV Billings and Run-rate ACVnumbers in this presentation to any GAAP measure.
Q2’21 Subscription Highlights 159MACV Billings 14% YoY82.7%Non-GAAP Gross Margin 130 bps YoY 1.38BRun-rate ACV 28% YoY3.4 YearsTotal Average Contract Term(0.5) Year YoYNote: Data is as of January 31, 2021. See Appendix for definitions of ACV Billings, Run-rate ACV, ACV and Total Average Contract Term and a GAAP tonon-GAAP reconciliation of Non-GAAP Gross Margin. There is no GAAP measure that is comparable to either ACV Billings or Run-rate ACV, so theCompany has not reconciled the ACV Billings and Run-rate ACV numbers in this presentation to any GAAP measure. 7
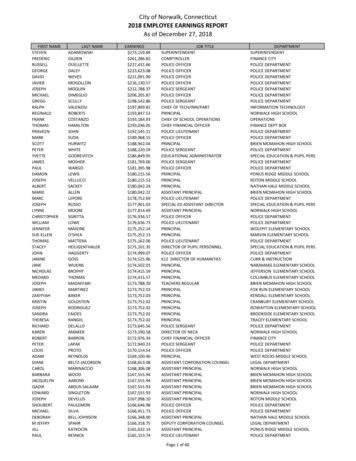
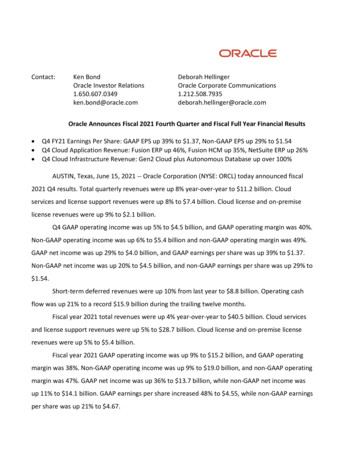
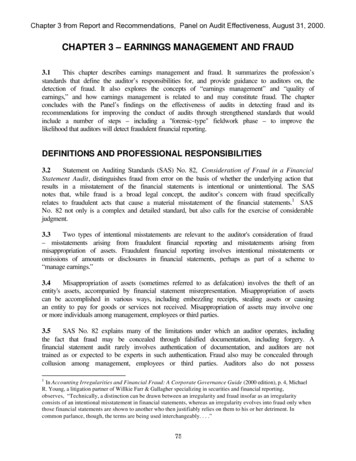
Run-rate ACV 8 28%YoY 1,385 1,291 Millions 1,220 1,155 1,081 1,002 944 860 te: See Appendix for definition of Run-rate ACV. There is no GAAP measure that is comparable to Run-rate ACV, so the Company has not reconciledthe Run-rate ACV numbers in this presentation to any GAAP measure.
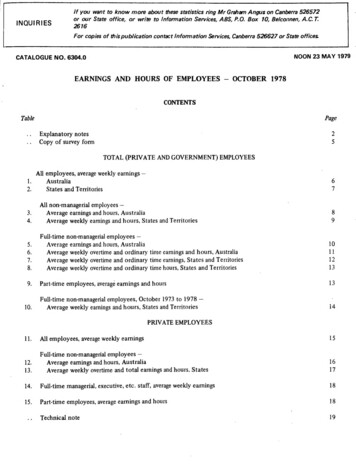
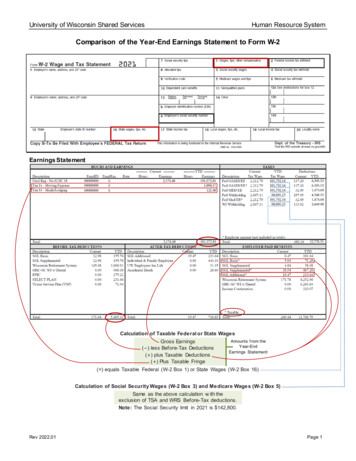
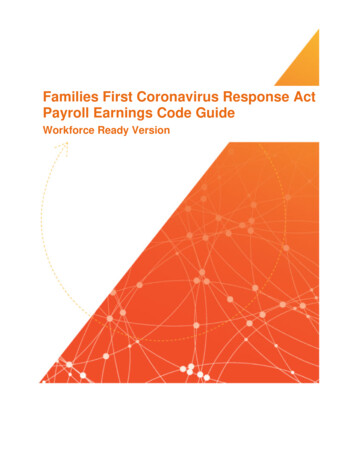
ACV Billings 9 14%YoY 159 MillionsMillions 140 124 126Q4'19Q1'20 135 140 138Q4'20Q1'21 117 108Q2'19Q3'19Q2'20Q3'20Q2'21Note: ACV Billings exclude amounts related to professional services and hardware. See Appendix for definition of ACV Billings.There is no GAAP measure that is comparable to ACV Billings, so the Company has not reconciled the ACV Billings numbers in this presentation to anyGAAP measure.
Q2’21 ACV Billings to Total Billings Conversion 101ACV Billings to Total Billings ConversionStart with forecasting ACV Billings and compare your estimate with Nutanix’s ACV Billings guidance and seasonality commentary.2 Estimate ACV Billings % by Term to get to ACV Billings by Term.3Multiply ACV Billings by Contract Term (Year) to get to TCV Billings by Term and the corresponding TCV Billings Term Mix, and then multiply TCVBillings Term Mix by Contract Term (Year) to back into Total Average Contract Term.(1)4 Estimate PS & HW Billings and add it to total TCV Billings by Term to get to Total Billings. Historical PS & HW billings mix can be found in the appendix.Contract Term(Year)ACV %by Term 149% 78 1 6819% 1 0.225% 82 154%2 0.1326% 413 12134%3 1.045*2% 34 113%4 0.118% 285 13939%5 1.960% 16 31%6 0.170% 07 31%7 0.1Total100% 159 361100%- 252PS & HWBillings:1ACV Billings:**ACV by Term 159xContract Term(Year)Total Billings: TCV by Term 3863TCVTerm MixxContract Term (Year)Total AverageContract Term3.44ACV Billings to Total Billings Ratio:2.42* 5-year term includes 5-year subscription licenses and non-portable (life-of-device) software licenses with an assumed contract term of 5 years.** ACV Billings exclude amounts related to professional services and hardware. See Appendix for definition of ACV Billings.(1) Refers to professional services and hardware billings.Note: There is no GAAP measure that is comparable to ACV Billings, so the Company has not reconciled the ACV Billings numbers in this presentation toany GAAP measure.
ACV % and Historical Contract Terms 11ACV Billings % by TermOther earTotal Average Contract Term e: See previous page for calculation of ACV % by term highlighted in light blue column. See Appendix for definitions of ACV Billings and TotalAverage Contract Term.(1) Other includes include less than 1, 2-, 4-, 6- and 7-year contract terms
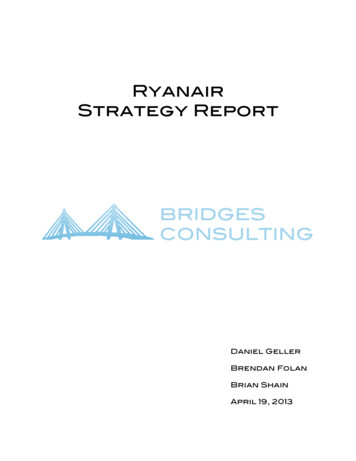
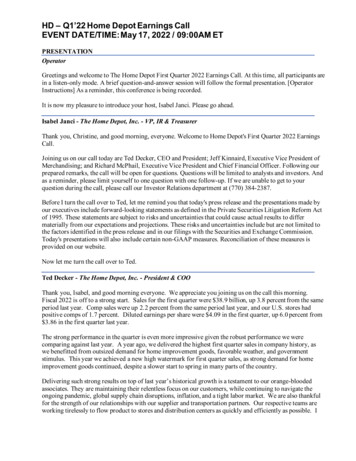
Gross Margin 12By Fiscal YearBy 1'21Q2'21FY'17Note: Margins shown on a non-GAAP basis. See Appendix for a reconciliation of GAAP to non-GAAP measures.FY'18FY'19FY'20
Q2’21 Hybrid and Multicloud Platform52%AHV Adoption asa % of Total Nodes(1) 6pts YoY37%% of Deals Involving at Least(1)One Emerging Product 6pts YoY(1) Calculated on a rolling four-quarter averageNote: See Appendix for definitions of ACV and New ACV.100 %YoY Growth ofNew ACVfrom Emerging Products 13
Customer Growth MomentumQ2’21 Highlights 1418,770Cumulative Customer Count18,040(1)18%Total CustomersYoY Growth17,36016,580950(1)15,880G2K Customers14,96015.7x(2)14,180G2K Lifetime ACVRepeat Purchase Multiple13,1908012,410Forbes Global100 Customers90 NPS7-Year 21(1) The cumulative worldwide end-customer and G2K customer counts reflect standard adjustments to certain customer accounts within our system ofrecord and are rounded to the nearest 10. See endnote 1 in the Appendix.(2) See endnote 2 in the AppendixNote: See Appendix for definition of ACV.
Over 1M Customer Growth 15Q2’21 HighlightsCumulative End-customers(1)with Lifetime Bookings (LTB) 1M1,358 26%YoY1,276955Customers 1- 3M in LTB1,2071,0601,122 29%YoY990190Customers 3- 5M in LTB921848 35%YoY779 1136Customers 5- 10M in LTB77Customers 10M in LTB(1) Measured in TCV Bookings. See Appendix for definition of TCV Bookings. There is no GAAP measure that is comparable to TCV Bookings, so theCompany has not reconciled the TCV Bookings numbers in this presentation to any GAAP measure.
Q3’21 Financial Guidance 16Q3’21 GuidanceACV BillingsNon-GAAP Gross MarginNon-GAAP Operating ExpensesWeighted Average Shares Outstanding 150- 155MApproximately 81% 365- 370MApproximately 207MModeling Assumptions:1. Q3’21 guidance anticipates a slight seasonal decrease in ACV Billings in Q3’21 vs. Q2’21, while at the same time reflecting year-over-yeargrowth of 11% to 15%.2. Based on the Q3’21 ACV Billings guidance, Run-rate ACV is expected to continue its strong growth trend and grow in the mid 20% rangeyear-over-year.3. Q3’21 Total Average Contract Term is not expected to see dramatic quarter-over-quarter changes in term lengths with terms fluctuating byapproximately 0.1 per quarter going forward.4. Linearity in Q3 is not typically as strong as Q2, and therefore cash usage is expected to increase in Q3’21. Q3’21 cash usage will most likelybe in the range of street consensus numbers for Q3’21 as of February 23, 2021.Note: Q3’21 guidance is as of February 24, 2021. See Appendix for definitions of ACV Billings, Run-rate ACV, ACV and Total Average Contract Term.There is no GAAP measure that is comparable to ACV Billings or Run-rate ACV, so the Company has not reconciled the ACV Billings and Run-rate ACVnumbers in this presentation to any GAAP measure.
Appendix
Nutanix Reporting Model 18Product MixTermRevenueRecognizedTerm-based Subscription1, 3, or 5 YearsUpfrontSaaS SubscriptionMonthly Up to 5 YearsRatableSupport and Entitlements1, 3, or 5 YearsRatableNon-portable SoftwareSoftware LicenseAttached to ApplianceLife of the Device (LoD)UpfrontProfessional ServicesProfessional Services forall Nutanix OfferingsVariousAs PerformedPass-through HardwarePass-throughHardware CostN/AUpfrontProduct TypeSubscription
Endnotes and DefinitionsEndnotes1.Global 2000 (G2K) and Forbes 100 customer counts reflect yearly update to the members of both lists as reported by Forbes. Cumulative worldwide end-customer andG2K customer counts reflect standard adjustments to certain customer accounts within our system of record, and are rounded to the nearest 10.2.G2K lifetime ACV purchase multiple is defined as ACV of total lifetime purchase divided by ACV of initial purchase, for G2K customers that have been customers for over18 months.DefinitionsACV Billings, for any given period, is defined as the sum of the ACV for all contracts billed during the given period. Annual Contract Value, or ACV, is defined as the totalannualized value of a contract, excluding amounts related to professional services and hardware. The total annualized value for a contract is calculated by dividing the totalvalue of the contract by the number of years in the term of such contract, using, where applicable, an assumed term of five years for contracts that do not have a specifiedterm.ACV Bookings, for any given period, is defined as the sum of the ACV for all contracts booked during the given period.New ACV with respect to any given contract is defined as (i) if the contract is (A) with a new customer, the aggregate value of such contract excluding professional services,or (B) with an existing customer, the aggregate value of any upsell / expansion under such contract excluding professional services, in each case divided by (ii) the number ofyears in the term of such contract, using an assumed term of five years for life-of-device licenses.Run-rate ACV, at the end of any period, is the sum of ACV for all contracts that are in effect as of the end of that period. For the purposes of this calculation, the Companyassumes that the contract term begins on the date a contract is booked, irrespective of the periods in which the Company would recognize revenue for such contract.Total Average Contract Term, represents the dollar-weighted term, calculated on a billings basis, across all subscription and life-of-device contracts, using an assumed termof five years for life-of-device licenses, executed in the quarter.Total Contract Value Billings, or TCV Billings, for any given period is defined as the total software and support billings, as applicable, during such period, which excludesrevenue, billings, and bookings associated with pass-through hardware sales during the period.Total Contract Value Bookings, or TCV Bookings, for any given period is defined as the total software and support bookings, as applicable, during such period, whichexcludes revenue, billings, and bookings associated with pass-through hardware sales during the period.Note: ACV, ACV Billings, ACV Bookings, New ACV, and Run-rate ACV are performance measures that the Company believes provides useful information to its managementand investors as they allow the Company to better track the topline growth of its business during its transition to a subscription-based business model because it takes intoaccount variability in term lengths. TCV Bookings is a performance measure that the Company believes provide useful information to its management and investors as itallows the Company to better track the true growth of its software business by excluding the amounts attributable to the pass-through hardware sales that the Company usesto deliver its solutions. TCV Bookings is not a substitute for total revenue. There is no GAAP measure that is comparable to ACV, ACV Billings, ACV Bookings, New ACV, Runrate ACV, or TCV Bookings so the Company has not reconciled the ACV, ACV Billings, ACV Bookings, New ACV, Run-rate ACV, and TCV Bookings numbers included in thispresentation to any GAAP measure. 19
GAAP to Non-GAAP Reconciliations and Calculationof %66.6%75.4%78.1%Stock-based compensation expense1.82.32.32.32.11.61.01.52.1Amortization of intangible assets1.11.11.11.21.10.20.51.21.1Impairment of lease-related assets0.2--0.1-----Gross margin 81.3%Operating expenses (GAAP) (478.6) (476.2) (432.3) (426.9) (431.7)Stock-based compensation expense79.084.885.381.977.0Amortization of intangible assets0.60.60.70.70.7Impairment of lease-related assets2.5--2.5-Other0.20.50.50.60.5 (396.3) (390.3) (345.8) (341.2) (353.5) (1.13) (1.23) (0.93) (1.31) (1.42)Stock-based compensation expense0.440.480.470.440.42Amortization of intangible assets0.030.020.020.020.02Impairment of lease-related assets0.02--0.02-Amortization of debt discount and issuance costs0.040.040.040.070.11Change in fair value of derivative liability---0.320.50Income tax-related adjustments--0.01--Net loss per share (Non-GAAP) (0.60) (0.69) (0.39) (0.44) (0.37)Net cash provided by operating activities (52.5) (84.9) 3.6 (4.1) (15.6)Purchases of property and equipment(21.2)(32.6)(17.4)(12.2)(12.9) (73.7) (117.5) (13.8) (16.3) (28.5)Gross margin (GAAP)Operating expenses (Non-GAAP)Net loss per share (GAAP)Free cash flow (Non-GAAP)Note: All amounts in millions, except per share amounts and percentages.Total revenueChange in deferred revenue,net of acquisitionsTotal billingsQ2’20Q2’21 346.8 346.481.339.1 428.1 385.5 20
Disaggregation of Billings and Revenue Millions 1Q2’21Subscription revenue 330.7 648.4 1,030.2 266.5 261.0 284.8 278.2 305.9Change in subscription deferred revenue, net of scription billings 582.0 916.0 1,276.4 339.1 321.1 340.7 293.9 339.1Non-portable software revenue 544.0 449.1 208.1 59.1 41.9 29.5 20.0 21.7--------Non-portable software billings 544.0 449.1 208.1 59.1 41.9 29.5 20.0 21.7Professional services revenue 23.4 33.3 45.9 12.6 11.6 12.2 13.8 17.5Change in professional services deferred revenue, net of acquisitions 10.8 11.0 26.28.75.14.76.55.9Professional services billings 34.2 44.3 72.1 21.3 16.7 16.9 20.3 23.4Pass-through hardware revenue 257.3 105.3 23.5 8.6 3.8 1.4 0.7 1.3-------- 257.3 105.3 23.5 8.6 3.8 1.4 0.7 1.3Subscription revenue mix29%52%79%77%82%87%89%89%Non-portable software revenue mix47%36%16%17%13%9%7%6%Professional services revenue mix2%3%3%4%4%4%4%5%Pass-through hardware revenue 00%100%Subscription billings mix41%60%81%79%84%88%88%88%Non-portable software billings mix38%30%13%14%11%8%6%6%Professional services billings mix3%3%5%5%4%4%6%6%Pass-through hardware billings 00%100%Change in non-portable software deferred revenue, net of acquisitionsChange in pass-through hardware deferred revenue, net of acquisitionsPass-through hardware billings
Feb 24, 2021