Transcription
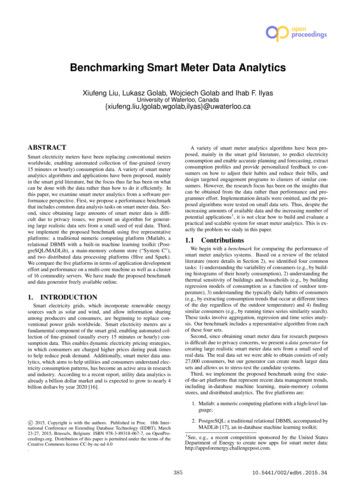
ASmart Meter Data Analytics: Systems, Algorithms and BenchmarkingXIUFENG LIU, Technical University of DenmarkLUKASZ GOLAB, University of WaterlooWOJCIECH GOLAB, University of WaterlooIHAB F. ILYAS, University of WaterlooSHICHAO JIN, University of WaterlooSmart electricity meters have been replacing conventional meters worldwide, enabling automated collection of fine-grained (e.g., every 15 minutes or hourly) consumption data. A variety of smart meter analyticsalgorithms and applications have been proposed, mainly in the smart grid literature. However, the focus hasbeen on what can be done with the data rather than how to do it efficiently. In this paper, we examine smartmeter analytics from a software performance perspective. First, we design a performance benchmark thatincludes common smart meter analytics tasks. These include off-line feature extraction and model buildingas well a framework for on-line anomaly detection that we propose. Second, since obtaining real smart meterdata is difficult due to privacy issues, we present an algorithm for generating large realistic data sets from asmall seed of real data. Third, we implement the proposed benchmark using five representative platforms:a traditional numeric computing platform (Matlab), a relational DBMS with a built-in machine learningtoolkit (PostgreSQL/MADlib), a main-memory column store (“System C”), and two distributed data processing platforms (Hive and Spark/Spark Streaming). We compare the five platforms in terms of applicationdevelopment effort and performance on a multi-core machine as well as a cluster of 16 commodity servers.CCS Concepts: rInformation systems Database performance evaluation; Data mining;Additional Key Words and Phrases: Smart meters; Data analytics; Performance benchmarking; Hadoop;SparkACM Reference Format:Smart Meter Data Analytics: Systems, Algorithms and Benchmarking ACM Trans. Datab. Syst. V, N, Article A (January YYYY), 39 pages.DOI: http://dx.doi.org/10.1145/0000000.00000001. INTRODUCTIONSmart electricity grids, which include renewable energy sources such as solar andwind, and allow information sharing among producers and consumers, are beginningto replace conventional power grids worldwide. Smart electricity meters are a fundamental component of the smart grid, enabling automated collection of fine-grained(usually every 15 minutes or hourly) consumption data. This enables, among otherthings, dynamic electricity pricing strategies, in which consumers are charged higherprices during peak times to help reduce peak demand. Additionally, smart meter dataanalytics, which aim to help utilities and consumers understand electricity consumption patterns, has become an active area in research and industry. According to a recentreport, utility data analytics is already a billion dollar market and is expected to growto nearly 4 billion dollars by year 20201 .A variety of smart meter analytics algorithms have been proposed, mainly in thesmart grid literature, to predict electricity consumption and enable accurate planningand forecasting, extract consumption profiles to provide personalized energy-savingtips to consumers, and design targeted engagement programs to clusters of similarconsumers. However, the research focus has been on the insight that can be obtainedfrom the data rather than performance and programmer effort. Implementation details were omitted, and the proposed algorithms were tested on small data sets. Moreover, a recent industry survey found that smart grid analytics are severely lacking1 soft-grid-2013ACM Transactions on Database Systems, Vol. V, No. N, Article A, Publication date: January YYYY.
A:2[EPRI 2013]. Thus, despite the increasing amounts of available data and the increasing number of applications2 , it is not clear how to build and evaluate a practical systemfor smart meter analytics. This is exactly the problem we study in this paper.1.1. ContributionsWe begin with a benchmark for comparing the performance of smart meter analyticssystems. Based on a review of prior work (details in Section 2), we identified five common tasks: 1) understanding the variability of consumers (e.g., by building histogramsof their hourly consumption), 2) understanding the thermal sensitivity of buildingsand households (e.g., by building regression models of consumption as a function ofoutdoor temperature), 3) understanding the typical daily habits of consumers (e.g., byextracting consumption trends that occur at different times of the day regardless ofthe outdoor temperature), 4) finding similar consumers (e.g., by running times seriessimilarity search), and 5) anomaly detection. These tasks involve aggregation, regression, time series analysis, and cross-checking new data against historical data; theyinclude a mix of operators (aggregation, time series analysis, machine learning) andworkloads (historical and on-line) that have been studied in isolation, but not in a single benchmark. Our benchmark includes representative algorithms from each of thesesets, including an on-line anomaly detection framework that we propose.Second, since obtaining smart meter data is difficult due to privacy concerns, wepresent a data generator for creating large realistic smart meter datasets from a smallseed of real data. The generator includes several user-controlled parameters. For instance, it can create new datasets corresponding to consumers who are less or more“peaky” than those in the original sample. The real dataset we were able to obtain consists of over a year of data from 27,000 consumers, but our generator can create muchlarger data sets and allows us to stress-test the candidate systems.Third, we implement the proposed benchmark using five state-of-the-art platformsthat represent recent data management trends, including in-database machine learning, main-memory column stores, and distributed analytics. The five platforms are:(1) Matlab: a numeric computing platform with a high-level language;(2) PostgreSQL: a traditional relational DBMS, plus MADlib [Hellerstein et al. 2012],an in-database machine learning toolkit;(3) “System C”: a main-memory column-store commercial system (the licensing agreement does not allow us to reveal the name of this system);(4) Spark/Spark Streaming [Zaharia et al. 2010; Zaharia et al. 2012]: a main-memorydistributed data processing platform;(5) Hive [Thusoo et al. 2009]: a Hadoop-based distributed data warehouse system.We report performance results on the real data set and larger realistic data setscreated by our data generator. Our main finding is that System C performs extremelywell on our benchmark at the cost of the highest programmer effort: System C doesnot come with built-in statistical and machine learning operators, which we had toimplement from scratch in a non-standard language. On the other hand, MADlib andMatlab make it easy to develop smart meter analytics applications, but they do not perform as well as System C. In cluster environments with very large data sizes, we foundthat Hive was only slightly slower than Spark for off-line tasks; for on-line anomalydetection, Spark was faster than Hive when all the data it needed had been cachedin memory and slower otherwise. Additionally, Spark and Hive are competitive with2 See,e.g., a recent competition sponsored by the United States Department of Energy to create new appsfor smart meter data: http://appsforenergy.challengepost.com.ACM Transactions on Database Systems, Vol. V, No. N, Article A, Publication date: January YYYY.
Smart Meter Data Analytics: Systems, Algorithms and BenchmarkingA:3System C in terms of efficiency (throughput per server) for several of the workloads inour benchmark.To summarize, we make four novel contributions in this paper: 1) a benchmark forsmart meter analytics, 2) a technique for generating very large realistic smart meterdatasets, 3) a smart meter anomaly detection framework, 4) an experimental evaluation of five data processing platforms using the proposed benchmark.Our benchmark (i.e., the data generator and the tested algorithms) is freely available at https://github.com/xiufengliu. Due to privacy issues, we are unable to share thereal data set or the large synthetic data sets based upon it. However, a smart meterdata set has recently become available at the Irish Social Science Data Archive3 andmay be used along with our data generator to create large publicly available data setsfor benchmarking purposes.1.2. RoadmapThe remainder of this paper is organized as follows. Section 2 summarizes the relatedwork; Section 3 presents the smart meter analytics benchmark; Section 4 discussesthe data generator; Section 5 presents experimental results; and Section 6 concludesthe paper with directions for future work.2. RELATED WORKAn earlier version of this paper appeared at the EDBT 2015 conference [Liu et al.2015a], where we proposed a benchmark for off-line smart meter data analytics. Inthis submission, we added a new component of the benchmark to test on-line analytics.In particular, we proposed a framework for on-line anomaly detection in smart meterdata, and implemented and tested the framework using three different platforms. Thisnew material is in the new section 3.5 (description of the proposed framework), section5.2 (implementation details) and sections 5.5, 5.6 and 5.7 (new benchmarking results).We also extended the data generator with the ability to control the “peakiness” ofthe generated time series (section 4.1) and experimentally verified that it producesrealistic data (new section 4.2). Furthermore, a system that implements the algorithmsin the proposed benchmark was demonstrated at the ICDE 2015 conference [Liu et al.2015b].2.1. Smart Meter Data AnalyticsTwo types of smart meter data sets have been studied: whole-house consumption readings collected by conventional smart meters (e.g., every hour) and high-frequency consumption readings (e.g., one per second), coming from the whole house or an individualcircuit, obtained using specialized load-measuring hardware. We focus on the former,as these are the data that are currently collected by utilities.For whole-house smart meter data feeds, there are two classes of applications: consumer and producer-oriented. Consumer-oriented applications provide feedback toend-users about reducing electricity consumption and saving money (see, e.g., [Birtet al. 2012; Mattern et al. 2010; Smith et al. 2012]). Producer-oriented applicationsare geared towards utilities, system operators and governments, and provide information about consumers such as their daily habits for the purposes of load forecastingand clustering/segmentation (see, e.g., [Abreu et al. 2012; Albert et al. 2013; Albertand Rajagopal 2013b; Ardakanian et al. 2014; Chicco et al. 2006; Espinoza et al. 2005;Figueiredo et al. 2005; Ghofrani et al. 2011; Nezhad et al. 2014; Rasanen et al. 2010]).From a technical standpoint, both of the above classes of applications perform twotypes of operations: extracting representative features (see, e.g., [Ardakanian et al.3 gulationcer/ACM Transactions on Database Systems, Vol. V, No. N, Article A, Publication date: January YYYY.
A:42014; Birt et al. 2012; Espinoza et al. 2005; Figueiredo et al. 2005]) and finding similarconsumers based on the extracted features (see, e.g., [Abreu et al. 2012; Chicco et al.2006; Rasanen et al. 2010; Smith et al. 2012; Tsekouras et al. 2007]). Household electricity consumption can be broadly decomposed into the temperature-sensitive component (i.e., heating and air conditioning) and the temperature-insensitive component(other loads and appliances). Thus, representative features include those which measure the effect of outdoor temperature on consumption [Albert and Rajagopal 2013a;Birt et al. 2012; Rasanen et al. 2010] and those which identify consumers’ daily habitsregardless of temperature [Abreu et al. 2012; Ardakanian et al. 2014; Espinoza et al.2005], as well as those which measure the overall variability (e.g., consumption histograms) [Albert et al. 2013]. Our smart meter benchmark, which will be described inSection 3, includes representative algorithms for characterizing consumption variability, temperate sensitivity, daily activity and similarity to other consumers.Furthermore, we distinguish between off-line and on-line analytics. The algorithmsdescribed above build prediction models and extract useful features off-line. There arealso on-line algorithms for identifying anomalies in smart meter data [Chen and Cook2011; Mashima and Cardenas 2012], which may run every hour as new data arrive orperhaps once a day. Again, these algorithms can be divided into consumer and utilityoriented. Consumer-oriented anomaly detection includes daily alerts if a household’smonthly bill is on track to be much higher than average. Utility-oriented anomalydetection may include detecting electricity theft [Mashima and Cardenas 2012]. InSection 3, we propose a distance-based outlier detection framework for smart meterdata that generalizes existing techniques and supports additional functionalities suchas explaining why a certain measurement was determined to be an outlier.We also point out recent work on smart meter data quality (specifically, handlingmissing data) [Jeng et al. 2013], symbolic representation of smart meter time series[Eichinger et al. 2015; Wijaya et al. 2013], and smart meter data privacy (see, e.g., [Acsand Castelluccia 2011; Buchmann et al. 2013; Kessler et al. 2015]). These importantissues are orthogonal to smart meter analytics, which is the focus of this paper.2.2. Systems and Platforms for Smart Meter Data AnalyticsTraditional options for implementing smart meter analytics include statistical andnumeric computing platforms such as R and Matlab. As for relational database systems, two important technologies are main-memory databases, such as “System C” inour experiments, and in-database machine learning, e.g., PostgreSQL/MADlib [Hellerstein et al. 2012]. Finally, a parallel data processing platform such as Hadoop or Sparkis an interesting option for cluster environments. We have implemented the proposedbenchmark in systems from each of the above classes (details in Section 5).Smart meter analytics software is currently offered by several database vendorsincluding SAP4 and Oracle/Data Raker5 , as well as startups such as Autogrid.com,C3Energy.com and OPower.com. Additionally, SQLstream6 describes a solution forreal-time analytics and alerting. However, it is not clear what algorithms are implemented by these systems and how.There has also been some recent work on efficient retrieval of smart meter datastored in Hive [Liu et al. 2014], but that work focuses on simple operational queriesrather than the deep analytics that we address in this paper.4 a/software/smart-meter-analytics/index.html5 lities/meter-data-analytics/index.html6 http://www.sqlstream.com/solutions/smart-gridACM Transactions on Database Systems, Vol. V, No. N, Article A, Publication date: January YYYY.
Smart Meter Data Analytics: Systems, Algorithms and BenchmarkingA:52.3. Benchmarking Data AnalyticsThere exist several database (e.g., TPC-C, TPC-H and TPC-DS) and big data7 benchmarks, but they focus mainly on the performance of relational queries (and/or transactions) and therefore are not suitable for smart meter data mining. Benchmarkingtime series data mining was discussed in [Keogh and Kasetty 2003]. Different implementations of time series similarity search, clustering, classification and segmentation were evaluated. While some of these operations are relevant to smart meter analytics, there are other important tasks such as extracting consumption profiles thatwere not considered in [Keogh and Kasetty 2003]. Additionally, [Keogh and Kasetty2003] evaluated standalone algorithms whereas we evaluate data analytics platforms.Furthermore, [Anil et al. 2013] benchmarked data mining operations for power system analysis. However, its focus was on analyzing voltage measurements from powertransmission lines, not smart meter data, and therefore the tested algorithms weredifferent from ours. Finally, Arlitt et al. [2015] propose a benchmark for smart metersthat focuses on routine computations such as finding top customers and calculatingmonthly bills. In contrast our work aims to discover more complex patterns in energydata. Their workload generator uses a Markov chain model that must be trained usinga real data set.We also note that TPC benchmarks include the ability to generate very large synthetic databases, and there has been research on synthetic database and data streamgeneration (see, e.g., [Bruno and Chaudhuri 2005; Gu et al. 2015]), but we are notaware of any previous work on generating realistic smart meter data.3. THE BENCHMARKIn this section, we propose a performance benchmark for smart meter analytics. Themain goal of the benchmark is to measure the running time of a set of tasks thatwill be defined shortly. We consider two types of tasks: off-line and on-line. For off-linetasks, the input consists of n time series, each corresponding to one electricity consumer, in one or n text files. We assume that each time series contains hourly electricity consumption measurements (in kilowatt-hours, kWh) for a year, i.e., 365 24 8760data points. For each consumption time series, we require an accompanying externaltemperature time series, also with hourly measurements. For on-line tasks, the inputconsists of a sequence of 30 files, each containing one day of data, i.e., 24 hourly consumption measurements and 24 hourly external temperature measurements, for all nconsumers. Additionally, on-line tasks are assumed to have access to the off-line (historical) data set as well as the models built by off-line tasks (we will explain shortlywhy this is required).For off-line tasks, we measure the running time on the input data set, both witha cold start (data on disk) and a warm start (data loaded into physical memory). Foron-line tasks, we measure the time it takes to load new data and the running time ofthe task itself.Utility companies may have access to additional data about their customers, e.g.,location, square footage of the home or family size. However, this information is usuallynot available to third-party applications. Thus, the input to our benchmark is limitedto smart meter time series and publicly-available weather data.We now discuss the five analysis tasks included in the proposed benchmark. Thefirst four are off-line: consumption histograms, thermal sensitivity, daily profiles andsimilarity search. The last one, anomaly detection, is on-line.7 https://amplab.cs.berkeley.edu/benchmarkACM Transactions on Database Systems, Vol. V, No. N, Article A, Publication date: January YYYY.
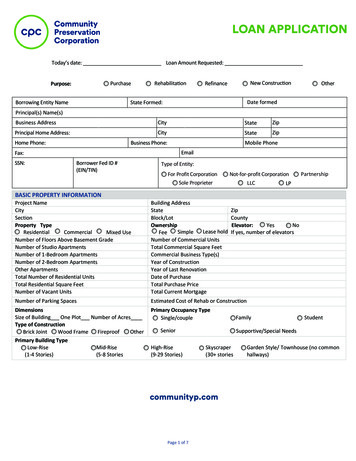
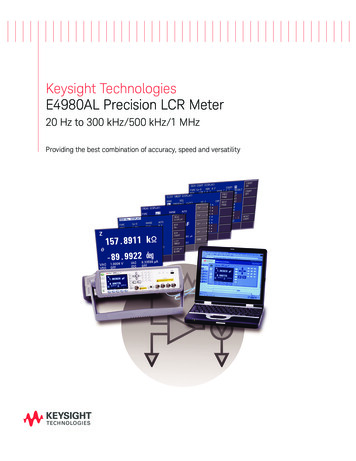
FrequencyA:6Consump(on(kWh)Fig. 1. Example of a consumption histogram.3.1. Consumption HistogramsThe first task is to understand the variability of each consumer. To do this, we computethe distribution of hourly consumption for each consumer via a histogram, an exampleof which is shown in Figure 1. The x-axis in the histogram denotes various hourlyconsumption ranges and the y-axis is the frequency, i.e., the number of hours in theyear whose electricity consumption falls in the given range. For concreteness, in theproposed benchmark we specify the histograms to be equi-width (rather than equidepth) and we always use ten buckets.3.2. Thermal SensitivityThe second task is to understand the effect of outdoor temperature on the electricityconsumption of each household. The simplest approach is to fit a least-squares regression line to the consumption-temperature scatter plot. However, in climates with acold winter and warm summer, electricity consumption rises when the temperaturedrops in the winter (due to heating) and also rises when the temperature rises in thesummer (due to air conditioning). Thus, a piecewise linear regression model is moreappropriate.We selected a recent algorithm from [Birt et al. 2012] for the benchmark, to whichwe refer as the 3-line algorithm. Consider a consumption-temperature scatter plot fora single consumer shown in Figure 2. The actual data points are not shown, but a pointon this plot would correspond to a particular hourly consumption value and the outdoortemperature at that hour. The upper three lines correspond to the piecewise regressionlines computed only for the points in the 90th percentile for each temperature valueand the lower three lines are computed from the points in the 10th percentile for eachtemperature value. Thus, for each time series, the algorithm starts by computing the10th and 90th percentiles for each temperature value and then computes the two setsof regression lines. In the final step, the algorithm ensures that the three lines are notdiscontinuous and therefore it may need to adjust the lines slightly.As shown in Figure 2, the 3-line algorithm extracts useful information for customerfeedback. For instance, the slopes (gradients) of the left and right 90th percentile linescorrespond to heating and cooling sensitivity, respectively. A high cooling gradientmight indicate an inefficient air conditioning system or a low air conditioning set point.Additionally, the height at the lowest point on the 10th percentile lines indicates baseload, which is the electricity consumption of appliances and devices that are always onregardless of the temperature (e.g., a refrigerator, a dehumidifier, or a home securitysystem).ACM Transactions on Database Systems, Vol. V, No. N, Article A, Publication date: January YYYY.
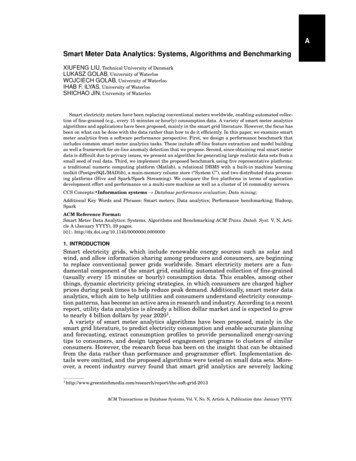
Smart Meter Data Analytics: Systems, Algorithms and oad- ‐20- ‐15- ‐10- . 2. Example of the 3-line regression model.3.3. Daily ProfilesThe third task is to extract daily consumption trends that occur regardless of the outdoor temperature. For this, we use the periodic autoregression (PAR) algorithm fortime series data from [Ardakanian et al. 2014; Espinoza et al. 2005]. The idea behindthis algorithm is illustrated in Figure 3. At the top, we show a fragment of the hourlyconsumption time series for some consumer over a period of several days. We are onlygiven the total hourly consumption, but the goal of the algorithm is to determine, foreach hour, how much load is temperature-independent and how much additional loadis due to temperature (i.e., heating or cooling). Once this is determined, the algorithmcomputes the average temperature-independent consumption at each hour of the day,illustrated at the bottom of Figure 3. Thus, for each consumer, the daily profile consistsof a vector of 24 numbers, denoting the expected consumption at different hours of theday due to the occupants’ daily habits and not affected by temperature.Formally, let ydh and thd be the electricity consumption of a particular household andexternal temperature, respectively, during hour h on day d. The PAR model assumesthat the electricity consumption of a household at a particular hour of the day is alinear combination of its consumption at that hour over the previous p days (we use p 3, as in [Ardakanian et al. 2014]) and the outdoor temperature. That is, for each h fromhhh1 to 24, ydh α1 yd 1 α2 yd 2 α3 yd 3 α4 thd , where the αi ’s are coefficients determined8by the PAR algorithm . The algorithm groups the input data set by household andby hour of the day, and, for each household-hour group, computes the αi coefficientsusing least-squares auto-regression. Thus, each household is associated with 24 setsof αi coefficients, one set for each hour of the day. Finally, to compute the daily profilefor a given household, we scan its consumption and temperature time series again,and, for each consumption data point, we subtract the α4 thd term from it to obtain thetemperature-independent consumption component (i.e., the blue curve at the top ofFigure 3). We then group the temperature-independent consumption numbers by hourof the day and take the average, obtaining 24 data points that can be plotted as inFigure 3.8 Wehave shown a simple form of this equation with only one temperature term. The model we use has threetemperature variables to model the piece-wise linear relationship between temperature and consumptionshown in Figure 2.ACM Transactions on Database Systems, Vol. V, No. N, Article A, Publication date: January YYYY.
Consump,on(kWh)A:8Totalconsump,onTemperature- ofile01234567891011121314151617181920212223Fig. 3. Example of a daily profile.We include both the PAR algorithm and the 3-line algorithm (see Section 3.2) in thebenchmark despite the fact that both algorithms compute, to some extent, a household’s thermal sensitivity. The primary rationale behind this decision is that PAR and3-line achieve this at different levels of detail. PAR is designed to extract daily profiles, but it also captures a household’s thermal sensitivity through the α4 coefficient,and, more generally, through the autoregression coefficients associated with exogenous temperature variables. On the other hand, 3-line provides a finer level of detailby computing suitable switching points between the individual regression lines, whichcorrespond to heating and cooling setpoints, and which PAR assumes to be part of theinput (recall Footnote 8). Furthermore, since the cooling and heating gradients in 3line (recall Figure 2) are only based on electricity consumption values above the 90thpercentile, they provide a better indication of the occupants thermal sensitivity: datapoints with high consumption values correspond to times when the occupants are athome and active. Another reason to include both PAR and 3-line in the benchmark isthat they represent different workloads, one using autoregression and the other usingordinary linear regression.3.4. Similarity SearchThe next task is to find groups of similar consumers. Customer segmentation is important to utilities: for instance, they can determine how many distinct groups of customers there are and design targeted energy-saving campaigns for each group. Ratherthan choosing a specific clustering algorithm for the benchmark, we include a moregeneral task: for each of the n time series given as input, we compute the top-k mostsimilar time series (we use k 10). The similarity metric we use is cosine similarity.Let X and Y be two time series. The cosine similarity between them is defined as theirX·Ydot product divided by the product of their vector lengths, i.e, X Y .ACM Transactions on Database Systems, Vol. V, No. N, Article A, Publication date: January YYYY.
Smart Meter Data Analytics: Systems, Algorithms and BenchmarkingA:93.5. On-Line Anomaly DetectionThe final algorithm, and the only on-line algorithm in our benchmark, performsanomaly detection. The previous four algorithms build consumption models and extract consumption patterns from a historical data set. In contrast, anomaly detectionis performed on one day of data at a time. Below, we present an anomaly detectionframework for smart meter data and discuss how we implemented the framework inthe proposed benchmark.3.5.1. Anomaly Detection Framework. We focus on two categories of anomalies. If the electricity consumption of a particular household today is significantly different from itstypical consumption in the past, we flag a self-anomaly. If the consumption today issignificantly different from the average consumption within the household’s group today, we flag a group-anomaly. In this paper, we define a group in a spatial sense asthe neighbourhood of the given household. However, there are other reasonable definitions, such as clustering the households based on their daily profiles, with each clusterforming a group of households that have similar daily habits. From the point of view ofa performance benchmark, the precise definition of a group is not relevant: we assumethat we are given a data set containing each household ID and its group number.The idea is illustrated in Algorithm 1, which runs at the end of each day. In line 2, y contains the 24 hourly consumption measurements for a particular household, callit s, for the current day. In line 3, we compute 24 predicted consumption values for s,one for each hour (we will discuss how to do this shortly). In line 4, we compute theaverage consumption for each hour of the current day for all the households belongingto the same group as s. Then, in lines 5 and 8, we check for self and group anomalies,respectively, by computing the distance (i.e., the norm of the difference vector) betweenthe current day’s consumption vector y and the predicted consumption vector and current day’s average group consumption, respectively. We will discuss how to computethe anomaly thresholds τs and τs0 shortly.In this paper, we assume that anomaly detection runs every day over the last 24hourly measurements. However, Algorithm 1 can easily be adjusted to run at higherfrequencies if higher-frequency data become available, or to use a sliding window ofthe most recent values rather than running at the end of each hour or day. If using asliding window, it may help to pre-compute and store y i ŷ i and y i g i for each timepoint i within the current window. This will allow k y ŷk and k y g k to be re-computedincrementally when the window slides.3.5.2. Instantiation of Anomaly Detection Framework. We implemented line 3 of Algorithm 1using the PAR model from Section 3.3. To predict the hourly electricity consumptionfor a day for a given household, we need the following information: the αi coefficients ofthe PAR model for this household, the
2.1. Smart Meter Data Analytics Two types of smart meter data sets have been studied: whole-house consumption read-ings collected by conventional smart meters (e.g., every hour) and high-frequency con-sumption readings (e.g., one per second), coming from the whole house or an individual circuit, obtained using specialized load-measuring hardware.