Transcription
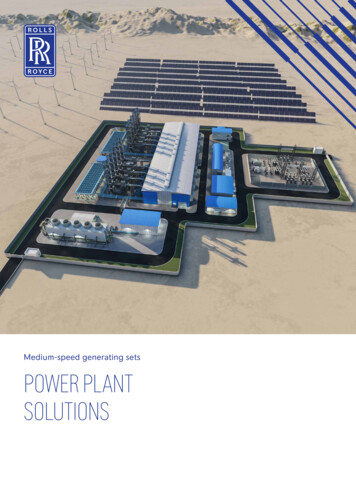
ARPA-E Alternative Power PlantCooling WorkshopJames Klausner, Program Director ARPA-EARPA-E Water Tech Team: Amul Tevar, Geoffrey Short,Bahman Abbasi, Sukrit Sharma, and Dan MatuszakHotel ChicagoChicago, ILMay 12, 2014
Presentation TopicsIFraming the ProblemII Programmatic ObjectivesIII Transformative Technology SolutionsIV Proposed Performance Targets2
Framing the Problem
Water as a Global Problem More than 1.1 billion people across the globe currently lackaccess to safe drinking water Fresh water supplies are declining while populations areincreasing United Nations predicts that by 2027 one third of the worldwill face water scarcity problems 70% of global fresh water demand is used for agriculture It is estimated that 15-35% of irrigation practices worldwideare unsustainable due to pumping ground water aquifersfaster than they can recharge International Food Policy Research Institute predicts 120%increase in food prices by 2025 due to fresh water shortages4
Energy/Water as a U.S. Problem 41% of freshwater drawn in the U.S. is forthermoelectric power plant cooling 3% of cooling tower water load is evaporated anddissipated Warming trend and over-pumping of natural waterbodies places water cooling for thermoelectricpower production at risk Desalination technologies in water stressedregions are energy intensive Water demand for fossil energy exploration andproduction is increasing Agricultural runoff water is damaging eco systemsand is increasingly regulated5
Majority of U.S. Fresh Water Withdrawal is forCooling Thermoelectric Power PlantsWithdrawal (2005, US)197 billion m3 annual withdrawal for thermoelectric power22 billion m3 withdrawn for cooling towers, 5 billion m3 dissipated287 m3 water required per metric ton of potatoes produced17.4 Mtons of potential food production dissipated (more than 5 times world annual yield of potatoes)6
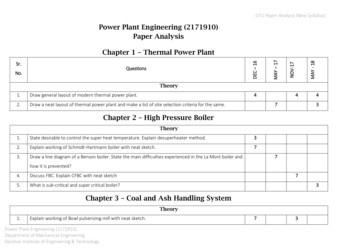
U.S. Power Plant Infrastructure is HeavilyReliant on Water Cooling99%1% 1%7
Current Trends in Consumption, Population Growth, andClimate, Create Barriers for Power Plant Water Cooling Lack of water availability/drought/population growth– Regional problems (FL, TX, CA) Rising water temperature and effluent temperature limits– Curtailed production for existing plants– Permitting restrictions for new plants– EPA 316a – thermal discharge limits Other Regulations– EPA 316b putting more difficult requirements on oncethrough cooling systems8
Lack of Water Availability/Drought9
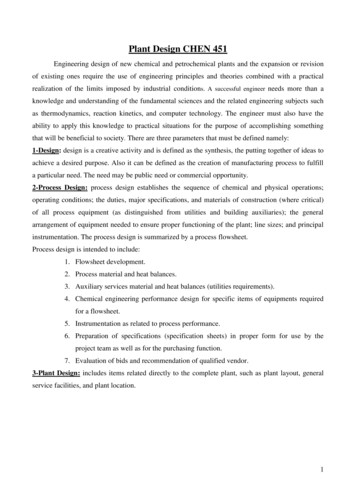
Inches of precipitationDrought Vulnerability Impacts Regional FoodProduction2013 precipitationAlmond Farm , February 25, 2014 inTurlock, California.At ARPA-E:10
Current Challenges in Water Supply ImpactingRegional Power Production11
Current Challenges in Regional Water SupplyImpacting Power ProductionAug ‘12: Water temperatures were the warmestsince operations began in 1970. Temperature ofthe intake cooling water was too high andexceeded technical specifications of the reactor.A nuclear reactor was shut down. loss of 255,000megawatt-hours of power, worth several milliondollars in lost production12
Current Challenges in Regional Water SupplyImpacting Power ProductionJuly 2012: Four coal-fired power plants and fournuclear power plants requested permission toexceed their permitted water temperaturedischarge levels13
Current Challenges in Regional Water SupplyImpacting Power ProductionSummer 2011: Consecutive days of triple-digitheat and record drought resulted in one powerplant reducing its output14
Current Challenges in Regional Water SupplyImpacting Regional Power ProductionSummer 2010: Two generating stations had toreduce power because the temperatures of theintake cooling water were too high and did notprovide sufficient cooling for full poweroperations15
Current Challenges in Regional Water SupplyImpacting Power Production2007, 2010, and 2011: Nuclear Plant had to reducepower output because the temperature of thebody of water into which the plant dischargeswas too high to discharge--power productionfrom two nuclear reactors curtailed, in somecases for nearly two months. Cost ofreplacement power was estimated at 50 million16
Watershed Temperatures Reveal an IncreasingTrend over a 100 Year Time Frame.32 C17
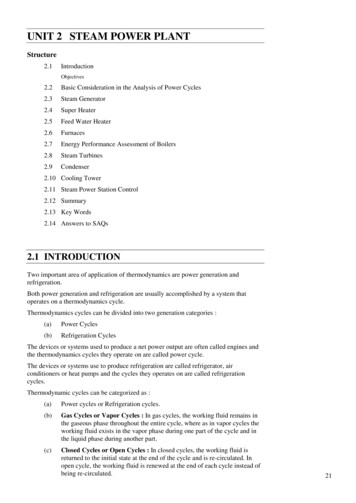
Based on EPRI Study, ARPA-E Concludes Lack ofWater Availability by 2030 Puts 3 Quads at RiskBased on Population Growth3.29 of 13.5Q electricity generation at riskPower generation (Q) vulnerability in 20300.861.223.290.257.84High/Extreme riskNo/Low riskAlready Dry CooledNo Cooling RequiredOther Undocumented or UncooledNotes/Assumptions Analysis does not yet consider projected plants – this is only existing production BAU means water supply/supply trends at 2005 levels, but population growth 1%/yr (US Census Bureau) Water use/requirements per capita remain at 2005 levels No climate change is considered18
New EPA Regulations Impose Barriers to WaterCooling for Future Power Production Rule 316(b) of the Clean Water Act requires “besttechnology available” to minimize the mortality ofaquatic life associated with power plant cooling. Approximately 2.1 billion marine lives killed peryear due to power plant intake on once throughcooling systems EPA Rule 316(b) Phase II requires 80-95%reduction in impingement mortality; will all butphase out once through cooling ( 40% of U.S.installations—550 facilities) as a viable option EPA Rule 316(a) limits water temperaturedischarge back to water source (Tdischarge 32 C)19
Peering Into the Future 2012 Northeastern University study,which considers population growth andclimate changes, predicts watershortages on a national scale by 2050 ARPA-E Commissions NortheasternUniversity to study effects of populationgrowth and climate change on wateravailability and water temperature in 4 yrincrements out to 204220
Northeastern Study Suggests that NegativeWater Scenarios Grow Into A National Problem21
Continued Reliance on Water Cooling forThermoelectric Power Plants is Risky Negative water recharge expected to grow significantly overnext 15 years More stringent EPA regulations on water intake and thermaldischarge will render once-through cooling obsolete Rising water temperatures adversely impact powerproduction and efficiency (3 C rise in condensertemperature results in 1% reduction in power production)22
Current Trends in Greenfield Power PlantCooling—Air Cooled Condensers Air-Cooled Condensers (ACCs)– Obtaining a water permit is toocostly with uncertain timeline– ACCs used as far North asCanada & Alaska; 60 TotalACCs units in USACC installation in California Lower Power Conversion Efficiency– ACCs result in 1-5 % loss ofpower output from turbine– CO2 emissions/kW-h increase Maintenance– Issues with wind loading, fanfailure, fan noise, corrosion, &leakage persist23
Programmatic ObjectivesAlternative Power Plant Cooling Program ObjectivesDevelop transformative power plant cooling technologiesthat enable:I. Zero water dissipation to the atmosphereII. No loss of power production efficiencyIII. Compliance with EPA Rule 316(b) Phase II24
Transformative Technology Solutions
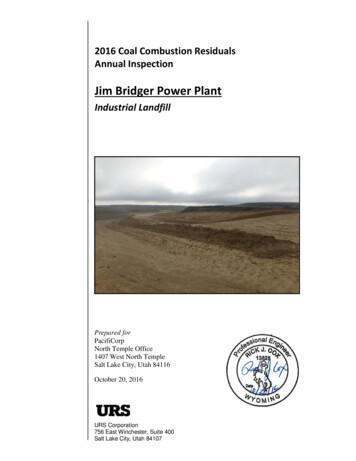
Importance of Sink Temperature to Steam PowerProductionLower sink temperature allows more work to be extracted fromturbine, which yields higher cycle efficiencyTurbine back pressureis defined by the sinktemperature26
Why Not Cool With Air? Challenge 1: higher capital cost since more HX area required𝑞 𝑈𝐴 𝑇𝐿𝑀1 𝑈𝐴1 ℎ𝐴𝑅For forced air, h 10 – 100 W/m2KFor water, h 500 – 10,000 W/m2K Convection heat transfer coefficient for water is several orders of magnitudehigher than air. Significantly more heat transfer area required for air cooled HX Challenge 2: temperature of air is variable and often above thedesign pointDraft – Official Use Only27
Lost Power Production due to BackpressureAbove the Turbine Design Point (El Paso, TX)EPRI study comparing Air Cooled Condenser vs Cooling Tower Retrofit28
What is Wet Bulb Temperature? What isAttractive About Cooling Towers? Wet bulb temperature is the watertemperature that can be achieved byevaporating into and fully saturatingsurrounding ambient air Cooling towers provide an inexpensivemeans for cooling water below ambient airtemperature29
Air Cooled Condensers are Used on a LimitedBasis30
Drawbacks with Air Cooled Condensers High cost (up to 5 timesgreater than wet coolingtower systems) due to largesize and poor heat transfer Approximately 9% increasein LCOE Lower power conversionefficiency Finned surfaces susceptibleto freezing during winterCourtesy of Jessica Shi; EPRI A-Frames are susceptible tohigh wind loading Higher maintenance costs31
Higher Costs Associated with Air CooledCondensersComparison of annualized costs for wet and drycooled power plant systems in various climatesLower heat transfer coefficient: more HX area required Higher annualized capital cost Higher maintenance cost Heat transfer coefficient can beincreased by higher velocities; morefan power requiredUsing dry bulb temperature in lieu of wetbulb temperature Decreased performance results inlost power cost8-10% increase in LCOE with ACChttp://www.nrel.gov/docs/fy06osti/40163.pdf32
Air Pumping Imposes a Parasitic LoadFan efficiency falls off significantly awayfrom the design pointCourtesy of Jessica Shi; EPRI33
Indirect Dry Cooling in Stages: Air, Absorption, &Radiative Cooling Meets Programmatic Objectives34
Different Climates May Require DifferentSolutions35
Transformational Air Cooled HX Concepts Low cost air cooling strategies that significantly increase air side heat transfercoefficient without increasing pressure drop Efficient forced draft technologies coupled to natural draft36
Transformational Absorption Cooling ConceptsWaste heat capture from the stack and absorptioncooling systems with high COPDraft – Official Use Only37
Transformational Radiative Cooling ConceptsHigh performance radiant coolingcoatings and associated technologies38
Advanced manufacturing to enable low costAdvanced manufacturing technologies to fabricate transformational designs atthe MW scale with low cost39
Proposed Performance Targets
Structures for Air Side Heat TransferEnhancementUS Patent 20120261106 A1Non-Isotropic Structures for HeatExchangers and ReactorsHeat transfer augmentation forflow through channel withdimpled surfaceFor Re 1000, Nu/Nusmooth 2.1f/fsmooth 1.5Factor of 9 increase in volumetric heat transferclaimed with 1/3 the pressure drop compared withconventional radiator3D Printed HXJohn Kelly, Altex Technologies, 201241
Challenge to Thermal Engineering andManufacturing CommunitiesReimagine how an air-cooled heat exchangeris configured to give significantly higher heattransfer rate and reduced pressure dropa. high fidelity CFD tools to guide flowpaths and wall structuresb. highly scalable designs areessential to meet programmatic goalsc. low cost materials of constructionBridging the GapThermalEngineeringManufacturingIdentify manufacturing techniques that areavailable or need to be developed to enablethe low cost fabrication of the heat exchangera. additive manufacturingb. ultrasonic weldingc. high temp brazing, vacuum brazingd. precision stampinge. laser milling Encourage team buildingbetween Thermal Engineeringand Manufacturingcommunities42
Transformative Advancement in Air burn0.15Increasing St0.10.05000.020.040.060.080.1StPr2/3𝑆𝑡 ℎ𝜌𝑈𝐶𝑝𝑓𝜏𝑤 2 𝜌𝑈 2(Fanning)43
ARPA-E Heat Exchanger Design andTechnoeconomic AnalysisNo Design—pressure dropassumedSupplementalCooling UnitLouvered Fin HXDesign ModuleSteam CondenserDesign ModuleAir CooledHeatExchangerSteamCondenserQ 711 MWthT 15 CModel Assumptions NETL Case 9 subcritical PC plant, 550MWe Use existing steam condenser (Tsat 38 C; Tcold, in 15 C) Original evaporative cooling system replaced by ARPA-E cooling scheme No changes to balance of plant operation 11,000 kg/s circulating water mass flow rateIs there a solution with no increase in LCOE?44
Allowable Capital Cost for SupplementaryCooling Unit with No Change in LCOE & 2% Analysis Based on Standard Louvered Fin Air Cooled HX with Natural Draft Supplement LCOE 0 With standard louvered findesign, and no change in LCOE,no solution exists whereallowable supplemental coolingcosts are positive NOT REALISTIC! LCOE 2% Air cooled HX with reasonableEffectiveness will be least costHT equipment; do as muchcooling with air cooled HX aspossible45
Allowable Capital Cost for SupplementaryCooling Unit and No Change in LCOESupplemental Cooling 4 CStandardLouveredFinSt kStlouvered A:k 1, B:k 2, C:k 3, D:k 4, E: k 5, F 7, G 10IncreasingSt NumberStPr2/3 Point G allows approximately 8 Mfor supplemental cooling or 50/kWth In comparison air cooling HX, 47/kWth or 28/m246
Allowable Capital Cost for SupplementaryCooling Unit and 2% Increase in LCOESupplemental Cooling 4 CSt kStlouvered A:k 1, B:k 2, C:k 3, D:k 4, E: k 5, F 7, G 10 Point E allows approximately 30 Mfor supplemental cooling or 150/kWth In comparison air cooling HX, 47/kWth or 28/m2Air Cooled HX Performance MetricsI.St 5 St louveredII. Cost 47/kW47
Absorption Cooling with Waste Heat From FlueGas Heat capture from stackcomplicated by H2SO4formation and possible CO2capture 30-50 MW waste heat available instack at T 170 C, assuming a dewpoint of 150 C (500 MW Plant)𝐶𝑂𝑃 � 𝑖𝑛 e MetricsI.COP 2II. Tcold 15 CTregen 150 CII. Cost 150/kWcooling48
Surface Coatings to Create Selectively SpecularSurfaces Selectively specular surface createdby depositing silicon nitride onaluminumLiang et al., Solar Energy, 200249
Ideal Surface CoatingIdeal spectral reflectance1 SpectralReflectivityVisible Ideal surface absorbs and emitswithin infrared band and reflectsall other incident radiationq”w,max 260 W/m20401 Wavelength, m*Assumes no convection at the surfaceT1 20 CT2 -50 C50
Low Cost Sky RadiatorSolar ShadeWater OutSelectiveSpecularReflector To dissipate 60 MW with T 5 C, 48,000 2 x 4 m2radiators requiredRadiationToPerformance MetricsSkyI. Heat Flux q” 150 W/m2 daytimeII. Heat Flux q” 200 W/m2 night timeIII. Cost 30/m2 (economies of scaleto aid low cost constraint)Water In51
Efficient Forced Draft Air PumpingVariable Pitch/Variable Speed FanTechnologyPerformance MetricsI. Fan Efficiency fan 80% over fullrange of flow rates and fan speedsII. Cost 265/m3/s full capacity52
Can Coatings of HT Surfaces Prevent Corrosionand Fouling?High speed soap coating of nanomaterials‣ Vacuum-free, atmospheric method to deposit materials fromsolution– 1.2 m of material/s coated with 4 nm thicknessZhang et Al, Scientific Reports, vol 3, 1477, 201253
ARPA-E Funded Direct Contact Air Cooling withHygroscopic Fluid - EERC North Dakota; Open FOA54
100 kW Prototype Testing RequirementRequirement for Prototype Testing All ARPA-E thermal performance requirements must bedemonstrated at a scale of 100kW or greater3-D Printed HeatExchanger55
ARPA-E Program Merit Questions—Analogousto DARPA Heilmeier QuestionsI. What is the problem is to be solved?II. If successful, how will the proposed program advance the ARPA-E mission? Whywill it matter?III. What are the program goals and how will progress towards those goals bemeasured?IV. What is the current state of R&D in this area and how is the proposed programapproach transformative and disruptive relative to that state?V. What are the critical scientific and engineering breakthroughs needed to assureprogram success?VI. What research communities need to be brought together to create researchteams to address the program goals? Is there a critical mass of experts to make theprogram successful?56
Let’s Have a Productive Workshop! Use this opportunity for networking and team building Competitive teams will have expertise in both thermal fluidengineering and manufacturing Use this opportunity to guide high level programmatic framing of theproblem1. Is ARPA-E targeting the appropriate performance metrics?2. Ideas on how to use techoeconomic analysis What scientific, engineering, and technology advances are requiredfor programmatic success? Cordial frank debate is encouraged! Do you have any new ideas that can meet programmatic goals thathave not been discussed? Please do not waste time telling ARPA-E we are CRAZY; it is alreadywell documented57
ARPA-E ergy.gov58
Challenges and paths forward‣ Challenge 1: Lower heat transfer coefficient for air systems‣ ARPA-E Approach: Target increase of 3X in air side heat transfer‣– Leverage advances in thermal science [EPRI/NSF program]– Combine with advanced manufacturing to realize new designs at lowcostEffect: less area required, so capital and maintenance costs decrease‣ Challenge 2: Dry bulb temperature vs wet bulb temperature‣ ARPA-E Approach: Develop low cost cooling systems that can go‣downstream of the air cooled heat exchanger– Absorption cooling– Radiative coolingEffect: return water cooled to the design point, so no decrease in turbineperformanceDraft – Official Use Only59
Result – air cooled systems have higher costsDraft – Official Use Only60
Temperature of the return water determineswhether the turbine will experience backpressureDraft – Official Use Only61
Previously funded work by DOEEntityObjectiveAmount/ AgencyDateU. North DakotaAir cooled device for power plants472,586ARPA-E2012ResearchTriangle Inst.Develop and demonstrate an advanced, energy-efficienthybrid membrane system that enables the reuse of more than50% of a facilities wastewater4,800,000EERE2012
Framing the opportunities –ARPA-E approach
Program visionRetrofit cooling tower with ACHXDevelop downstream cooling technologies to get past dry bulb limit andavoid turbine backpressureDraft – Official Use Only64
Where’s the whitespace?Draft – Official Use Only65
Our analysis demonstrates that this is feasibleDraft – Official Use Only66
And drives performance and cost targets in FOA‣ More of our analysis, showing what the heat transfercoefficient needs to be to achieve energy/cost parity.‣ How many more degrees would it have to be cooled indownstream systems?‣ What would their performance and cost need to be?‣ Summary: if we achieve XYZ, this will become a viable andcompelling option for power plants – and this is how we’resetting targetsDraft – Official Use Only67
Quick side note – totally alternative approachwhich focuses on water recovery? (Seedlinglevel efforts)Draft – Official Use Only68
Sorbent vapor recovery analysis‣ Concept: retrofit cooling towers to capture vapor with adesicant and use waste heat from the stack to regeneratethe desiccant‣ Energy-mass balance to prove that this is viable‣ Economic analysis?‣ Required advancements?‣ Metrics stemming from analysisDraft – Official Use Only69
Summary of program goals and targets‣ Advanced air cooling – heat transfer performance needed.Cost‣ Downstream cooling – how many degrees? How muchcost?– Radiative cooling– Absorption cooling‣ Other track - water recovery from wet cooling systems?– Sorbents?Draft – Official Use Only70
How are we going to do this? Sampletechnology plays from workshop‣ Advanced air cooling– Microstructures to increase heat transfer on air side– High surface area thermally conducting metal foampolymers?– Ways to increase air speeds (via hyperbolic towers?)– Learning from engine cooling in aerospace industry?– Radiative cooling downstream– Absorption cooling downstream‣ Water recovery from wet cooling systems?– Sorbents?Draft – Official Use Only71
Advanced air cooling‣ Key is to get better heat transfer on air side. Better heattransfer less surface area required lower cost‣ There is substantial work going on in the thermal transportcommunity showing that adding microstructures to air-sideheat exchange surfaces can significantly enhance heattransfer through generating vortices that trip the thermalboundary layer and promote mixing (voice track this andinsert graphic)‣ ARPA-E play – leverage advanced manufacturingtechniques (for example, additive manufacturing) toenable these advanced heat exchangers at lower cost.Draft – Official Use Only72
Example advanced air cooling – TBD‣ Ari/Srinivas?‣ HRL concept?Draft – Official Use Only73
HRL: 3-D manufacturing of advanced heatexchange surfaces Manufacturingtechnique enables veryhigh area/volume ratio While heat transferproperties areexcellent, the pumpingpressure loss isuncertain and needs tobe understood74
Absorption cooling conceptDraft – Official Use Only75
Radiative cooling concept‣ Stanford coating?Draft – Official Use Only76
Program summaryDraft – Official Use Only77
FOA summary‣ Areas of interest‣ MetricsDraft – Official Use Only78
1. Some of our highest producing states will feelsignificant painThe at risk plants here are from the more conservative, freshwater-only cooled RMNINNYKYVANEWVMO0%% of total US production low to no risk% of total US production at high/extreme risk My analysis does not yet consider projected plants – this is only existing production I could generate this for the case that includes lower quality water as well – up for discussionDraft – Official Use Only79
EPRI study background‣ Rates of water use (gal/capita) in the domesticsector remain at their 2005 levels in each county‣ New electricity generation follows EIA predictions(EIA, 2009).‣ Population in the U.S. in 2030 is 32.4% higher than2000 (Census Bureau, 2008). (0.94%/yr)‣ No climate change considered‣ Changes in water use occur primarily in twosectors: municipal/domestic & TERisk Criteria for 2030– 25% of available precipitation is used– Groundwater withdrawal vs total withdrawal 25% (based on current groundwater withdrawal)– Summer deficit 10 inches, and this water requirement must be met through storedsurface water, groundwater withdrawals, or transfers from other basins.– 2030 freshwater withdrawal is 20% higher than 2005 level– 2030 Summer deficit is 1 higher than 2005Draft – Official Use Only80
1. Northeastern data to add climate changeeffects, and allow us to analyze pump/treatModeled various combinations of population growth &climate change scenarios to predict future water issuesGaps: Data is not in readilyaccessible format (ArcGis) Temporal resolution is toocoarse (decadal avgs) Supply not directlycompared with demand Uncertainty not well defined Excesses not shownParish, E. S., Kodra, E., Steinhaeuser, K., &Ganguly, A. R. (2012). Estimating future globalper capita water availability based on changes inclimate and population. Computers &Geosciences, 42, 79-86.Draft – Official Use Only81
Vulnerability assessed nowDraft – Official Use Only82
Once ThroughCooling TowerDraft – Official Use OnlyDry 81934193019261922Cumulative number built (not necessarily total in service)Cooling system constructed earOther83
9. Distribution of WATNDENDHINHORMEMTRIIDSDVTAKDCCooling systems120StateCooling towerDry cooling & hybridDraft – Official Use OnlyOther284
9a1. EPRI- plant types, sizes in USDraft – Official Use Only85
9a2. EPRI – new plants through 2030Draft – Official Use Only86
9a3. DOE Report – TE plant location and coolingtypeDraft – Official Use Only87
9b. EPRI - Water withdrawals for thermoelectricgeneration (fig 2-5b)Draft – Official Use Only88
9c. EPRI – distribution of cooling technologyDraft – Official Use Only89
9d. USGS - Water withdrawals for thermoelectricpower by stateDraft – Official Use Only90
9e. USGS - Water withdrawals for thermoelectricpower by state and water typeDraft – Official Use Only91
11. Another challenge relates to permittingissues due to water availability*Working to understand these better
13. Example of area (Colorado River Basin) wherewater use is approaching/exceeding supplyDraft – Official Use Only93
20. Changes in LCOE from retrofitting TE powerplants to dry cooling/non-potable (lowest cost)Next steps: Internal analysis to better understand this and integrate with future scenarios to assess vulnerabilityDraft – Official Use Only94
20. Costs of retrofitsDraft – Official Use Only95
Least cost retrofit distributionEvident in this map is that the brackish groundwaterretrofits are largely limited to the Southwest, Texas,and Oklahoma. In contrast, wastewater and drycooling retrofits are relatively evenly distributed overthe entire country. However, a little closer inspectionreveals that many of the wastewater retrofits are colocated with metropolitan areasIn 180 of the 209 cases where dry cooling was theleast cost alternative, dry cooling was the only optionavailable to the plant (wastewater and brackishgroundwater supply were insufficient in that locationto meet power generation demands).Total parasitic energy requirements are estimatedat 140 million MWh, or roughly 4.5% of the totalproduction from the retrofitted plants. Of thisparasitic energy loss 118 million MWh are due toefficiency losses with dry cooling retrofits, 12million MWh are the result of retrofits torecirculating cooling, and 10 million MWh are lostto pumping and treating water.Draft – Official Use Only96
Least cost retrofitWhen considered on a plant levelbasis brackish groundwater is onaverage 1.35/MWh moreexpensive than a wastewaterretrofit. In terms of capital costs,the wastewater retrofit is leastexpensive (average capital costsof 11.9 million), then brackishgroundwater (average capitalcosts of 13.8 million), followedby a retrofit to dry cooling(average capital costs of 114.5million). However, O&M costs forbrackish water treatment arehighest among the three optionsDraft – Official Use Only97
EPA report on energy penaltiesDraft – Official Use Only98
EPA – Energy penaltiesDraft – Official Use Only99
EPA - Energy penaltiesDraft – Official Use Only100
EPA – Energy penalties and tempsDraft – Official Use Only101
EPA – Energy penaltiesDraft – Official Use Only102
EPA – Cooling tower designsContinues in document Draft – Official Use Only103
EPA – Air Cooled Condensors installedContinues in document Draft – Official Use Only104
EPRI – Energy penaltiesDraft – Official Use Only105
EPRI – Energy penaltiesDraft – Official Use Only106
EPRI – steam condenser specs and costsDraft – Official Use Only107
EPRI dry cooling sites and estimatesDraft – Official Use Only108
EPRI – Dry cooling costsDraft – Official Use Only109
EPRI – range of cost of waterDraft – Official Use Only110
EPRI – site temps and characteristicsDraft – Official Use Only111
EPRI – performance of ACC at site 1Draft – Official Use Only112
EPRI – costs for ACC at site 1Draft – Official Use Only113
EPRI – optimized wet cooled at each of the 5sitesDraft – Official Use Only114
EPRI – ACC is currently 3.5X to 4.5X the cost ofwet cooled across range of environmentsDraft – Official Use Only115
EPRI – breakeven cost of water somewherearound 2 to 3/kgalDraft – Official Use Only116
Hightower presentationDraft – Official Use Only117
DOE/Argonne – location informationDraft – Official Use Only118
DOE/Argonne – location informationDraft – Official Use Only119
DOE/Argonne estimate of energy penaltyDraft – Official Use Only120
Burns and Michelelli – cooling trendsDraft – Official Use Only121
Burns and Micheletti – dry bulb to backpressurerelationshipDraft – Official Use Only122
Dry cooling economic benefits and challengesBenefitsChallengesFlexibility in location – could be putcloser to end use/customerLower efficiencySaves waterUpper temp limited by backpressurelimits of turbines (perhaps turbineredesign)Plume abatementFans and other parasiticsAvoids water regsGreater footprint (but, higher surfacearea to volume ratio?)Ambient temp has higher variabilityDraft – Official Use Only123
The US total water withdrawal was 400BG/d;total freshwater withdrawal was 330BG/d (2000)
Not an emissions play – water vapor from powerplantsDraft – Official Use Only125
Name ofPlant /CompanyTypeLocationMillstoneNuclearWaterford, CT2012 CoolingNuclearOil/gasextractionBraidwood, ILCoolingOil/gas2012 productionHydroOil/gasextractionCAGrand DamHydroKS, TX, PA, NDNVNV Energy etailsOne reactor shut down because water from Long Island Sound was toowarmNeeded to obtain special permission to operate with cooling water pond4 degrees above normal limit2011 GenerationDenied access to water for at least six weeksReduced snowpack in Sierra Nevada reduced power generation by 38%compared to previous summerBanned use of city water for hydraulic fracturing during certain droughtconditions2010 GenerationInsufficient hydro generation associated with drought resulted in 164mloss in FY20102010 GenerationPlant2009 constructionCapacity reduced by 23%Abandoned a plan for a 1500MW power plant that would have used1.7m gal water/hr2007 GenerationSevere drought reduced hydro generation in the Southeast by 45%2012 Generation2006 GenerationPlant2002 constructionPlant2002 constructionPower production reduced by 50%Moratorium on installation of new merchant power plants because ofcooling constraintsArizona rejected permitting for proposed power plant because of impactto local aquiferEPA mandated a 94% reduction in water withdrawal, replacing seawater2004Coolingwithfreshwate
International Food Policy Research Institute predicts 120% . 41% of freshwater drawn in the U.S. is for thermoelectric power plant cooling 3% of cooling tower water load is evaporated and dissipated Warming trend and over-pumping of natural water bodies places water cooling for thermoelectric