Transcription
Box-Jenkins (ARIMA)“All models are wrong, but some are useful.”- George Box
Box-Jenkins (ARIMA)Pros:5-2 Outperforms exponential smoothing models for certain types ofdata. Are appealing because of their optimality (under certainassumptions) and the comprehensiveness of the family ofmodels. Are adaptive and can model seasonality. Are backed by a long and carefully worked out statistical theory.Are extendible to using multiple dependent and independentvariables.Can be automated.
Box-Jenkins (ARIMA)Cons:5-3 Manual identification is difficult and time consuming. Identification and estimation can be badly distorted by outliereffects. ARIMA may be difficult to explain to other because many of themodels have no structural interpretation.Models that may perform similarly on the historical data may yieldquite different forecasts.
ARIMA vs. Exponential SmoothingThe Similarities Both are extrapolative methods. Both are adaptive. Both can model trends and seasonal patterns. Both are practical approaches when large numbers of forecasts must be prepared (i.e.model selection and fitting can be automated). In certain cases, both give the same forecasts.The Points of Departure5-4 ARIMA models are based on autocorrelations while exponential smoothing is based on astructural view of the data that can include level, trend, seasonality and events. ARIMA models are linear, exponential smoothing includes both linear and nonlinearmodels. Exponential Smoothing attempts to estimate the trend as part of the modeling process.ARIMA attempts to eliminate the trend before modeling the autocorrelations.
Corporate Use of Box-JenkinsHistorically Box-Jenkins techniques have not enjoyed widespread use incorporate America.This is largely due to the difficulty of model identification using the strategyoriginally proposed by Box and Jenkins. This strategy required considerablestatistical skills and was extremely subjective.Today's automatic identification strategies routinely outperform human experts.This is confirmed by testing with the M-competition data, results from the M-2 andM-3 competitions, and a study published in the American Statistician.Business oriented software incorporating automatic model identification hasbrought ARIMA into more widespread use.5-5
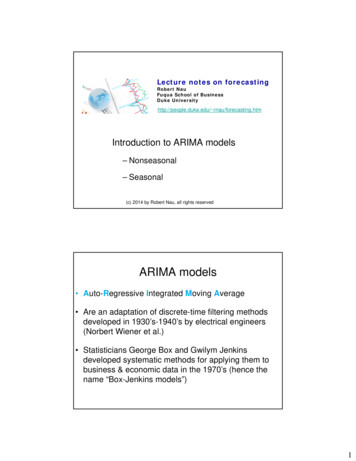
Box-Jenkins Lens on the WorldACF BJ tForecastsFamily of ModelsARIMA(p,d,q) * (P,D,Q)(Yt)Real World Process5-6
ARIMA (p, d, q) ModelARIMA(p, d, q) Order Orderof AR of MA Order of"differencing"ARIMA: Autoregressive, Integrated, Moving Average Integration reverses the differencing done to obtain stationarity.Seasonal ARIMA ProcessARIMA (p, d, q) * (P,D,Q) Seasonal AR, differencing and MA terms.5-7
3 Steps to Building an ARIMA Model1.IDENTIFICATION: The first step is to identify the model, i.e. to select p, dand q. One can use the traditional Box-Jenkins approach or use anautomatic algorithm.2.ESTIMATION: The parameters are then estimated by fitting to the data.Box-Jenkins use the method of unconditional least squares. The resultingmodel is then used to obtain diagnostics of the fit to the data.3.VALIDATION: If the model diagnostics are acceptable, then identificationis confirmed, and the fitted equation can be used to compute forecastsand confidence limits.5-8
Manual Identification ProcedureThe Box-Jenkins text describes a model identification procedure based uponvisual examination of the autocorrelation and partial autocorrelation functions.This highly subjective procedure is difficult, time consuming and often leads tosub-optimal models. In short, the procedure is severely flawed.The automatic identification procedure in Forecast Pro has been comparedto the manual procedure many times and has always substantiallyoutperformed the manual procedure in terms of forecast accuracy. Thesecomparisons include a study performed by Spyros Makridakis using theMakridakis 111 series and a study published in the American Statistician.5-9
Box-Jenkins: ManualModel Identification Identification of an ARIMA (p, d, q)*(P, D, Q) model consists of selecting the model orders. The Box-Jenkins text describes an identification procedure whereby the user examines variousgraphs (ACF & PACF) to determine the model orders. This method is extremely subjective. The "correct" model should capture all of the correlations present in the data and leave random(uncorrelated) errors- need to check the error autocorrelation function and the Ljung-Box test It is not uncommon to find more than one Box-Jenkins model that yields uncorrelated errors buthave very different forecasts5-10
Box-Jenkins- AutomaticModel Validation If an automatic algorithm is used, within-sample statistics and correlation functions are notusually scrutinized. It is good practice to examine forecasts visually. Accuracy can be measured via out-of-sample or hold-out sample performance.5-11
Advantages and Disadvantages of ARIMAThe principal advantages of ARIMA are its optimality (under certain assumptions) and thecomprehensiveness of the family of models. In the M-2 study, on an aggregate basis, 45%of all data was best suited for ARIMA models.There are more disadvantages than advantages, but the advantages may still outweighthem. Manual ARIMA identification is difficult and time consuming. Many of the modelshave no structural interpretation. ARIMA may be difficult to explain to others. Identification and estimation can be badly distorted by outlier effects. Models that perform similarly on the historical data may yield quite differentforecasts.On balance, we feel that adoption of ARIMA forecasting by corporations depends uponautomatic identification strategies that outperform experts and that outperform exponentialsmoothing.5-12
Extensions of the ARIMA Model ARIMAX or Transfer Function ModelP(z) d Yt Q(z) t R(z) Xt MARIMA ModelMultiple endogenous variables. MARIMAX ModelMultiple input, multiple output. Intervention ModelARIMAX in which the inputs consist of step and impulse functions. These canaccount for such effects as competitors entering a market, strikes, etc.These intervention effects can be processed dynamically in a variety of ways.5-13
Appendix5-14
Transforming to StationarityNonstationary feature5-15TransformationChanging MeanDifference once (d 1)Changing TrendDifference twice (d 2)HeteroscedasticityBox-Cox transformationDeterministic ComponentRemove deterministiccomponent beforeanalysisChanging StructureNonstationarity may betoo deep to remove
Autoregressive ProcessThe dependence of the current value Yt on lagged values is called an autoregressive(AR) process.The AR(p) Autoregressive Process:Yt a1Y t-1 a2Y t-2 . apY t-p tThe AR process relates the current value to its own previous p values “p” is called theorder or memory of the AR process.OrderAR ProcessAbbreviationp 1Yt a1Y t-1 tAR(1)p 2Yt a1Yt-1 a2Yt-2 tAR(2)Low order AR models are intuitively appealing as descriptions of nature. Much ofclassical physics can be written as low order differential equations.5-16
Moving Average ProcessThe relation of the current value Yt to previous forecasting errors is called a moving averageprocess.MA(q) Moving Average process:Yt t - B1 t-1 - b2 t-2 - . – bq t-qThe MA process relates the current value to the previous q errors. “q” is called the order ormemory of the moving average process.OrderMA ProcessAbbreviationq 1Yt t - b1 t-1MA(1)q 2Yt t - b1 t-1 - b2 t-2MA(2)MA models are not intuitively appealing as descriptions of nature. Instead, they tend to occur asa result of the aggregation of errors, as when we aggregate individual products into groups,stores into chains, months into quarters, etc.5-17
ARIMA ProcessAn ARIMA(p,d,q) model can include any combination of differencing,autoregressive, and moving average components. For example:ARIMA (1,0,1)Yt a1Yt-1 t - b1 t-1ARIMA (2,0,1)Yt a1Y t-1 a2Y t-2 t - b1 t-15-18
Automatic Identification Procedure1.Determine whether a power transformation is required by performing arange-mean test.2.Establish the order of differencing d by applying the augmented DickeyFuller test.3.Fit a state space model to establish the largest ARIMA(p,d,p) to consider,and to obtain approximate coefficient values for all nested ARIMA models.4.Try all these nested ARIMA models up to and including ARMA(p,d,p) andcalculate the approximate BIC for each.5.Select the nested ARIMA(p,d,q) model which minimizes the approximateBIC.5-19
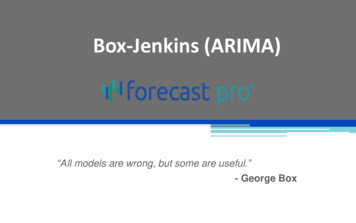
The BICForecastingErrorBICParameter Variance ErrorFit Set ErrorNumber of ParametersThere are several equivalent forms for the BIC. The most convenient isBIC s2T(n/T)wheres2 is the estimated within-sample error,n is the number of fitted parameters andT is the number of sample data points.The BIC is a model selection criterion that balances a reward for goodness-of-fit with a penalty formodel complexity. The BIC is used to compare different models from the same model family. Themodel that minimizes the BIC is likely to provide the most accurate forecasts. Since it is scaled tothe standard forecast error, the BIC can be very loosely interpreted as an estimate of out-ofsample forecast error.5-20
Office Hours If you have any questions regarding the topics covered in this section,please drop by during office hours! If you do not have the current office hours schedule, please emailinfo@forecastpro.com.3-21
5-2 Box-Jenkins (ARIMA) Pros: Outperforms exponential smoothing models for certain types of data. Are appealing because of their optimality (under certain assumptions) and the comprehensiveness of the family of models. Are adaptive and can model seasonality. Are extendible to using multiple dependent and independent variables. Are backed by a long and carefully worked out statistical theory.