Transcription
Program Evaluation: CorrectionsDepartment – Status of Programs to ReduceRecidivism and Oversight of MedicalServicesOctober 23, 2018Report #18-09
LEGISLATIVE FINANCE COMMITTEERepresentative Patricia A. Lundstrom, ChairwomanSenator John Arthur Smith, Vice-ChairmanRepresentative Paul C. BandySenator William F. BurtSenator Pete CamposSenator Carlos. R CisnerosRepresentative Randal S. CrowderRepresentative George Dodge, Jr.Representative Jimmie C. HallRepresentative Larry A. LarrañagaSenator Carroll H. LeavellSenator Howie C. MoralesSenator George K. MunozSenator Steven P. NevilleRepresentative Nick L. SalazarRepresentative Jim R. TrujilloDIRECTORDavid AbbeyDEPUTY DIRECTOR FOR PROGRAM EVALUATIONCharles SalleePROGRAM EVALUATION TEAMAmir ChapelJon R. Courtney, Ph.D.Sarah M. Dinces, Ph.D.Nathan Eckberg, Esq.Jenny Felmley, Ph.D.Micaela FischerBrenda Fresquez, CICAMaria D. GriegoBrian HoffmeisterClayton LobaughTravis McIntyre, Ph.D.Alison Nichols
Table of ContentsExecutive Summary 1Key Recommendations .2Background . 4Findings and Recommendations . 6Recidivism Reduction Programs are Evidence-Based, but Need to be Tracked forUtilization and Outcomes.6Technical Parole Violations Associated With Substance Use Drive Recidivism Rates;Use of Treatment Programs is Unknown.11Health Care Contracts Incorporate Best Practices but Quality of Care isUnknown.18Agency Response . 27Appendices . 28Appendix A: Evaluation Scope and Methodology . 28Appendix B: New Mexcio Prisons . 30Appendix C: Recidivism Rates.31Appendix D: ReleaseEligible Inmates.32Appendix E: Parole and Probation Offices.33Appendix F: Professional Parole Board Qualifications.34
EXECUTIVE SUMMARYRecidivism is rising, driven by parolerevocations for technical violationsA nationwide movement for criminal justice reform has seen significantdeclines in prison populations across the U.S. in recent years, though at thesame time, New Mexico prisons have continued to grow. From 2009 to 2016,the total U.S. prison population decreased by 7 percent while the total NewMexico prison population increased by 14 percent. In FY18, the state allocated 297.3 million in general fund dollars to the New Mexico CorrectionsDepartment (NMCD) to house 7,325 inmates and supervise 19,552probationers and parolees. Ninety-five percent of these inmates eventuallyreturn to the community, and so it is essential to prepare offenders for reentryin order to improve public safety and reduce costly recidivism (the return toprison) of offenders.Since a 2012 LFC program evaluation of corrections, NMCD has implementedbest practices in several areas including using validated risk-needs assessmentsfor all inmates, developing an inventory of evidence-based recidivismreduction programs with the Pew-MacArthur Results First Initiative, andreducing the number of costly release eligible inmates by half. However, therecidivism rate in New Mexico is increasing, rising to 50 percent in FY18, an11 percent increase since FY10. Every extra percentage point of recidivismcosts the state 1.5 million per year for incarceration alone.Parole revocations for technical violations related to drug use contribute halfof the recidivism rate. Approximately one-third of prisoners admitted toNMCD are due to failed drug tests and missed appointments. It costs the stateover 40 million per year to house these revoked parolees in prison versuscommunity supervision, and there is little evidence that this improves publicsafety or addresses root causes of crime. LFC analysis found that 67 percentof parolees violate conditions at least once, 75 percent of which are for faileddrug tests and missed appointments. In total, 43 percent of parolees arerevoked and sent back to prison after an average of 2.7 violations over 372days. The average time revoked parolees spend in prison is 333 days, at a costof 30 thousand per offender compared to remaining on supervision.Parole revocationsfor technicalviolations related todrug use contributehalf of the recidivismrateNMCD changed medical providers from Corizon to Centurion for healthcare,Boswell for pharmacy, and MHM for women’s behavioral healthcare in early2016, though still faces difficulties recruiting and retaining qualified staff toprovide and oversee health services. Performance measures in the contractscomprehensively cover treatment rates but do not show whether conditions arebeing adequately managed or cured. The state has strong medical and geriatricparole statutes and policies that go underutilized, causing inmates who wouldbe better served outside prison walls to remain incarcerated.Moving forward, NMCD could improve on their success at implementing bestpractices by beginning to track how the needs of offenders are connected withservices, and evaluating the implementation and outcomes of recidivismreduction programs to ensure they are working as intended.Corrections Department – Staus of Programs to Reduce Recidivism and Oversight of Medical Services Report #18-09 October 23, 20181
KEY RECOMMENDATIONSRecommendationsThe legislature should:Consider expanding funding for transitional living to adequately househard-to-place release eligible inmates and to be used as a sanction forparole violations, but should require and expand the use of evidencebased programs at those facilitiesConsider appropriating to recidivism reduction programs as a separateline item in the NMCD budgetConsider amending the geriatric and medical parole statute to requireNMCD to evaluate inmates eligible for medical and geriatric parole andsubmit the list to the Parole Board for considerationNMCD should:Require all private prison contracts to use performance based fundingbased on recidivism reduction targets over historic recidivism rates ateach facilityCollect performance measures for the percent of COMPASrecommendations actually assigned and completedCollect performance measures for need, participation, and completionfor all recidivism reduction programsCollect performance measures for the number of reentry plansrecommending treatment/education needs and the participation andcompletion of those g/employment/treatment needs and outcomesforAccompany cost-savings from REI reduction with accompanyingjustice reinvestmentImprove case management of parolees to ensure connection to servicesand implement evidence-based STEP programs statewide (graduatedinterventions, short jail-time, etc.) to maximize attempts to divert fromfull revocationCooperate with the Department of Health to obtain access to theElectronic Health Records system being proposed to modernize healthinformation management2Corrections Department – Staus of Programs to Reduce Recidivism and Oversight of Medical Services Report #18-09 October 23, 2018
Work with state health agencies to discuss methods of incentivizinglong term care providers in the community to accept medical paroleeligible inmates to make better use of medical parole rulesCorrections Department – Staus of Programs to Reduce Recidivism and Oversight of Medical Services Report #18-09 October 23, 20183
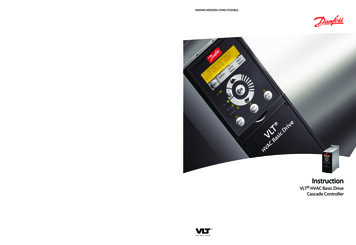
BackgroundBACKGROUNDBackgroundThe United States has the highest rate of incarceration in the world accordingto the Institute for Criminal Policy Research, with 1 in every 114 adults behindbars (1 in every 167 in prison) and 1 in every 55 adults under communitysupervision at the end of 2016, according to Bureau of Justice Statistics. Intotal, 2.6 percent of all adults are under some form of corrections supervision.In New Mexico, 1 in every 108 adults were behind bars (1 in 210 in prison)and 1 in every 103 adults were under community supervision at the end of2016. According to the Robina Institute of Criminal Law and Criminal Justice,New Mexico ranked 36th among states for prison incarceration rates and 36thfor parole supervision rates in 2014. A total of 1.9 percent of all New Mexicoadults are under some form of corrections supervision.Table 1. Top 10 HighestIncarceration Rates WorldwidePrisonPopulationCountry(per 100,000)U.S.A.655El ional trends for incarceration show a consistent decline over the pastdecade. While incarceration trends in New Mexico and the U.S. havehistorically moved in the same direction, they have moved in oppositedirections since 2007, shown in Chart 1 below. The total prison population inthe U.S. increased every single year until 2009 and has been decreasing sincethen. In New Mexico, the total prison population reached an initial peak in2007 and then declined through 2009 before increasing again. From 2009 to2016, the total U.S. prison population declined by 7 percent and the total NewMexico prison population increased by 14 percent. The FY18 general fundappropriation to the New Mexico Corrections Department was 297.3 0.0197019801990US200020100.02020NMSource: Bureau of Justice 1.51.520076.4201020132016Corrections Department – Staus of Programs to Reduce Recidivism and Oversight of Medical Services Report #18-09 October 23, 2018NM Prison Population (thousands)8.01.6Chart 1b. Trends Reverse in2007U.S. Prison Population (million)1.8Chart 1a. NM and U.S. IncarecarationTrendsNM Prison Population (thousands)U.S. Prison Population (million)Source: World Prison Brief, Institute forCriminal Policy Research
Recent Policy DevelopmentsInternational: In 2013, the VERA Institute of Justice took delegations fromthe U.S., including the NMCD secretary, to the Netherlands and Germany tostudy incarceration practices. The visit showed a stark contrast in incarcerationpractices – Europe focuses on re-socialization and rehabilitation in contrast tothe U.S. practice of incapacitation and retribution. In Germany, law requireprisons to be comparable to life outside prison walls, facilitate easy reentry,and suspend most prison sentences less than two years in exchange for finesor community service. Inmates in German and Dutch prisons prepare their ownmeals, wear their own clothes, and work and education are required. Manyinmates are allowed to leave prison on weekends to be with family and practiceskills they learned during the week. The VERA report states that only about 1percent of inmates abscond from family visitation and that denial of weekendhome stays are considered a more severe sanction than solitary confinement.National: There is a large and bipartisan appetite for criminal justice reformthroughout the U.S. at this time. Recognizing the nation’s world-leadingincarceration rate, Congress introduced a bipartisan bill in late 2017 entitledthe Sentencing Reform and Corrections Act aimed at reducing federalmandatory minimums, and in some cases making the reductions retroactive,for drug and gun sentence offenses. In addition to federal reforms, states havealso identified best practices. In 2007, Texas projected a need for 17 thousandnew prison beds at a cost of half a billion dollars. However, the state workedto analyze their justice system which identified low community supervisionsuccess rates, scant in-prison programming, and poor utilization of parole andreallocated funds earmarked for prison construction towards treatment anddiversion programs as well as enacted legislation to expand treatment access,improve chances for success on community supervision, and better use ofparole. Texas is estimated to have saved over 200 million as a result.Similarly, Idaho focused on improving access to substance use treatments andexpanded access to probation and parole by adding staff and improvingtraining, allowing for a higher caseload and fewer in prison. Idaho projected a16 percent inmate population increase between FY14 and FY19 despite havingone the lowest crime rates in the nation. As a result of implementing bestpractices, Idaho’s inmate population fell 3 percent in the first year and a halfand the state was able to close a prion unit.New Mexico: In the face of years of significant inmate population growth,New Mexico has worked to reduce recidivism and contain costs by providingbetter services for incarcerated persons. In 2012, the LFC published a programevaluation, Reducing Recidivism, Cutting Costs and Improving Public Safetyin the Incarceration and Supervision of Adult Offenders, with severalrecommendations around strengthening recidivism reduction best practices. In2013, NMCD created the Office of Recidivism Reduction in an attempt tostrategically work towards better outcomes for offenders. In 2014, NMCDcreated a research and analysis unit to measure program outcomes, evaluatefidelity, and promote evidence-based practices. In 2015, the departmentadopted policy requiring no less than 70 percent of total recidivismprogramming be evidence-based as defined by the Pew-MacArthur ResultsFirst Initiative and began determining Medicaid eligibility prior to release.The purpose of this evaluation is to review recidivism reduction programs,with a focus on reentry practices, as well as to look at healthcare providers andoutcomes in the corrections department.Corrections Department – Staus of Programs to Reduce Recidivism and Oversight of Medical Services Report #18-09 October 23, 20185
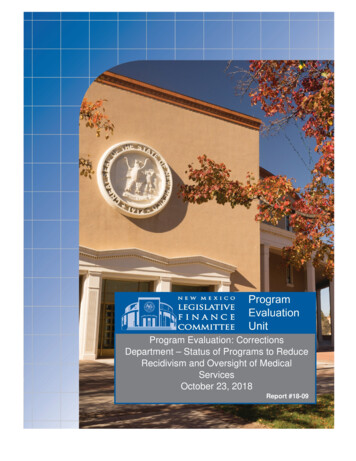
FINDINGS AND nce-based, but need to be tracked forutilization and outcomesThe New Mexico Corrections Department (NMCD) operates 11prisons across the state, six public and five private (see AppendixB) 2707,600 2607,400 2507,200 2407,000 230InmatesGeneral Fund (in millions)Chart 2. NMCD PrisonsGeneral Fund History6,800 220 2106,600 2006,400General Fund BudgetAverage Inmate PopulationSource: LFC files and NMSCIn FY18, the average population in NM state prisons was 7,325 inmates, 765women and 6,560 men, a 7.9 percent increase since FY10, but a 1.3 percentreduction from the all-time high in FY16. Private facilities incarcerated 51percent of the total prison population in FY18. Inmate population is a functionof both number of admissions per year and average length of stay. In NewMexico, the average length of stay in prison for men is one and a half yearswhile women serve on average just over one year. The New MexicoSentencing Commission (NMSC) measures that the female prison populationhas been increasing at 4 percent per year over the last five years versus 2percent per year for males over the same time period. However, NMSCestimates show the female population is projected to stay flat through FY19while the men’s population is projected to rise 1 percent. General fundappropriations for prisons were 256.1 million in FY18, a 5.9 percent increasefrom FY10 and a 15.8 percent increase from the post-recession low of 262.8million in FY11. Average cost per inmate per day fell from 97.5 in FY10 to 95.8 in FY18, though was at a low of 89.1 per inmate per day in FY12.Vacancy rates among corrections officers has stayed between 21 and 24percent over the last three years.The recidivism rate among New Mexico offenders is increasingChart 3. Recidivism RatesIncreasingPercent of Parolees Revoked55%50%45%40%35%30%MalesFemalesOf those incarcerated, 95 percent will be released and many of those will returnto prison. Recidivism, or the return to prison within three years of release fromprior incarceration, is a significant driver of prison admissions, representingalmost half of all admissions. In New Mexico, those returning to prisonrepresented 41 percent of all admissions in FY17, according to New MexicoSentencing Commission data. The overall recidivism rate among New Mexicooffenders has been increasing over the past decade. Chart 3 shows therecidivism rate for men and women since FY10. In FY17, NMCD reported arecidivism rate over 50 percent for the first time in the past decade, a 5 percentincrease since FY10 or the equivalent of approximately 6 million per year inadditional costs. A 2017 study by the Virginia Department of Correctionsranks New Mexico’s FY16 recidivism rate well above the national average, at11th in the nation (see Appendix C), though we are cautioned not to comparerecidivism rates between states too closely as they use different countingmethods and regulations.Source: LFC Analysis of NMSC data6Corrections Department – Staus of Programs to Reduce Recidivism and Oversight of Medical Services Report #18-09 October 23, 2018
Successful in-custody recidivismpractices from intake to reentryreductionrequiresbestAccording to the Bureau of Justice Assistance (BJA) and the Substance Abuseand Mental Health Services Administration (SAMSHA), the most importantstep in reentry planning is obtaining information about an individual’s risk ofreoffending and programmatic needs. Once a validated risk/needs instrumentis used, the implementation of evidence-based programs can be better targetedto individual inmates to achieve outcomes like recidivism reduction,educational attainment, stable housing, and consistent employment. The U.S.Department of Justice identifies five principles of recidivism reduction, fourof which are highlighted below: Principle I: Upon incarceration, every inmate should be provided anindividualized reentry plan tailored to his or her risk of recidivism andprogrammatic needsPrinciple II: While incarcerated, each inmate should be providededucation, employment training, life skills, substance abuse, mentalhealth, and other programs that target their criminogenic needs andmaximize their likelihood of success upon releasePrinciple III: Before leaving custody, every person should beprovided comprehensive reentry-related information and access toresources necessary to succeed in the communityPrinciple IV: During transition back to the community, halfwayhouses, and supervised release programs should ensure individualizedcontinuity of care for returning citizensNMCD has begun administering risk-needs assessments to inmates uponintake but lacks data around how the results are utilized. A 2012 LFCprogram evaluation found that NMCD purchased a validated risk-needsassessment tool, called COMPAS, in 2008, though never paid for or conductedassessments by the time of that evaluation. SHARE records indicate thatNMCD expended 40 thousand for the use of COMPAS in 2013, though it isnot clear what was purchased with it. NMCD indicated it began fullyadministering the assessment to all 4,197 admitted inmates upon intake inFY17, which SHARE indicates cost a total of 232 thousand. NMCD policyrequires that COMPAS assessment be administered within four weeks ofintake and referenced in making recommendations for program and treatmentneeds upon initial facility placement and every six months thereafter.However, NMCD also indicates that there are three significant factors thatsupersede COMPAS in program assignment: NMCD policy around securityconcerns that may preclude inmates from participating in programs at certainfacilities, the Inmate Literacy Act requiring GED-level education for allinmates without a high school diploma or equivalent, and specific sentencingrequirements that may be assigned by the judiciary like DWI programming(not evidence-based).NMCD is unable to provide data for the overall COMPAS results on the risksand needs among inmates. NMCD is unaware how often COMPAS assessmentrecommendations are actually assigned, attempted, or completed, and so it isnot clear how the results of the assessment are used to connect inmates withservices. Without data connecting COMPAS results with actual assignments,there is no way of knowing if resources are being used to focus on offenderswith the highest risk of recidivating. Additionally, being able to trackCOMPAS results against superseding literacy requirements, security transfers,Recidivism reductionbest practices:1. Evaluating risk-needsupon intake2. Connecting inmates withevidence-based programs3. Planning effectively forsuccessful reentry.NMCD beganadministering avalidated risk-needsassessment to allinmates upon intakein FY17A gap analysis ofneed assessedversus servicesprovided wouldimprove resourceallocationCorrections Department – Staus of Programs to Reduce Recidivism and Oversight of Medical Services Report #18-09 October 23, 20187
and judicial requirements would help policy-makers better address disparitiesbetween need and access to services.NMCD spends 87 percent of in-custody recidivism reduction programmingdollars ( 8.4 million) on evidence-based programs. NMCD began theirpartnership with Pew McArthur Results First Initiative in 2014 and created aninventory of recidivism reduction programs in 2015. NMCD spent 9.6million on 31 recidivism reduction programs in prisons in FY17. According toNMCD analysis of clearinghouse databases, 8.4 million (or 87 percent) isspent on 26 evidence-based programs. This compares to less than 25 percentspent on evidence-based programming in 2012 according to a 2012 LFCprogram evaluation. Some of the largest expenditures are for highly ratedprograms with large benefit-cost expectations (adult education - 4.5 million;post-secondary education - 1.6 million; Residential Drug Abuse Program(RDAP) - 783 thousand; moral reconation therapy - 464 thousand).However, the fidelity of programs like RDAP may benefit from routineevaluation, as recommended by the 2012 LFC report. At that time, NMCD wasfunding an evidence-based program called therapeutic communities (TC) thatwas not producing expected outcomes due to fidelity issues (i.e. not followingbest practices). A 2007 LFC report identified these issues as well. RDAP is atype of therapeutic community, and NMCD has not produced anydocumentation describing the components of RDAP, showing a differencefrom the TC model that was identified as underperforming in 2012 and 2007.Further, NMCD was unable to provide documentation around programparticipation numbers, completion rates, compliance reports, penalties levied,or even programmatic contracts, guidelines, or components for any of the incustody recidivism reduction programs.The amount of inmates served by recidivism reduction programs isunknown, as NMCD has participation figures for 0 out of 31 in-custodyprograms. NMCD is burdened by a paper-based records management systemwith hundreds and thousands of individual pages per inmate, therebycollecting data utilizaiton in this format isn’t cost effective for staff. However,this is in stark contrast to the 2012 LFC corrections evaluation, when thedepartment had participation and completion figures for all programs. NMCDreceived 7 million from the legislature in FY16 to develop an offendermanagement system that is expected to digitize records and have the capabilityof reporting program participation, completion, COMPAS, incidents,education levels, etc. The new system is expected to have the capability ofreporting program participation, completion, COMPAS, incidents, educationlevels, health needs, and series provided. etc. Additionally, the system willinclude a module for use by the Probation and Parole Division and the ParoleBoard to help complete comprehensive release plans. The expectedcompletion date is 2021.Until NMCD is able to track program data, there is no way of knowing whichprograms are cost effective, being run with fidelity, or returning the bestoutcomes. NMCD cannot allocate resources towards programs that areworking and away from programs that are not, or determine how manyresources should be allocated to produce the greatest impact on recidivismreduction. For instance, a program inventory published by the MississippiDepartment of Corrections indicate they spend 1.2 percent of their budget onrecidivism reduction, while the Alaska Department of Corrections spends 7percent compared to the 4.8 percent spent by NMCD. There is no way of8Corrections Department – Staus of Programs to Reduce Recidivism and Oversight of Medical Services Report #18-09 October 23, 2018
knowing if 4.8 percent is too much or too little without collecting data onparticipation and outcomes.NMCD has reduced release eligible inmate numbers by half. NMCD policystates that offenders must have an approved parole plan to be released and thatinmates must coordinate reentry 180 days before release with a committee ofspecialists that includes a transitional parole officer. NMCD policy requiresthat the committee form recommendations and suggestions to addressindividual inmate needs but does not include any reference to the use ofCOMPAS. The reentry plan developed by the committee must addresstreatment, employment, and housing needs, among others. However, NMCDwas unable to produce any records of how many inmates were prepared for,connected to, or obtained those needs upon release or thereafter. Additionally,LFC staff witnessed a concerning pattern of near-release inmates lacking goodemployment and housing plans during multiple prison visits. Again, theseobservations are by no means conclusive of anything, but utter lack ofsubstantive reentry preparation was unavoidably apparent.A significant issue identified in the 2012 LFC evaluation was the large amountof release-eligible inmates (REI) serving out parole inside prison facilities,largely due to poor re-entry planning and administration. NMCD claims tohave made a concerted effort to address these issues since then, and indeed,the total number of REIs across all prisons has declined substantially from 278in 2012 to 144 in 2018, amounting to a potential cost savings of 4 million peryear. The previous LFC evaluation found that 30 percent of REIs were deemedhard-to-place, meaning finding adequate parole locations for these individualswas difficult, delaying their timely release. The department in 2012 spent anestimated 3.7 million to incarcerate hard-to-place inmates.Chart 4. Daily Release EligibleInmate Counts Higher atPrivate Facilities90Securities and Exchange Commission filings make it clear that facilityoccupancy is a primary concern among private prison corporations. Forinstance, according to the 2017 GEO annual shareholders report, predictionsof their future financial position, business strategy, and others are materiallyimpacted by “our ability to maintain or increase occupancy rates at ourfacilities.” While this is entirely understandable from a business perspective,it is a fact that should be taken into account when making policy decisionsaround contract management. One potential avenue worth considering isperformance based funding for private correctional facilities. There are nosuch funding models currently being utilized within U.S. prisons, but 2012legislation requiring performance funding for New Mexico higher education8070Release Eligible InmatesPrivate prisons have held disproportionately large numbers of releaseeligible inmates in recent years. From October 2017 to 2018, private prisonfacilities held an average of 50 percent more REIs than public facilities(approximately 90 versus 60 at a time), despite incarcerating only 51 percentof the total prison population, see Appendix D. The Northwestern New MexicoCorrectional Center (NWNMCF) operated by CoreCivic held the most REIsat 39 (over 5 percent of the facility’s total population) as of October 5th, 2017,more than twice the REI number of any public facility. It should be noted that,since 2016, NWNMCF has been contracted to specialize in facilitating the reentry process. According to a CoreCivic press release, the facility’s mission isto “provide intensive reentry programs designed to prepare inmates for lifeoutside the prison walls.” By October 4th, 2018 the number of REIs atNWNMCF dropped to 26, though this is still the highest number of REIs thanany other facility.6050403020100Public 10/4/18Private NMDFCorrections Department – Staus of Programs to Reduce Recidivism and Oversight of Medical Services Report #18-09 October 23, 2018Source: LFC Files9
institutions, despite some hiccups, has seen the four-year graduation rate at theUniversity of New Mexico more than double from 14 percent in 2012 to 30percent in 2018, the highest in modern history. At 51 percent inmateoccupancy rates, private prisons in New Mexico are among the highest in thenation for share of total prison beds. This puts New Mexico at an advantage interms of moving the needle on the overall recidivism rate through effectivecontracting. Performance funding contracts for private prisons should likelyfocus on recidivism reduction below history rates for each facility, and couldconsider monitoring prisoner transfer logs to account for moving around ofpreferential inmates.NMCD policy provide
A nationwide movement for criminal justice reform has seen significant declines in prison populations across the U.S. in recent years, though at the same time, New Mexico prisons have continued to grow. From 2009 to 2016, the total U.S. prison population decreased by 7 percent while the total New Mexico prison population increased by 14 percent.