Transcription
World Class ManufacturingPerformance MeasurementsBuker, Inc.Management Educationand ConsultingWWW.BUKER.COM800-654-7990email: info@buker inc. com
Table of ContentsI.Introduction to World Class Manufacturing1Characteristics of World Class Manufacturing3III.World Class Manufacturing Results4IV.Detail Performance vationWorld Class Performance History Chart7911161819Conclusion20II.V.
Introduction toWorld Class ManufacturingVery few industries are unaffected by global competition.With higher levels of competitiveness it follows that theconsumer will ultimately decide upon the products which meettheir needs in the areas of product features, dependability,availability and overall value. No business can afford to standstill. If a company is successful today it can be certain there issomeone who is preparing to take all or part of the marketplace inthe future.In today’s business environment it is no longer good enough tobe better than the competition down the street or in the localmarketplace. Each company must strive to meet and beat thebest from anywhere in the world. A business enterprise can nolonger think that failure to make it in world markets will notaffect business in local markets. The very opportunity tocompete in world markets carries with it the explicit threat thatthe same opposition experienced overseas can indeed knock thecompany out of its local markets.The response to this challenge of global competition is throughthe ideal of World Class Manufacturing. World ClassManufacturing is the term used to describe the very bestmanufacturers in the world. These World Class companiesrecognize the importance of manufacturing as a strategic weapon.Manufacturing plays a fundamental role in developing andsustaining customer satisfaction through the elements of quality,cost flexibility, reliability and innovation.World Class Manufacturing is being worked on by manycompanies today under many names. Some of the namesinclude: Just-In-Time (JIT) or Lean Manufacturing, TotalEmployee Involvement (TEI), Value-Added Manufacturing(VAM), Continuous Improvement (CI), Activity BasedManagement (ABM), Total Quality (TQ) and EnterpriseResource Planning (ERP). Each is an improvement vehiclewhich, when utilized properly, can yield significantimprovements to the business.In the past several years World Class Manufacturing has been thesubject of several books and executive seminars which havebegun to spring up in an attempt to pull together the bestpractices and experiences into a cohesive package.1BECOMING AWORLD CLASSCOMPANY MEANSBEING THEPREFERRED SUPPLIERIN WORLD MARKETS;THE CAPITAL MAGNET IN FINANCIALMARKETS;THE SOUGHT-AFTERPLACE OF EMPLOYMENT;AND THE BUSINESS OFCHOICE BY THE COMMUNITY.
In 2001 and beyond World Class Manufacturing is the descriptorof the emerging globally competitive manufacturer.The term World Class Manufacturing is used to describe thehighest level of manufacturing performance. Some of theconcepts of World Class Manufacturing go all the way back toHenry Ford’s River Rouge plant in 1914. Achieving World ClassManufacturing comes only when the improvement effort isintegrated across all functions in the company. The real strengthfor a manufacturer lies in its ability to add value in itsmanufacturing processes.It is important to note that all types of businesses – banks,hospitals, insurance companies and distribution companies – areutilizing World Class principles. What business is not working toimprove flexibility, responsiveness, timeliness, exactness,precision and repeatability to delight the customer?Manufacturing companies today are where the premier examplesof improved quality, lead time reduction and shorter productintroduction cycles can be seen.World Class Manufacturing benefits the major stakeholders inthe business – management, employees, shareholders and thecommunity. Management is in control of a continuouslyimproving business; employees develop their skills. Knowledgeand productive abilities; shareholders receive a higher thannormal rate of return on their investment; and the communitybenefits by having a business entity that creates jobs andproduces product with an absolute minimum of waste.2
Characteristics ofWorld Class ManufacturingFor the World Class manufacturer, manufacturing plays afundamental role in developing and sustaining customersatisfaction through the elements of quality, cost flexibility,reliability and innovation.The characteristics of these World Class manufacturers are:1. An ongoing company-wide education and traininginitiative for human resource development to alloweveryone to actively participate in the improvementprocess.The importance of education and training for allemployees cannot be over-emphasized. Studies show thatWorld Class Manufacturers provide a minimum of forty(40) hours of education and training per employee on anannualized basis. In today’s business environment the onlylong-term sustainable competitive advantage isorganizational learning.2. Relentless pursuit of continuous improvement in allbusiness activities.The management focus is on establishing operatingperformance measurements that drive the behaviorsconsistent with the goal of continuous improvement inboth process and product. Measurements in place focuson rates of improvement.3. A dedication to developing a competitive advantage basedupon superior product quality and service.The World Class company creates a level of customersatisfaction through being not only "easy to do businesswith,’ but by exceeding customer expectations. The term"customer delight" is an often used expression whenprocuring product or service from a World Classmanufacturer.4. Utilization of an integrated business system that linkspeople and process.All business functions actively pursue a process of factoryand business simplification resulting in a systemsintegrative approach.3
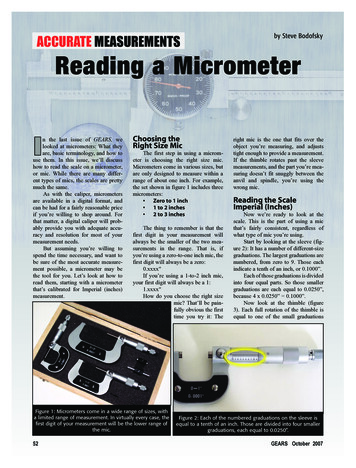
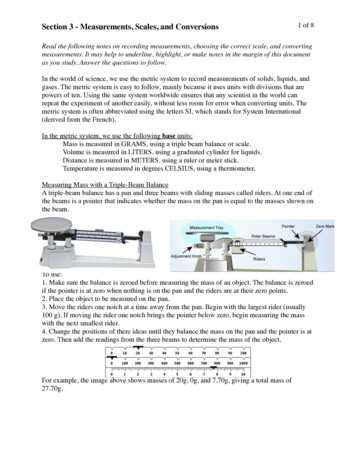
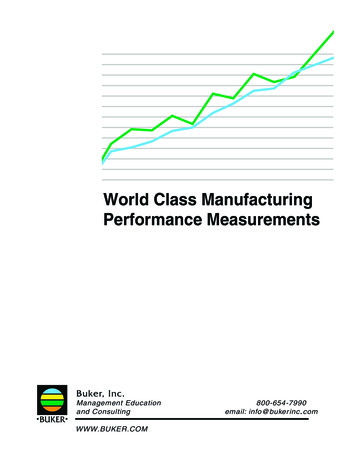
World Class Manufacturing ResultsWorld Class Manufacturing gives a company the lowestcosts, the fastest time to market, the best customer serviceand satisfaction, the highest quality, the shortest productlead time, the highest return on investment and the mostproductive work force. The results companies areachieving from a World Class Manufacturing initiative are:World Class BusinessPERCENT REDUCTION5% 20%Material CostLead time 50-75 Percent Reduction A lead time reduction of 50-75 percent applies not only tothe manufacturing cycle time but also from order entry toproduct shipment. To accomplish significant reductions incycle or lead time, the focus is on elimination of costadded activities. Cost-added activities would includeinspection of material and/or information, rework ofmaterial, storage of material and subsequent issuing ofproduction material, and moving material from onecontainer to another. Our studies show the typicalmanufacturer has a 70 percent ratio of cost-addedcompared to 30 percent value added activities. The WorldClass Manufacturer has a ratio of 70 percent work to 30percent cost-added.Quality Costs 45-55 Percent Reduction The reduction in the cost of quality by 45-55 percent isaccomplished through a reduction in appraisal, internal andexternal failure costs. Elimination of inspection ofincoming material, in-process material, sorting finishedproduct and fool-proofing processes that eliminate reworkcontribute to a reduction in defects.Inventory 40-60 Percent Reduction –The reduction in inventory may include not only in-processmaterial but raw material and finished goods. Reductionsare attributable to collapsing the throughput time in thetotal business process, significantly improved quality andimproved flexibility to respond to customer requirements.Floor Space 40-60 Percent Reduction –A 40-60 percent reduction in floor space pertains to thedistance product travels during the manufacturing process.The preferred method of manufacturing becomes one of afocus on flow and throughput, using concepts such ascellular manufacturing, group technology and continuous420% 40%Manufacturing Costs30%50%New Product Development Lead TimeFloor Space40% 60%RM & WIP Inventory40% 60%45% 55%Quality Costs50% 75%Lead Time100908070605040302010FundamentalPrinciple:Cost Added VS. Value AddedCost Added 70%Value Added 30%Cost Added Waste0
flow manufacturing. This method replaces the more traditionalapproach to manufacture by department where the focus is onmaximizing individual department efficiency.New Product Development Lead Time 30-50 PercentReduction –With a business environment characterized by shorter productlife cycles a competitive advantage is achieved through time tomarket. Reducing new product development lead time enablesmore frequent product introduction and roll our of productperforming to a slot in time.Manufacturing Costs 20-40 Percent Reduction The reduction in manufacturing costs results from a managementfocus on process improvement throughout the business. Processimprovements are achieved through elimination of non-valueadded activities (see lead time reduction) driving factory andbusiness simplification. Reduction in manufacturing costs are aconfirmation of quality, improvements in cycle time reduction,reduced inventory levels and space utilized to manufacture.Material Costs 5-20 Percent Reduction Material costs are reduced not by focusing on price, but on totalcosts. Approximately 40 percent of total cost of purchasingmaterial from the supplier base is in non-price areas. Examplesof non-price areas are inspection of incoming material, storage ofmaterial, rework of material, and excessive material handlingbefore performing value-added activities.Achieving World Class Manufacturing results in the businessbecoming:(1) The Preferred Supplier in World Markets(2) The Capital Magnet in World Financial Markets(3) The Sought After Place of Employment(4) The Business of Choice by the Community5
Detail Performance MeasurementsIn World Class Manufacturing the focus is on continuousimprovement. Measurements in place should therefore activateimprovements. Management evaluates the measurement processbased upon the rate of improvement. The measurements aredesigned to drive the improvement process in the critical elementsof quality, cost, flexibility, reliability and innovation. Themeasurements we at Buker, Inc. have seen and recommend forcompanies striving for World Class levels are as follows:Quality1) Percent reduction in total cost of quality.2) Percent reduction in defects.3) Percent of certified suppliers.4) Percent reduction in supplier base.5) Percent reduction in time between defect occurrence,detection and correction.Cost1) Percent increase in inventory turnover.2) Percent reduction in data transactions.3) Percent increase in materials shipped to point of use bysupplier.4) Percent increase in dollars of output per employee.5) Percent reduction in floor space utilized.Flexibility1) Percent reduction in cycle time.2) Percent reduction in setup time.3) Percent reduction in lot/batch size.4) Percent increase in number of jobs mastered per employee.5) Percent increase in common materials used per product.Reliability1) Percent increase in process capable equipment.2) Percent increase in overall equipment effectiveness.3) Percent reduction in product or service warranty costs.4) Percent reduction in engineering changes.5) Percent increase in on-time delivery.Innovation1) Percent reduction in new product introduction lead time.2) Percent increase in new product sales revenue as a percent oftotal sales revenue.3) Percent increase in number of new patents granted.4) Customer perception of the company as a leader ininnovation.5) Percent of management time spent on leading or fosteringinnovation.6
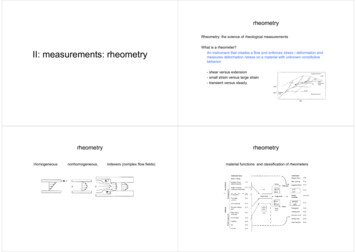
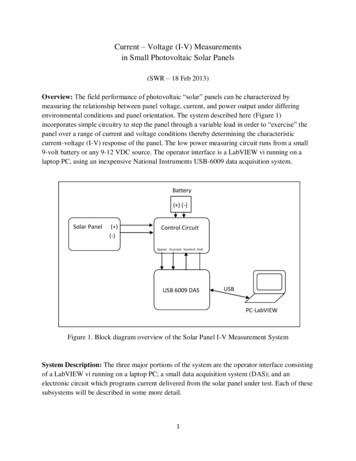
QUALITY1) Percent reduction in total cost of qualityExample: Cost of Quality History1514TOTAL COQ1312COQ As A Percent of SalesThe reduction in total cost of quality wouldbe measured on a monthly basis andtypically is displayed in graph format. Theelements of cost of quality measured areprevention, appraisal, internal failure andexternal failure. These four elements aremeasured monthly.EXTERNAL FAILURE111098INTERNAL s2) Percent reduction in defects(Parts Per Million)20,000PlanActual18,000Defects (ppm)The reduction in defects is measured inparts per million. The measurement isdefects per unit relative to the number ofopportunities possible for defects tooccur. Reduction in defects is measuredweekly and monthly. Normally this isdisplayed on a trend chart and is onemillion divided by total opportunitiestimes the number of defects.16,00014,00012,00010,0008,000Example:100 Board Assemblies ProducedX 100 Components Per Board6,00010,000 Opportunites for Defects4,0002,00010 Defects OccurParts PerMillion (1,000,00010,000 Opportunities)JX 10 Defects 1,000FMAMJMonth7JASOND
3) Percent of certified suppliers5025402030152010105JFMAMJJASPercent OfCertified SuppliersTotal CertifiedPercent CertifiedExample:Total Certified SuppliersCertified suppliers require, at the minimum,supplier’s process has been certified to thepoint that there is no incoming materialinspection required. Many companies thatare working on certification certify byindividual part rather than source of the part.Whichever method is used, the data shouldbe displayed on a trend line and reviewedmonthly and appropriate actions taken.OMonthPercent Of Certified ItemsTotal Certified Items5025402030152010105JFMAMJJASPercent OfCertified ItemsTotal CertifiedPercent CertifiedExample:OMonth4) Percent reduction in supplier baseExample:Total Number Of SuppliersThis measurement is utilized to reviewimprovements in quality of source ofsupplier. The supplier base typically isreduced by rewarding those sources thatcontinuously improve quality, reduce leadtime, improve on-time performance andsupply materials that can be delivered to thepoint of use. The measurement is monthlyand displayed as a trend line.Total Supplie
Class Manufacturer has a ratio of 70 percent work to 30 percent cost-added. Quality Costs 45-55 Percent Reduction - The reduction in the cost of quality by 45-55 percent is accomplished through a reduction in appraisal, internal and external failure costs. Elimination of inspection of incoming material, in-process material, sorting finished product and fool-proofing processes that eliminate .