Transcription
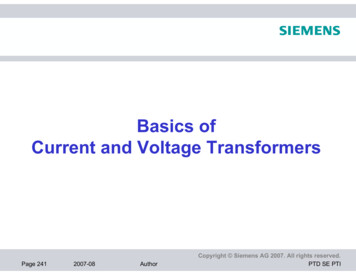
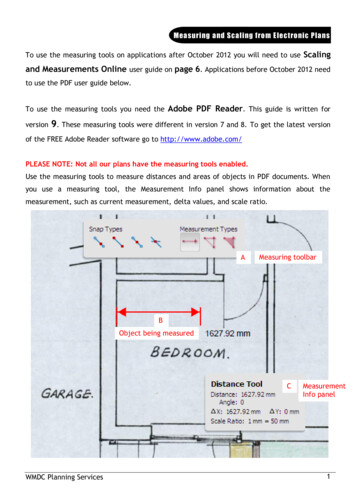
Current – Voltage (I-V) Measurementsin Small Photovoltaic Solar Panels(SWR – 18 Feb 2013)Overview: The field performance of photovoltaic “solar” panels can be characterized bymeasuring the relationship between panel voltage, current, and power output under differingenvironmental conditions and panel orientation. The system described here (Figure 1)incorporates simple circuitry to step the panel through a variable load in order to “exercise” thepanel over a range of current and voltage conditions thereby determining the characteristiccurrent-voltage (I-V) response of the panel. The low power measuring circuit runs from a small9-volt battery or any 9-12 VDC source. The operator interface is a LabVIEW vi running on alaptop PC, using an inexpensive National Instruments USB-6009 data acquisition system.Battery( ) (-)Solar Panel( )(-)Control CircuitVpanel Vcurrent Vcontrol GndUSB 6009 DASUSBPC-LabVIEWFigure 1. Block diagram overview of the Solar Panel I-V Measurement SystemSystem Description: The three major portions of the system are the operator interface consistingof a LabVIEW vi running on a laptop PC; a small data acquisition system (DAS); and anelectronic circuit which programs current delivered from the solar panel under test. Each of thesesubsystems will be described in some more detail.1
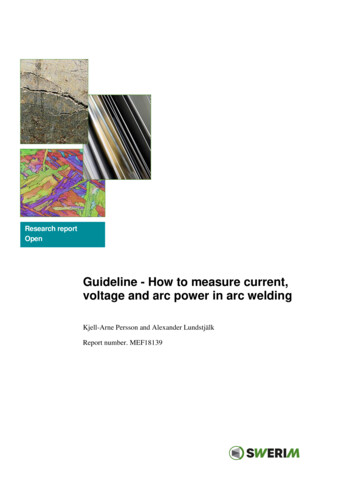
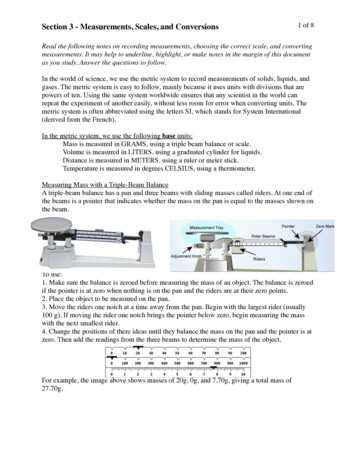
Operator Interface: The LabVIEW screen (Figure 2) consists of setup controls, graphs ofmeasured current and voltage data, and two graphs showing the I-V relationship and the power –voltage relationship. The data are measured and graphed in real time. At the conclusion of themeasurement the operator is given the option to save the data set.Figure 2. Labview program front panel.Setup Options:There are six setup options on the LabVIEW front panel.Max Amps:R-Sense (ohms):Enter the maximum current to be drawn from the panel.Normally not changed from default. This is the actual measured value ofthe current-sense resistor (R4 figure 3). This is not changed unless youreplace the current sense resistor.2
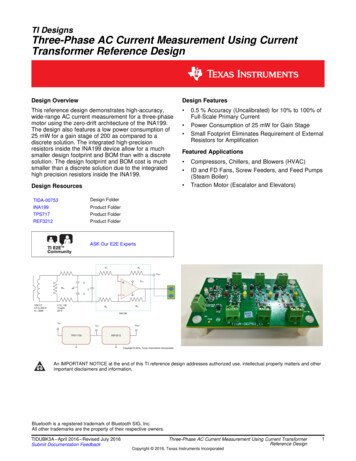
Panel V-divider ratio: Normally not changed from default. The actual panel voltage is divideddown by two resistors (R5, R6) in a voltage divider configuration. Theratio in this option is the ratio between the actual panel voltage and thevoltage presented to the DAS. The ratio does not change unless youchange the resistors.Panel Volts Channel: DAS input for panel volts. Dev may change, but channel is always ai1.Panel Amps Channel: DAS input for panel amps. Dev may change, but channel is always ai0.Gate Control Chan: DAS analog output for panel current control. Dev may change but thechannel is always ao0.Once the connections are made from the solar panel to the control circuit and to the DAS, theLabVIEW vi is started. Click the Run button to begin a measurement. A full measurement willtake about 4-5 seconds. During the measurement the current and voltage values will be graphedas the measurements proceed. At the conclusion of the measurements the derived I-V and powergraphs are drawn. At this point a user prompt appears with the option to save the data set justmeasured. You can then browse to an appropriate location such as a USB flash drive and enter afile name. The data are saved as text data which can be later imported into Excel or some otherprogram for further analysis.Data Acquisition System: The DAS is a relatively inexpensive National Instruments productUSB-6009. The analog inputs are /-10 volt, 14-bit resolution. The analog outputs are 0-5 volts,12-bit resolution. The DAS connects to the laptop with a USB cable, and connects to the controlcircuit with four wires as explained later in the control circuit description. The DAS derives itspower from the laptop USB connection and does not require external power.Control Circuit: The control circuit (Figure 3) is used to control the current drawn from thesolar panel, and to condition the current and voltage signals produced during the measurements.The circuit draws about 8 milliamps and can be powered by a 9-volt battery or by any DCvoltage typically in the 9 to 12 volt range. Referring to Figure 3 there are three connectors for thecircuit. The J1 connector is from the USB-6009 DAS. In J1, in addition to the ground connectionthere are two analog outputs from the circuit (panel voltage and panel current) plus the analogcontrol voltage from the DAS to the circuit. The J2 connector is on a screw terminal strip andconnects to the solar panel. The positive ( ) and negative (-) terminals are labeled, and thepolarity of the solar panel must be observed. Connector J3 is the battery power for the circuit.3
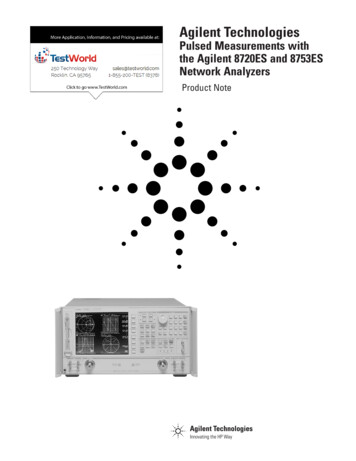
Figure 3. Control/measurement circuit.The circuit is relatively simple and uses two operational amplifiers (opamps). Both amplifiers arecontained in the 8-pin package on the circuit board. A control voltage from the DAS on J1-3 ispresented to opamp U1B pin 5. This opamp multiplies the control voltage by two as configuredby the two resistors R1 and R2. Resistor R3 is not required but is included just to make sure azero voltage is presented to the opamp when the J1 cable is disconnected.The voltage from U1B is fed to the non-inverting input (pin 3) of the current-control amplifierU1A. Notice that while U1B is configured as an ordinary non-inverting opamp with a gain of 2,in U1A there is no typical feedback resistor network. However, there is feedback being providedto the pin 2 inverting input. The feedback is the voltage produced as the solar panel current flowsthrough the current-sense resistor R4. The more current the panel produces the greater is thefeedback voltage produced at the current sense resistor (V I*R). U1A thus controls the panelcurrent by continuously comparing the control voltage set point at pin 3 with the feedbackvoltage from the sense resistor. U1A produces a voltage output as needed to make the two inputsequal. The resulting output voltage is connected to at the gate terminal (G) of the MOSFETtransistor. The voltage present at the gate terminal controls how much current passes through theMOSFET; the higher the gate voltage the higher the current which the MOSFET allows to passthrough. The MOSFET thus serves as a software-controlled variable load to the panel.The LabVIEW vi proceeds by incrementing the current control voltage at J1-3 over 100 stepsfrom 0 to the maximum current as entered on the vi front panel. At each step the program sendsthe new control voltage and pauses for 10 milliseconds while the control circuit establishes the4
new steady-state current. Then the solar panel voltage and current are measured, graphed andstored in an array. This process repeats until all 100 steps have been accomplished thuscompleting the full current-voltage (I-V) response of the solar panel.5
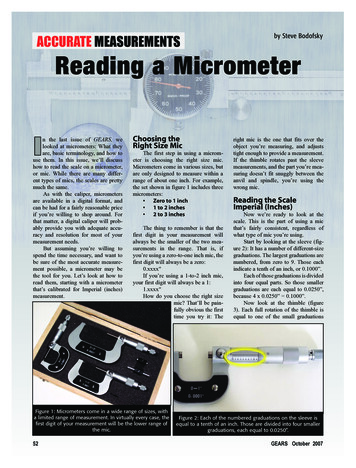
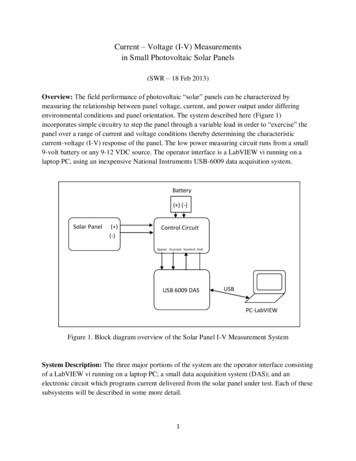
Running the systemSolar Panel( ) (-)BatteryUSB toPCUSB-6009CircuitBoard( ) Radiation(-)( )Temperature(-)Connection diagram for solar panel test set.6
Make the following connections:1. At the upper terminal strip connect the solar panel. Be sure to get the correct polarity.2. At the right-hand side of the circuit board are the input connections for the paneltemperature measured by a thermistor, and for solar radiation measured by apyranometer. Connect these two cables again making sure the ( ) and (-) polarity iscorrect.3. Connect the USB-6009 data acquisition system to the laptop PC with a USB cable.4. Check the voltage on the 9-volt battery with a multimeter. The battery should show atleast 8 volts. Replace the battery if it is below 8 volts. Connect battery cable. The greenLED on the circuit board should light up.Operating the solar test set1.2.3.4.5.6.7.8.9.Make the connections as shown on the Connection diagram.Set up the solar panel as desired (azimuth and zenith angle).Start the LabVIEW Solar vi and click the “Run” button.The measurement will take about 5 seconds to complete. Click “No” to the data savequestion.Depending on the panel you have, and the orientation, you will probably need to enterdifferent values in the “Max Amps” and the “Max Volts” boxes located in the Setupsection. On the Measured Data graphs observe the maximum amps and volts achievedfrom step 3 above. Then enter new “Max Amps” and “Max Volts” values in the boxeswhich are slightly greater than the observed max values from the run in step 3. Forexample, if you got 0.33 amps and 8 volts initially, you would enter 0.4 amps for MaxAmps and 9 volts for Max Volts.With the new entered values, make a new measurement by clicking the Run button. Youshould now have amps and volts graphs which occupy most of the graph space.If the data look ‘good’, click “Yes” to the save data question. A dialog box will openwhere you can browse to a location, often the desktop, and enter a file name for yourdata. Additional measurements will be appended to this file as you work through theexperiment.Summary data is shown in the two graphs on the right side of the vi front panel. The topgraph shows the current/voltage relationship, and the lower graph shows panel power as afunction of panel voltage.At the top of the vi are shown the incident radiation (watts· meter -2) and paneltemperature ( C).7
Possible problems1. If you get an error while running the vi it may be because the correct Device is notselected in the Data Channels section. Reselect the Device with the pulldown menu ineach channel box. Note that the channel number will be the same, only the devicenumber may be incorrect.2. DO NOT alter the values shown in the Hardware section. These values show theresistance of the current-sense resistor (R-Sense) which is used to calculate the panelamps, and the voltage divider ratio (V-div) which divides the actual panel voltage downto the range where it can be measured by the data acquisition system. These twoparameters do not change unless the electronic components have been changed. If youinadvertently change the values in the hardware section, exit and restart the vi.Angle definitions for panel orientation to the sun.8
AppendixFigure A1. Full test set showing the mini panel, Li-Cor pyranometer yellow“normal incidence” indicator, and measurement/control circuitry.Figure A2. View showing detail of angle adjustment, pyranometer, and normalincidence indicator9
Figure A3. Showing the measurement/control board, and the two current senseresistors. Depending on the panel being tested one or the other senseresistor will be used. The component between the two resistors is thepower MOSFET which serves as the software-controllable variable loadfor the panel (details in the text). The black multi-wire connector plugsinto a National Instruments USB-6009 data acquisition system and iscontrolled by the accompanying LabVIEW vi as described in the text.The 4-wire green connector accepts the signal cables for paneltemperature and pyranometer signal.10
Figure A4. Signal conditioning circuitry and sensors. At the right of the photo are the thermistor (uppercable) and the pyranometer (lower cable). Center bottom is the signal conditioning circuitry. To the left isthe USB-6009 data acquisition system. At the upper left is the 9-volt battery. In the center is thealuminum heat sink containing the two gold colored current sense resistors and the power MOSFETwhich is the load for the panel. At the top is the set of terminals for connecting the solar panel.11
Rarely Asked QuestionsQ1:Why does opamp U1B multiply the current-control voltage by 2?A1:The maximum analog output from the USB-6009 is 5 volts. A 5 volt control voltagecorresponds to a 10 amp current passing through the sense resistor R4. If the 10 ampswere as high as we ever wanted to measure we wouldn’t need to do the multiplication.But some panels produce more than 10 amps. In order to be able to demand highercurrents from a panel we need a higher control voltage. Multiplying by 2 gives us a maxcontrol voltage of 10 volts, increasing our current demand capability to 20 amps.Q2:My 9-volt battery is running low and measures only 7.5 volts. Does this have any effecton how the circuit operates?A2:Yes it does have an effect. This question also relates to question 1 above. Remember thatthe outputs from opamps cannot exceed the supply rails (the voltage you supply to thecircuit). If the circuit battery is down to 7.5 volts that means the opamps’ maximumoutput will be limited to 7.5 volts. In fact, even with a fresh 9-volt battery the controlvoltage would is limited to the 9 volts of the battery, corresponding to a maximumcurrent draw from the panel of 18 amps. If you need the full 20 amps from a panel youshould use a 12-volt source to power the circuit.Q3:What exactly are the two voltage-divider resistors R5 and R6 for? I want to know thepanel voltage; can’t I just measure it directly?A3:If you have a multimeter then yes, you can just clip the multimeter leads to the panel anddirectly measure the voltage. But we are using a data acquisition system, and the DAS islimited to analog inputs in the -10 to 10 volt range. Some solar panels produce 20-30volts, or more. In order to accommodate these higher voltages we need to reduce (dividedown) the voltage going into the DAS to a range we can measure. The software can thencompensate for the voltage reduction by multiplying by the voltage divider ratio shownon the vi front panel. The ratio (R5 R6)/R6. See figure 3.Q4:I’m curious about the sense resistor R4. What does it do exactly? And, is there somethingspecial about the 0.5 ohm value, or would some other resistor value work also?‘A4:The sense resistor gives us a way to measure the current produced by the solar panel.Note that the DAS can measure only voltage, not current. The current produced by thepanel flows through R4. As it does so a voltage drop V occurs across R4. We measure the12
V directly and we know the R. Therefore the panel current can be calculated from Ohm’sLaw (I V/R). The resistance of R4 should be small, but not too small. If it is too smallthe voltage drop across it
stored in an array. This process repeats until all 100 steps have been accomplished thus completing the full current-voltage (I-V) response of the solar panel. 6 Running the system ( ) (Connection diagram for solar panel test set. Battery Solar Panel -) Circuit Board USB-6009 USB to PC ( ) Radiation (-) ( )Temperature (-) 7 Make the following connections: 1. At the upper terminal strip connect .