Transcription
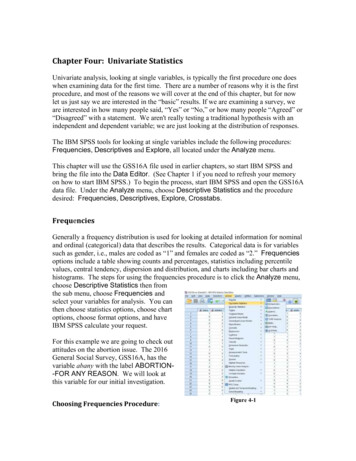
Univariate Statistics SummaryFurther Maths Univariate Statistics SummaryTypes of DataData can be classified as categorical or numerical.Categorical data are observations or records that are arranged according to category. For example:the favourite colour of a class of students; the mode of transport that each student uses to get toschool; the rating of a TV program, either “a great program”, “average program” or “poor program”.Postal codes such as “3011”, “3015” etc.Numerical data are observations based on counting or measurement. Calculations can be performedon numerical data.There are two main types of numerical dataDiscrete data, which takes only fixed values, usually whole numbers. Discrete data often arises asthe result of counting items. For example: the number of siblings each student has, the number ofpets a set of randomly chosen people have or the number of passengers in cars that pass anintersection.Continuous data can take any value in a given range. It is usually a measurement. For example: theweights of students in a class. The weight of each student could be measured to the nearest tenth ofa kg. Weights of 84.8kg and 67.5kg would be recorded. Other examples of continuous data includethe time taken to complete a task or the heights of a group of people.Exercise 1Decide whether the following data is categorical or numerical. If numerical decide if the data isdiscrete or continuous.1.2.Page 1 of 21
Univariate Statistics Summary3.4.Solutions1a Numerical-discreteb. Categoricalc. Categoricald. Numerical-Continuous2a. Numerical b. Categorical c. Numerical d. Categorical e. Categorical3a Continuous b. Discretec. Continuous d. Continuous e. Discrete4. DRepresenting DataData is often represented in frequency charts, column charts, histograms and dot plots.Remember: the frequency of an observation is the number of times that observation occurs.Page 2 of 21
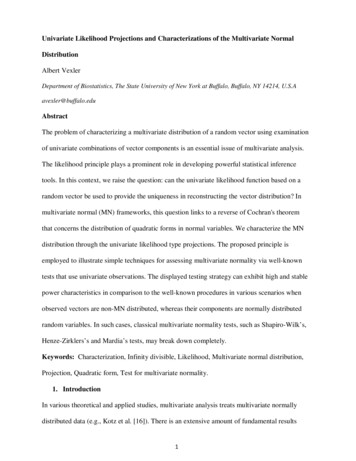
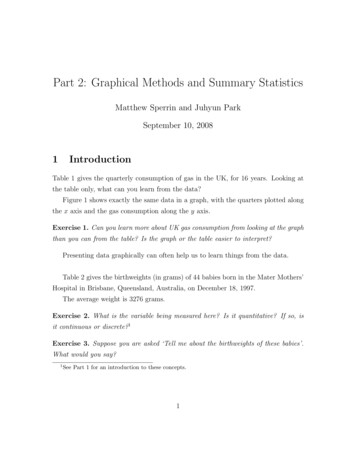
Univariate Statistics SummaryExample 1:The following frequency distribution table gives the number of days of each weather type for themonth of January. Represent the information using a column chart.Weather TypeFrequency20151050HotWarmMildCoolWeatherExample 2Represent the data ina. a histogram.a.b. a frequency polygonb.Notice that for a histogram there is no gap between the bars and the number of visits are positionedat the centre of each bar.Page 3 of 21
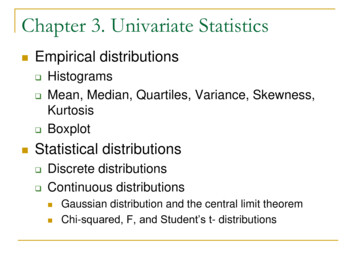
Univariate Statistics SummaryExample 3Represent the data in a. a histogramb. a frequency polygona.b.Notice that the numbers are placed at the edges of the bars along the x-axis for grouped data.Types of AverageThere are three types of average which can represent a set of data. An average is a measure ofcentral tendency.The MeanThe most common average is the mean.𝑥̅ is used to denote the mean.𝑥̅ 𝑠𝑢𝑚 𝑜𝑓 𝑎𝑙𝑙 𝑠𝑐𝑜𝑟𝑒𝑠𝑛𝑢𝑚𝑏𝑒𝑟 𝑜𝑓 𝑠𝑐𝑜𝑟𝑒𝑠Example 1: The following data gives the number of pets kept in each of 10 different households.3, 5, 4, 4, 2, 3, 0, 1, 4, 5The mean number of pets is given by:3 5 4 4 2 3 0 1 4 5 3.110The mean is sometimes not the best average to use as it is affected by extreme scores or outliers.Page 4 of 21
Univariate Statistics SummaryThe MedianThe median of a set of scores is the middle score when the data are arranged in order of size.The median’s position is given by𝑛 12th score, where n is the number of scores.In example 1 the median’s position is given by the10 12th score. This is the 5.5th score or halfwaybetween the 5th and 6th score, after the scores have been arranged in order of size.Arranging the data in order of size:0, 1, 2, 3, 3, 4, 4, 4, 5, 5Median number of pets is:3 42 3.5(as there are two middle scores we take their mean.The median is not affected by extreme values or outliers.The ModeThe mode of a group of scores is the score that occurs most often. That is the score with the highestfrequency.In example 1 the modal number of pets is 4. More than one mode is possible.Frequency TablesExample 4The table indicates that 6 students made 0 cinema visits, 7 students made 1 cinema visit, 4 studentsmade 2 cinema visits etc.The mean number of visits can be found by adding an extra column to the table and multiplying thenumber of visits by the frequency.𝒇 𝒙0786425Number of visits (𝒙) Frequency (𝒇)0617243241Total20a. mean number of visits Page 5 of 21𝑡𝑜𝑡𝑎𝑙 𝑜𝑓 𝑓 𝑥𝑡𝑜𝑡𝑎𝑙 𝑜𝑓 𝑓 2520 1.25
Univariate Statistics Summaryb. the median number of visits can be found by finding the position of the median as the number ofvisits are in order of size in the table.The median’s position is the𝑛 12th score 20 12th 10.5th position. Halfway between the 10thand 11th scores. The median’s position falls within the second row and is therefore 1.c. The mode is the score with the highest frequency. The mode is 1.Alternatively, the mean and median can be found using Lists and Spreadsheet in the calculator.1: Enter the data into Lists and Spreadsheetview2: Hit Menu, Statistics, Stat Calculations, OneVariable Statistics 3. Click OK when number of lists appears.6. The statistical data appears.The mean is given by 𝑥̅ 1.25The median is 1.4. In the pop up, click in the X1 List box andselect visits from the drop down list. Hit the Tabkey to move to the next box and select freq fromthe drop down list in the Frequency List boxThere is no need to enter data into the otherboxes.5. Click OK.Page 6 of 21n is useful as it gives the frequency total.
Univariate Statistics SummaryGrouped DataWhen data is presented in a frequency table within class intervals, and we do not know the actualvalues within each class interval, we assume that all values are equal to the midpoint of the classinterval in order to find the mean.Example 5:The ages of a group of 30 people attending a superannuation seminar are recorded in the frequencytable below, calculate the mean age.Age (Class Intervals)20 - 2930 - 3940 - 4950 - 5960 - 6970 - 79TotalFrequency161363130To find the mean age, assume all people in the class interval 20 - 29 are 24.5 years of age (This valueis obtained by finding the midpoint of 20 - 29), all people in the class interval 30 - 39 are 34.5 yearsof age and so on. The mean age can be found from the table below:Age (Class Intervals)Frequency 𝒇20 - 2930 - 3940 - 4950 - 5960 - 6970 - 79161363130Total:The mean age 𝑥̅ total of f mtotal of f 140530Midpoint ofClass Interval 𝒎24.534.544.554.564.574.5𝒇 𝒎24.5207578.5327193.574.51405 46.8 𝑦𝑒𝑎𝑟𝑠 (𝑐𝑜𝑟𝑟𝑒𝑐𝑡 𝑡𝑜 1 𝑑𝑒𝑐𝑖𝑚𝑎𝑙 𝑝𝑙𝑎𝑐𝑒)The above can be more easily done using Lists and Spreadsheet on the calculator.Page 7 of 21
Univariate Statistics Summary1: In Lists and Spreadsheets view enter the data for the midpoints and the frequency into the firsttwo columns. Label the columns as shown.2. Press Menu, Statistics, Stat Calculations, One Variable Statistics.3. Leave the Number of Lists as 1 and select OK.4. In the pop up box, click in the X1 List box and select midpoint from the drop down list. Press theTab key to move to the Frequency List box and select freq from the drop down list.5. Press the TAB key to move to the OK button.The mean 𝑥̅ 46.833The mean age 46.8 yearsPage 8 of 21
Univariate Statistics SummaryMeasures of Variability or SpreadIt is useful to be able to measure the spread or variability of the data. How dispersed is the data?The RangeThe simplest measure of spread is the range. The range is the difference between the smallest scoreand the largest.Example 1The set of data 3, 5, 4, 4, 2, 3, 0, 1, 4, 5 (which gave the number of pets in each of 10 households) hasa range of5 0 5The Interquartile Range (IQR)1The lower quartile, 𝑄1 is 4 of the way through the set of data.3The upper quartile, 𝑄3 is 4 of the way through the set of data.The 𝐼𝑄𝑅 𝑄3 𝑄1Page 9 of 21
Univariate Statistics SummaryExample 6The Standard DeviationThe standard deviation gives a measure of the spread of the data about the mean. The formula tofind the standard deviation is complex and we usually find it directly from the calculator. On thecalculator it is denoted by the symbol 𝑠𝑥 . The bigger the standard deviation, the greater the spreadof data.Example 7Find the standard deviation of the set of data: 12, 9, 4, 6, 5, 8, 9, 4, 10, 2. This is the same data as inExample 6.1. In Lists and Spreadsheet view, enter the data.2. Press Menu, Statistics, Stat Calculations, OneVariable Statistics.3. Leave the Number of Lists as 1 and select OK.4. Enter the data into the pop up box as shown.5. Click OK.Page 10 of 21
Univariate Statistics SummaryThe statistical data appears.The standard deviation is given by𝑠𝑥 3.17805Notice that the lower quartile is given by𝑄1 𝑋 4 and the upper quartile is given by𝑄3 𝑋 9This agrees with the solutions to Example 2.The 𝐼𝑄𝑅 9 – 4 5Stem and Leaf PlotsExample 8The data below shows the weights in kg of 20 possums arranged in order of size:0.71.72.13.00.91.72.13.2Page 11 of 211.11.82.21.41.82.31.51.92.31.62.02.5
Univariate Statistics SummaryWe can represent this data in a stem and leaf plot as shown below:Key: 0 7 0.7kgStem0123Leaf7 91 4 5 6 7 7 8 8 90 1 1 2 3 3 50 2In a stem and leaf plot the numbers are arranged in order of size. The key is given as 0 7 kg meansstem 0 and leaf 7 which represents 0.7 kg. You should always include a key in the stem and leaf plot.When preparing a stem and leaf plot keep the number s in neat vertical columns because a neat plotwill show the distribution of the scores. It is like a sideways bar chart or histogram.The interquartile range can be found from the stem and leaf plot.1. Find the median weight. The median weight Q2 is the(20 1)th score. ie the 10.5th score.2The median lies between the 10th and 11th scores. Count through the data to find theposition of the median. It can be seen from the plot that the median lies between 1.8 and(1.8 1.9) 1.85 kg.2(10 1)2. The lower quartile Q1 will be theth score in the lower half. ie the 5.5th score in the21.9. The median weight islower half. Count through the data to find the position of the lower quartile. Q1 (1.5 1.6) 1.55 kg.23. The upper quartile Q3 will be the 5.5th score in the upper half of the plot. Count through thedata to find the position of the upper quartile. Q3 (2.2 2.3) 2.25 kg24. The interquartile range Q3 – Q1 2.25 – 1.55 0.7 kg5. See diagram below:median Q2Q1Key: 0 7 0.7kgStem0123Leaf7 91 4 5 6 7 7 8 8 90 1 1 2 3 3 50 2Q3Page 12 of 21
Univariate Statistics SummaryExample 9Find the interquartile range of the data presented in the following stem and leaf plot.Key: 15 4 154Stem151617181920Leaf4 81 30 01 22 70 2Q1median Q283 6 81 4 7 9 9 93 3 5 7 8 8 98Q3The median is the(30 1)th score. ie the 15.5th score which lies between 179 and 179. So the2median is 179.The lower quartile Q1 will be the(15 1)th score in the lower half. ie the 8th score in the lower half.2Q1 168.The upper quartile Q2 will be the 8th score in the upper half of the data. ie 188.The interquartile range Q3 – Q1 188 – 168 20.See the diagram above.Using CAS.You could check your answers by entering the data into your CAS calculator to determine themedian, lower and upper quartiles.BoxplotsFive-number summaryA five number summary is a list consisting of the lowest score (Xmin), lower quartile (Q1), median(Q2), upper quartile (Q3) and the greatest score (Xmax) of a set of data.A five number summary gives information about the spread or variability of a set of data.Box PlotsA box plot is a graph of the 5-number summary. It is a powerful way of showing the spread of data. Abox plot consists of a central divided box with attached “whiskers”. The box spans the interquartilerange. The median is marked by a vertical line inside the box. The whiskers indicate the range ofscores. Box plots are always drawn to scale and a scale is often attached.Page 13 of 21
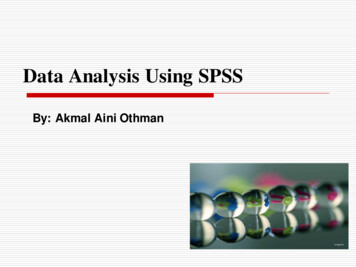
Univariate Statistics SummaryInterpreting a BoxplotA boxplot divides the data into four sections. 25% of the scores lie between the lowest score and thelower quartile, 25% between the lower quartile and the median, 25% between the median and theupper quartile and 25% between the upper quartile and the greatest score.Extreme Values or OutliersExtreme values often make the whiskers appear longer than they should and hence give theappearance that the data is spread over a much greater range than they really are. If an extremevalue occurs in a set of data it can be denoted by a small cross on the boxplot. The whisker is thenshortened to the next largest or smallest score.When one observation lies well away from other observations in a set, we call it an outlier.For example the histogram shows theweights of a group of 5-year old boys.Clearly the weight of 33kg is an outlier.Page 14 of 21
Univariate Statistics SummaryDetermining whether an Observation is an OutlierTo identify possible outliers we can use the following rule:An outlier is a score, 𝑥, which is eitherless than 𝑸𝟏 𝟏. 𝟓 𝑰𝑸𝑹orgreater than 𝑸𝟑 𝟏. 𝟓 𝑰𝑸𝑹Where 𝑄1 is the lower quartile and 𝑄3 is the upper quartile and IQR is the interquartile rangeIn summaryAn outlier is a score, 𝑥, which lies outside the interval𝑸𝟏 𝟏. 𝟓 𝑰𝑸𝑹 𝒙 𝑸𝟑 𝟏. 𝟓 𝑰𝑸𝑹Example 10Page 15 of 21
Univariate Statistics SummaryDistribution of DataPage 16 of 21
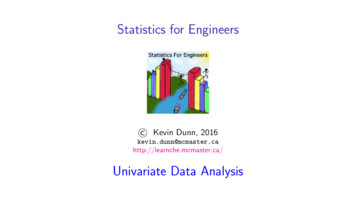
Univariate Statistics SummaryComparing Two Sets of DataBack to Back Stem and Leaf PlotsTwo sets of data can be compared using back to back stem and leaf plots. The data below shows thelife time of a sample of 40 batteries in hours of each of two brands when fitted into a child’s toy.Some of the toys are fitted with an ordinary battery and some with Brand X. Which battery is best?Key: 6 9 69 hours899869768954788325Ordinary BrandLeaf6 2 0 08 6 4 01 1 1 02 2 0 03 1 1 14 2Stem67891011121314Brand XLeaf93 52 4 80 1 40 0 20 0 11 4 63 565516583698379689789The spread of each set of data can be seen graphically from the stem and leaf plot. It can beseen that although brand X showed a little more variability than the ordinary brand thebatteries generally lasted longer.Parallel Box PlotsThe above data can also be compared by using parallel boxplots. The boxplots share acommon scale. Quantitative comparisons can be made between the sets of data.The 5-Number Summaries of both types of batteries are given below. You can work themout from the stem plots or by using your calculator.Brand XXmin69Lower Quartile Q195Median Q2109.5Upper Quartile Q3122.5Xmax146Ordinary BrandXmin60Lower Quartile Q178.5Median Q287.5Upper Quartile Q397.5Xmax114Page 17 of 21
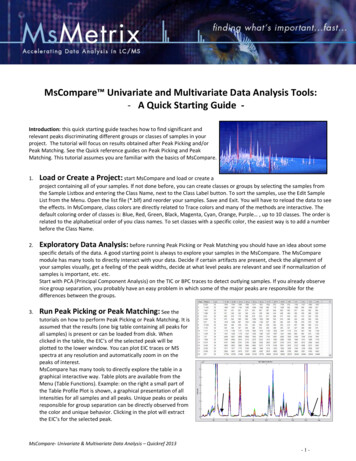
Univariate Statistics SummaryThe following parallel boxplots can be drawn to compare the data.50607080Time in Hours90100110120130140150Brand XOrdinary BrandFrom the box plots it can be seen that:1. Brand X showed more variability in its performance than the ordinary brand. Brand X range 77, ordinary brand range 54. Brand X interquartile range 27.5 and ordinary brandinterquartile range 19.02. The longest lifetime recorded was that of a Brand X battery of 146 hours3. The shortest lifetime recorded was that of an ordinary battery of 60 hours.4. Brand X battery median lifetime (109.5 hours) was better than that of an ordinary battery(87.5 hours)5. Over one quarter of Brand X batteries were better performers than the best ordinary brandbattery (that is, had longer lifetimes than the longest of the ordinary brand batteries’lifetimes)The Mean, Standard Deviation and Normal DistributionThe MeanThe mean of a set of data, 𝑥̅ , is given by:𝑥̅ 𝑥𝑛, 𝑤ℎ𝑒𝑟𝑒, 𝑥 represents the sum of all theobservations in the data set and n represents the number of observations in the data set.For example the mean of 4, 7, 9, 12 and 18 is given by:𝑥̅ 4 7 9 12 18 105The mean is often used as the everyday average and gives a measure of the centre of a distribution.The mean is sometimes affected by outliers (extreme values) and the median is often a betteraverage to use as it is not affected by extreme values.The Standard DeviationThe standard deviation gives a measure of how the data is spread around the mean. The formula forthe standard deviation is given below: (𝑥 𝑥̅ )2𝑠 𝑛 1Fortunately, the calculator can be used to find the standard deviation. On the calculator it is denotedby 𝐬𝐱.Page 18 of 21
Univariate Statistics SummaryThe 68%-95%-99.7% Rule applied to the Normal DistributionMany sets of data are approximately symmetric forming a "bell-shaped" curve. We refer to this typeof data as a normal distribution. Examples include birth weights, people's heights etc. Data that isnormally distributed have their symmetrical bell-shaped distribution centred on the mean value, 𝑥̅ .The above data of the heights of people form a bell-shape and approximates a normal distribution.Page 19 of 21
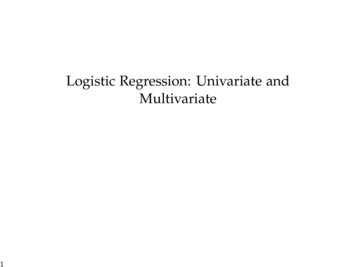
Univariate Statistics SummaryUsing the symmetry of the bell-shaped curve and the above rules various percentages can becalculated.Z-ScoresTo compare scores in different distributions we can make use of z-scores. The z-score, also known asthe standardised score, indicates the position of a score in relation to the mean. It gives the numberof standard deviations that the score is from the mean. A z score can be both positive and negative.A z-score of 0 indicates that the score is equal to the mean, a negative z-score indicates that thescore is below the mean and a positive z-score indicates that the score is above the mean. A scorethat is exactly 1 standard deviation above the mean has a z-score of 1. A score that is exactly 2standard deviations below the mean has a z-score of 2.Not all z-scores will be whole numbers; in fact most will not be. A whole number indicates only thatthe score is an exact number of standard deviations above or below the mean.For example, if the mean value of the IQ‘s of a group of students is 100 and the standard deviation is15, an IQ of 88 would be represented by a z score of 0.8, as shown below.𝑧 𝑥 𝑥̅88 100 0.8𝑠15The negative value indicates that the IQ of 88 is below the mean but by less than one standarddeviation.Page 20 of 21
Univariate Statistics SummaryUsing Z-Scores to Compare DataPage 21 of 21
Univariate Statistics Summary Page 4 of 21 Example 3 Represent the data in a. a histogram b. a frequency polygon a. b. Notice that the numbers are placed at the edges of the bars along the x-axis for grouped data. Types of Average There are three types of average which can represent a set of data. An average is a measure of central tendency .