Transcription
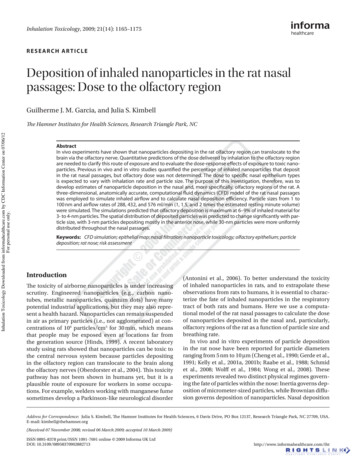
Inhalation Toxicology, 2009; 21(14): 1165–1175R e s e a r c h Ar t i c l eDeposition of inhaled nanoparticles in the rat nasalpassages: Dose to the olfactory regionGuilherme J. M. Garcia, and Julia S. KimbellInhalation Toxicology Downloaded from informahealthcare.com by CDC Information Center on 07/06/12For personal use only.The Hamner Institutes for Health Sciences, Research Triangle Park, NCAbstractIn vivo experiments have shown that nanoparticles depositing in the rat olfactory region can translocate to thebrain via the olfactory nerve. Quantitative predictions of the dose delivered by inhalation to the olfactory regionare needed to clarify this route of exposure and to evaluate the dose-response effects of exposure to toxic nanoparticles. Previous in vivo and in vitro studies quantified the percentage of inhaled nanoparticles that depositin the rat nasal passages, but olfactory dose was not determined. The dose to specific nasal epithelium typesis expected to vary with inhalation rate and particle size. The purpose of this investigation, therefore, was todevelop estimates of nanoparticle deposition in the nasal and, more specifically, olfactory regions of the rat. Athree-dimensional, anatomically accurate, computational fluid dynamics (CFD) model of the rat nasal passageswas employed to simulate inhaled airflow and to calculate nasal deposition efficiency. Particle sizes from 1 to100 nm and airflow rates of 288, 432, and 576 ml/min (1, 1.5, and 2 times the estimated resting minute volume)were simulated. The simulations predicted that olfactory deposition is maximum at 6–9% of inhaled material for3- to 4-nm particles. The spatial distribution of deposited particles was predicted to change significantly with particle size, with 3-nm particles depositing mostly in the anterior nose, while 30-nm particles were more uniformlydistributed throughout the nasal passages.Keywords: CFD simulation; epithelial map; nasal filtration; nanoparticle toxicology; olfactory epithelium; particledeposition; rat nose; risk assessmentIntroductionThe toxicity of airborne nanoparticles is under increasingscrutiny. Engineered nanoparticles (e.g., carbon nanotubes, metallic nanoparticles, quantum dots) have manypotential industrial applications, but they may also represent a health hazard. Nanoparticles can remain suspendedin air as primary particles (i.e., not agglomerated) at concentrations of 106 particles/cm3 for 30 min, which meansthat people may be exposed even at locations far fromthe generation source (Hinds, 1999). A recent laboratorystudy using rats showed that nanoparticles can be toxic tothe central nervous system because particles depositingin the olfactory region can translocate to the brain alongthe olfactory nerves (Oberdorster et al., 2004). This toxicitypathway has not been shown in humans yet, but it is aplausible route of exposure for workers in some occupations. For example, welders working with manganese fumesometimes develop a Parkinson-like neurological disorder(Antonini et al., 2006). To better understand the toxicityof inhaled nanoparticles in rats, and to extrapolate theseobservations from rats to humans, it is essential to characterize the fate of inhaled nanoparticles in the respiratorytract of both rats and humans. Here we use a computational model of the rat nasal passages to calculate the doseof nanoparticles deposited in the nasal and, particularly,olfactory regions of the rat as a function of particle size andbreathing rate.In vivo and in vitro experiments of particle depositionin the rat nose have been reported for particle diametersranging from 5 nm to 10 m (Cheng et al., 1990; Gerde et al.,1991; Kelly et al., 2001a, 2001b; Raabe et al., 1988; Schmidet al., 2008; Wolff et al., 1984; Wong et al., 2008). These experiments revealed two distinct physical regimes governing the fate of particles within the nose: Inertia governs deposition of micrometer-sized particles, while Brownian diffusion governs deposition of nanoparticles. Nasal depositionAddress for Correspondence: Julia S. Kimbell, The Hamner Institutes for Health Sciences, 6 Davis Drive, PO Box 12137, Research Triangle Park, NC 27709, USA.E-mail: kimbell@thehamner.org(Received 07 November 2008; revised 06 March 2009; accepted 10 March 2009)ISSN 0895-8378 print/ISSN 1091-7691 online 2009 Informa UK LtdDOI: are.com/iht
Inhalation Toxicology Downloaded from informahealthcare.com by CDC Information Center on 07/06/12For personal use only.1166 G. J. M. Garcia and J. S. Kimbellis less than 10% for 0.5 m particles, assuming a particledensity of 1 g/cm3 and a resting minute volume of 250 ml/s(Kelly et al., 2001a, 2001b; Raabe et al., 1988). Depositionincreases rapidly as particle inertia increases, reachingnearly 100% deposition for 10- m particles. Nasal deposition of 5-nm particles is estimated to be approximately 60%,decreasing to approximately 5% for 100-nm particles due tothe decreased Brownian motion of larger particles (Chenget al., 1990; Gerde et al., 1991; Wolff et al., 1984; Wong et al.,2008). Although these studies describe how total nasaldeposition varies with particle size and breathing rate, thedose to the rat olfactory region was not evaluated.Estimating the olfactory dose of inhaled nanoparticlesthrough in vivo or in vitro experiments is challenging dueto the complex geometry of the rat nasal passages and thedifficulty of performing accurate measurements for particlesizes with low nasal deposition. Fortunately, computationalmodels of the rat nose are available, making it possible toestimate nasal deposition under various scenarios of particle size and inhalation rate. Kimbell and collaboratorsdeveloped an anatomically correct, computational fluiddynamics (CFD) model of a F344 rat nose and used it toinvestigate airflow patterns during inspiration (Kimbellet al., 1993, 1997). Their computer simulations revealed thatless than 20% of inhaled air reaches the olfactory region,while the bulk of airflow travels ventrally, going directly tothe nasopharynx (Kimbell et al., 1997). These airflow patterns were compared to streamlines in water–dye experiments using nasal casts and a good agreement was foundbetween simulations and experiments (Kimbell et al., 1993,1997). Later this model was used to investigate nasal uptakeof toxic gases, such as formaldehyde and hydrogen sulfide(Kimbell et al., 2001a, 2001b; Kimbell & Subramaniam,2001; Schroeter et al., 2006). Such analyses are important todetermine the dose-response relationship of inhaled toxicgases.Computer models of nasal airflow in the SpragueDawley rat were recently reported by Minard and coworkers (Minard et al., 2006) and Yang and colleagues (Yanget al., 2007a, 2007b). The airflow patterns reported in thesestudies were in good agreement with those reported byKimbell et al. for the F344 rat (Minard et al., 2006; Yanget al., 2007). Yang and colleagues (2007) also investigatedthe deposition of odorant molecules in the rat olfactoryregion. They predicted that highly water-soluble odorantmolecules are absorbed mostly in the anterior nose, whileodorant molecules with low water solubility have a moreuniform absorption along the nasal mucosa. These authorsalso predicted that olfactory deposition of odorant molecules is smaller during expiration than during inspirationbecause airflow fraction to the olfactory region is smallerduring expiration.In this article we report estimates of nanoparticle deposition in the rat olfactory region. Nasal filtration of 1- to100-nm particles is investigated using the CFD model ofthe entire F344 rat nasal passages developed by Kimbelland collaborators (Kimbell et al., 1993, 1997). Curve fittingsare provided so that nasal and olfactory deposition can beestimated for particle sizes and airflow rates that were notsimulated. We also describe how the locations where particles deposit depend on particle size and airflow rate. Theseestimates will be useful in assessing the toxicity and thedose-response relationship of inhaled nanoparticles.MethodsDescription of the computational modelThe anatomical reconstruction of the rat nasal passagesemployed in this study was developed in earlier studies(Kimbell et al., 1993, 1997) and its development is summarized here briefly. The nasal cavity of an 18-wk-old,male F344 rat (body mass 315 g) was fixed in formalinand embedded in a large block of acrylic resin. This blockwas later sectioned from the nostrils to the nasopharynx in50- m intervals. Photographs of these sections were takenand tracings of the airway perimeters of the right nasalpassage were digitally scanned. Using in-house software,a three-dimensional computational reconstruction of theright nasal passage was obtained. This reconstruction wasaccomplished in two consecutive efforts: The anterior partof the nose was built first (Kimbell et al., 1993) and thenthe remainder of nose was added in a subsequent study(Kimbell et al., 1997). The model extends from the nostrils tothe nasopharynx, including all the complex anatomy of themain nasal passages. In addition, it includes the maxillarysinus, but excludes the other paranasal sinuses (Kimbellet al., 1997).In a previous study (Andersen et al., 1999), the four typesof nasal epithelium (squamous, transitional, respiratory,and olfactory) were identified using light microscopy onhistological slides prepared using hematoxylin and eosin(H&E) staining. The location of each epithelium type wasmapped onto the surface of the three-dimensional (3D)computational mesh representing the rat nasal passages.The final result was a 3D, anatomically accurate reconstruction of the right nasal passage of a F344 rat with a surfacemap localizing the four epithelium types (see Figure 1 andTable 1). The original model was a mesh with 112,000 brickshaped (hexahedral) elements.For the present study, the original computational meshof the rat nasal passages (Kimbell et al., 1997; Andersenet al., 1999) was imported into the commercial softwareICEM-CFD (ANSYS, Inc., Canonsburg, PA), where the surface of the original mesh was used to produce a tetrahedral mesh with higher mesh density. The conversionfrom a hexahedral to a tetrahedral mesh was neededbecause we are progressively migrating our models fromolder CFD software (FIDAP) to newer platforms (Fluent).ICEM-CFD allowed for smoothing the boundaries betweendifferent epithelial types in areas where these boundarieswere irregular in the original hexahedral mesh. This slightmodification did not affect the three-dimensional nasalgeometry, nor did it affect significantly the surface areaof each epithelium type. The simulations reported here
Inhaled nanoparticles—dose to rat olfactory region 1167LATERAL WALLSQUAMOUS EPITHELIUMTRANSITIONAL EPITHELIUMRESPIRATORY EPITHELIUMSEPTAL WALLOLFACTORY EPITHELIUMNOSTRIL SURFACEInhalation Toxicology Downloaded from informahealthcare.com by CDC Information Center on 07/06/12For personal use only.SEPTAL WINDOWFigure 1. Computational geometry and epithelial map of the right nasalpassage of the F344 rat. The nostril surface is displayed in red, while theseptal window (symmetry plane in the nasopharynx) is displayed ingreen. (See colour version of this figure online at www.informahealthcare.com/iht).Table 1. Surface area of the four nasal epithelium types in the F344 ratcomputational model (right nasal passage only).Experiments bComputational model aPercentage of Percentage ofEpithelial typeSurface areasurface areasurface area10.2%3 1%Squamous epithelium92.7 mm211.3%—Transitional epithelium 103.6 mm237.9%46 3%Respiratory epithelium345.7 mm240.6%50 6%Olfactory epithelium370.8 mm2TOTAL912.8 mm2100.0%100%Note. The distribution of epithelial types in the model is compared toexperimental results reported in the literature.aThe distribution of epithelial types in the model was based on thehistology diagrams by Mery et al. (1994).Histological measurements by Gross et al. (1982). The tip of the nosewas excluded from this study, so that these numbers are expectedto underpredict the percentage of surface area lined with squamousepithelium and overpredict the percentage of surface area lined withrespiratory and olfactory epithelia.bwere performed in a mesh with 3.2 million tetrahedralelements. A mesh density test was performed to confirmthat all results were independent of mesh density. Thequality of the tetrahedra was checked to ensure that allcells had an aspect ratio larger than 0.3, a value needed toavoid distorted elements and optimize the accuracy of thenumerical simulations.Simulation methodsThe dose of nanoparticles deposited in the nasal cavityand the dose deposited in the olfactory epithelium wereestimated for 1- to 100-nm particles using computationalfluid dynamics (CFD). CFD is an appropriate techniqueto quantify nanoparticle deposition in the rat olfactoryregion because it allows the calculation of regional doses,so that the contribution of olfactory deposition to theoverall nasal deposition can be easily computed if a 3Dmap of the nasal epithelium types is incorporated into themodel. In contrast, quantifying the olfactory dose is morechallenging with in vivo and in vitro techniques due tothe difficulty of distinguishing olfactory deposition fromdeposition in other epithelium types, given the small sizeof the rat nasal passages. Another advantage of CFD modeling over in vivo and in vitro techniques is that, after themodel is built, multiple particle sizes and airflow rates canbe readily simulated without significant increase in labortime and costs.CFD simulations were conducted in Fluent (ANSYS,Inc., Lebanon, NH). Inspiratory airflow was modeled aslaminar and at steady state. The assumption of laminar flowis supported by the low Reynolds number (Re) in the ratnose during resting breathing. For the airflow rates studiedhere, Re is in the range 121 to 242 (Kimbell et al., 1997).The assumption of laminar flow is further supported byZhao and collaborators (2006). These authors investigatedolfactory deposition of odorant particles in a human CFDmodel. After simulating laminar and turbulent flows, theyconcluded that the two models provided similar patternsof olfactory deposition for airflow rates between 300 and1000 ml/s per nostril.Flow field disturbances caused by the presence ofnanoparticles in the flow were considered negligible. Since diffusional transport mechanisms dominate for 1- to 100nm particles, an Eulerian approach was used for particletransport. In this approach, the trajectories of individual particles are not computed; instead, inhaled nanoparticles are modeled as a uniform mixture of particles andair, much as gas transport is modeled. Appropriate diffusion coefficients were computed from particle size (Hinds,1999). Details of the simulation methods are described inAppendix A.In order to assess the effects of airflow rate on deposition,simulations were performed for a series of airflow rates. Theresting minute volume of the 315-g rat upon which the CFDmodel is based is estimated to be 288 ml/min (Kimbell et al.,2001b). Because exhalation takes half the time of a breath,average inspiratory airflow is twice the minute volume(i.e., 576 ml/min). However, only the right nasal passage is represented in our computer model, and thus the steadystate inspiratory airflow rate that corresponds to restingbreathing in our model is 288 ml/min. We investigated threedifferent inspiratory airflow rates, namely, 288 ml/min,432 ml/min, and 576 ml/min, corresponding to 1 , 1.5 ,and 2 the resting breathing rate per nostril.Curve fittingNasal deposition efficiency was plotted against particle sizefor each airflow rate. Curves were fitted to the data so thatdeposition could be estimated for other sets of parametersthat were not simulated. Ingham (1991) proposed that nanoparticle deposition in the nose is a function of two nondimensional parameters: Schmidt number, Sc, defined asSc /Dp, where is the kinematic viscosity of air and Dpis the particle diffusivity (Hinds, 1999), and , a diffusionparameter defined as DpL/(4UR2), where L is a characteristic length of the geometry, U is average inlet velocity,and R is airway radius (Zhang & Martonen, 1997). Because
1168 G. J. M. Garcia and J. S. Kimbell(1)where Dp is in square centimeters per second, Q is in milliliters per minute per nostril, and a, b, and c are fitted parameters. This functional form was selected because it obeysthe requirement 0 η 1 and provides good data fits ofnasal deposition in humans (Cheng, 2003). All curve-fittinganalyses were made using SigmaPlot (Systat Software, Inc.,San Jose, CA).The olfactory fraction of total nasal deposition (FO) wasalso computed in the CFD simulations and plotted againstparticle size. Curves were fitted to the simulation data withthe formula (Dp ) d FO aQ b exp c Q e (2)where FO is the percentage of the particles depositing in thenose that deposited in the olfactory region and a, b, c, d,and e are fitted parameters [different from those in Eq. (1)].The term Qb was included in Eq. (2) because it provided aslightly better fit than the same functional form with b 0.Once the total nasal deposition efficiency ( ) and theolfactory fraction (FO) were calculated, olfactory deposition( O) was obtained byηO FO η1.0SIMULATION - 288 ml/min (1 nostril)SIMULATION - 432 ml/min (1 nostril)0.8SIMULATION - 576 ml/min (1 nostril)Curve Fitting0.60.40.20.0110(3)where O is the fraction of inhaled nanoparticles that depositin the olfactory region.Hotspots of particle deposition are of particular interestin toxicology and risk assessment. To describe the spatialpatterns of nanoparticle deposition, the locations of deposited particles were observed using Fluent and Fieldview(Intelligent Light, Rutherford, NJ). Different particle sizesled to different patterns of deposition within the nose. Tocharacterize the effect of particle size on the spatial distribution of deposited particles, the wall mass flux was averagedalong the perimeter of coronal cross sections and plottedas a function of the distance from the nostrils for differentparticle sizes.ResultsTotal nasal deposition of inhaled nanoparticles was predicted to decrease as particle size increased (Figure 2). Nasaldeposition efficiency was approximately 95% for 1-nm particles, decreasing to 20% for 10-nm particles, and to 2% for100Particle Size (nm)Figure 2. Deposition efficiency of nanoparticles in the range of 1–100 nmin the rat nasal cavity. The solid lines show the fitting obtained using Eq. (1)where a 181 49, b 0.36 0.04, and c 0.606 0.009 (r2 .9986).Olfactory Fraction of nasal depositionInhalation Toxicology Downloaded from informahealthcare.com by CDC Information Center on 07/06/12For personal use only. (Dp )c η 1 exp a b Q 100-nm particles. Nasal deposition efficiency also variedwith breathing rate. Increasing the inhalation rate reducednasal deposition efficiency. This behavior is characteristicof diffusion-dominated particle motion, since increasingthe airflow rate reduces the transit time of the particles andtherefore decreases the percentage of inhaled particles thathit the wall through Brownian motion (Hinds, 1999).Although total nasal deposition decreased for largerparticle sizes (Figure 2), among the particles that depositedin the nose, the larger nanoparticles deposited at higherproportions in the olfactory region (Figure 3). Olfactoryfraction of nasal deposition increased from 2% for 1-nmparticles to 20% for 10-nm particles and to 35% for 100-nmparticles for the resting airflow rate (288 ml/min/nostril).Increasing the airflow rate raised the olfactory fraction(Figure 3).Olfactory deposition ( O) was computed by multiplyingtotal nasal deposition by the olfactory fraction of total nasaldeposition (Equation (3)). Olfactory deposition was less than10% for all particle sizes and inhalation rates (Figure 4). ForNasal Deposition Efficiencya single nasal geometry was investigated, the parameters Land R are constant, so that nasal deposition efficiency is afunction only of the particle diffusivity Dp and the averagevelocity U. Because U is proportional to the airflow rate Q,namely, U Q/R2, nasal deposition in our model is a function of Dp and Q alone. Total nasal deposition ( ) was fittedwith the equation (Cheng, 2003)0.6SIMULATION - 288 ml/min (1 nostril)0.5SIMULATION - 432 ml/min (1 nostril)0.4Curve FittingSIMULATION - 576 ml/min (1 nostril)0.30.20.10.0110100Particle Size (nm)Figure 3. Percentage of the particles deposited in the nasal cavity thatdeposit in the olfactory region (Olfactory Fraction). The solid lines showthe fitting obtained using Eq. (2) where a 0.30 0.04, b 0.06 0.02,c 158 46, d 0.300 0.009, and e 0.55 0.05 (r2 .9983).
Inhaled nanoparticles—dose to rat olfactory region 1169SIMULATION - 288 ml/min (1 nostril)0.103 nm / Q 288 ml/min1.0E-053 nm / Q 576 ml/minSIMULATION - 576 ml/min (1 nostril)0.08Curve Fitting0.060.04Wall Flux (µg/s.mm2)Olfactory DepositionSIMULATION - 432 ml/min (1 nostril)30 nm / Q 288 ml/min1.0E-070.021.0E-080.00110100Particle Size (nm)Figure 4. Nanoparticle deposition in the rat olfactory region as a functionof particle size. The solid lines show the curves obtained using Eq. (3).Table 2. Values of fitted constants and correlation coefficients (r2)obtained by fitting the computational data with Eqs. (1) and (2).abcder2Eq. (1) 181 49 0.36 0.04 0.606 0.009——.9986Eq. (2) 0.30 0.04 0.06 0.02 158 46 0.300 0.009 0.55 0.05 .9983LATERAL WALLdp 3 nmSEPTAL WALL0dp 30 nmInhalation Toxicology Downloaded from informahealthcare.com by CDC Information Center on 07/06/12For personal use only.30 nm / Q 576 ml/min1.0E-06NOSTRILfmaxNOSTRILNASOPHARYNX 00.1* fmaxFigure 5. Deposition patterns of 3-nm and 30-nm particles in the ratnasal cavity. While the 3-nm particles deposit preferentially in the anterior nose, 30-nm particles deposit more uniformly in the nasal passages.The scale of the color maps is specific to each particle size because thereis less deposition for 30-nm particles than for 3-nm particles. The constant fmax is not the overall maximum flux, but rather it was chosen tooptimize the visualization of the deposition patterns. Values above fmax inthe 3-nm simulation and above 0.1 fmax in the 30-nm simulations are displayed in red. The nostril and the septal window (symmetry plane in thenasopharynx; see Figure 1) are displayed in purple. (See colour version ofthis figure online at www.informahealthcare.com/iht).the resting inhalation rate, olfactory deposition increasedfrom 2% for 1-nm particles to a maximum of 6% for 4-nmparticles, decreasing to 4% for 10-nm particles, and finallydecreasing to less than 1% for 100-nm particles (Figure 4).The effect of inhalation rate on olfactory deposition was nonuniform. For the smallest nanoparticles ( 10 nm), olfactorydeposition increased as airflow rate increased. In contrast,inhalation rate did not influence olfactory deposition oflarger nanoparticles ( 10 nm). The computational data wasfitted to Eqs. (1) and (2), as described in the Methods section (Table 2, Figures 2 4)It was observed that 1- to 10-nm particles deposit preferentially in the anterior nose, while 10- to 100-nm particles051015202530Distance from nostrils (mm)Figure 6. Deposition of nanoparticles in the rat nasal mucosa averagedalong the perimeter of coronal cross sections and plotted as a function of the distance from the nostrils. The atmospheric nanoparticle concentration was 160 g/m3, which is the experimental atmosphericconcentration in Oberdorster et al. (2004). Curves are shown for airflowrates of 288 ml/min/nostril and 576 ml/min/nostril, corresponding to 1 and 2 the minute volume at rest, and particles sizes of 3 nm and 30 nm.Table 3. Epithelial fraction of total nasal deposition and percentage ofinhaled particles deposited in each epithelial type for 3-nm and 30-nmparticles and airflow rates Q 288 ml/min/nostril and Q 576 ml/min/nostril, which correspond to 1 and 2 the airflow rate at rest.Epithelial fraction of total nasal depositionQ 288 ml/min/nostrilQ 576 ml/min/nostrilEpithelium type3 nm30 nm3 nm30 ry9.7%29.1%15.3%34.3%Whole nose100%100%100%100%Percentage of inhaled particles deposited in each epithelium typeQ 288 ml/min/nostrilQ 576 ml/min/nostrilEpithelium type3 nm30 nm3 nm30 1.5%8.7%1.1%Whole Nose64.3%5.1%56.6%3.1%deposit more uniformly in the nasal cavity (Figure 5). To illustrate this behavior, we considered an atmospheric nanoparticle concentration of 160 g/m3, which is the atmosphericconcentration used in the experiments of Oberdorster andcolleagues (2004). The mass of nanoparticles depositing inthe nasal passages was averaged along the perimeter of coronal cross sections and plotted as a function of the distancefrom the nostril for 3-nm and 30-nm particles (Figure 6). The3-nm particles had a higher deposition in the anterior nose,while 30-nm particles deposited more uniformly throughoutthe nose (Figures 5 and 6).This particle-size effect on the spatial distribution ofdeposited particles meant that the dose delivered to eachepithelium type was not a constant fraction of total nasaldeposition. For instance, due to its anterior location in thenose, the squamous epithelium accounted for a higher
1170 G. J. M. Garcia and J. S. Kimbellfraction of total nasal deposition for 3-nm particles than for30-nm particles (Table 3). As a consequence, only a smallfraction of 3-nm particles reached the olfactory region, sothat olfactory deposition of 3-nm particles was only 10% oftotal nasal deposition for Q 288 ml/min/ nostril (Table 3).In contrast, 30-nm particles had a proportionally smallerdeposition in the squamous epithelium, so that olfactory deposition of 30-nm particles accounted for a largerfraction (29% for Q 288 ml/min/nostril) of total nasaldeposition.The use of a three-dimensional computational model intowhich the olfactory region has been mapped is a cost effective technique to quantify olfactory deposition undervarious scenarios of particle size and breathing rate. Thecomputer simulations predicted the existence of a particlesize, namely, 3 to 4 nm, that maximizes olfactory depositionin the rat (Figure 4). This phenomenon is a consequence ofthe interplay between accessibility of particles to the olfactory region and how quickly particles diffuse from the airstream to the nasal mucosa. The smallest particles (1 nm)diffuse quickly and thus are trapped mainly in the anterior portion of the nose (Figures 5 and 6). As particle sizeincreases from 1 nm to 3 nm, filtration of particles upstreamfrom the olfactory region decreases, and thus more particlesreach the olfactory region and olfactory deposition increases(Figure 4). As particle size continues to increase beyond 3 to4 nm, the fraction of particles reaching the olfactory regioncontinues to rise (Figure B-2(A) in Appendix B), but olfactory deposition starts to drop because particle diffusiondecreases (Figure 4).1.0SIMULATION - 300 ml/min (1 nostril)EXPERIMENTAL - IN VIVO - Gerde et al. (1991)Nasal Deposition EfficiencyInhalation Toxicology Downloaded from informahealthcare.com by CDC Information Center on 07/06/12For personal use only.DiscussionTo the best of our knowledge, this is the first study toquantify deposition of inhaled nanoparticles in the ratolfactory region. To validate our computational predictions, we compared our results to in vivo and in vitromeasurements of total deposition in the nasal passages(Cheng et al., 1990; Gerde et al., 1991; Wong et al., 2008).The computational predictions are somewhat lower thanthe experimental measurements as shown in Figure 7for Q 300 ml/min/nostril (similar comparisons wereobtained for other airflow rates). The diminished deposition in our study is likely due to the absence of the pharynxand larynx in the computational geometry, while the ratnasal replicas used by Cheng et al. (1990) and Wong et al.(2008) included the pharynx and larynx. Likewise, the“nasal” airway in the in vivo study by Gerde et al. (1991)included the larynx, pharynx, nasal passages, and, to someextent, the exposure mask. It is difficult to quantify precisely by how much inclusion of the pharynx and larynxin these experiments increased the deposition efficiencyas compared to nasal deposition alone. In any case, thelower deposition predicted by our simulations is consistent with the geometrical differences between simulationsand experiments.Another possible explanation for the lower total nasaldeposition in the simulations is that perhaps the geometryof the computational model is not as narrow as the nasalpassages of live rats and replica casts used in the experiments. In order to assess this possibility, we compare inTable 4 the geometry of our model to other literature reports.The surface area of our rat CFD model (1826 mm2, assuming that the left and right nasal passages are symmetrical)is somewhat larger than experimental reports (920 mm2 to1344 mm2). The volume of our CFD model, 323 mm3, liesbetween the values of 257 mm3 and 400 mm3 reported by0.8EXPERIMENTAL - IN VITRO - Cheng et al. (1990)EXPERIMENTAL - IN VITRO - Wong et al. (2008)0.60.40.20.01101001000Particle Size (nm)Figure 7. Nanoparticle deposition in the rat nasal cavity. Comparison of computational predictions and experimental results for a constant airflow rateof 300 ml/min/nostril. Deposition efficiency was estimated from fitted curves when direct measurements were not available for an airflow rate of 300 ml/min/nostril. The greater deposition efficiency in the experimental data may be due to the inclusion of the larynx and the pharynx in the nasal replicasand rats used in
ICEM-CFD (ANSYS, Inc., Canonsburg, PA), where the surface of the original mesh was used to produce a tet-rahedral mesh with higher mesh density. The conversion from a hexahedral to a tetrahedral mesh was needed because we are progressively migrating our models from older CFD software (FIDAP) to newer platforms (Fluent).