Transcription
Iranian Journal of Materials Science & Engineering Vol. 8, Number 2, Spring 2011PARTICLE SIZE CHARACTERIZATION OF NANOPARTICLES – APRACTICALAPPROACHB. Akbari1, M. Pirhadi Tavandashti2*, and M. Zandrahimi2* m.pirhadi@hotmail.comReceived: August 201012Accepted: April 2011Research Center for Metallic Materials, M.U, Tehran, Iran.Department of Materials Science and Engineering, Shahid Bahonar University of Kerman, Kerman, Iran.Abstract: Most properties of nanoparticles are size-dependent. In fact, the novel properties of nanoaprticles do notprevail until the size has been reduced to the nanometer scale. The particle size and size distribution of aluminananoparticle, as a critical properties, have been determined by transmission electron microscopy (TEM), photoncorrelation spectroscopy (PCS), surface area analysis (BET) and x-ray diffraction peak broadening analysis. Theparticle size was found to be in the range of 5-95nm. Cumulative percentage frequency plot of the data extracted formTEM images indicates that particle size distribution obeys the log-normal function. The TEM images also reveal thatparticles are spherical in shape and loosely agglomerated. Comparing of the XRD and TEM results shows that theparticles are single-crystal. The HRTEM images also verify that the particles have a single-crystal nature. Incomparison, there is a good correlation between the BET, XRD and TEM measurements other than PCS that issensitive to the presence of the agglomerates.Keywords: Particle size, Alumina, Nanoparticles, TEM, XRD, BET, PCS1. INTRODUCTIONNanoparticles and nanoparticle-based devicesare of interest in numerous industrial applicationsdue to their unique and often advantageousproperties. The high surface-to-volume ratiotogether with size effects (quantum effects) ofnanoparticles introduces many size-dependentphenomena such as chemical, electronic,magnetic and mechanical properties. Forexample, the melting point of nanoparticles isevidently decreased when the size is reached tothe nanometer scale [1, 2]. The particle sizeplays a crucial role in nanoparticle properties andtherefore an essential task in propertycharacterization of nanoparticles is particlesizing.The particle size and size distribution ofnanoparticles can be determined using numerouscommercially available instruments. Instrumentscan be used for the analysis of dry powders andpowders dispersed in suspension.In general, there are two basic methods ofdefining particle size. The first method is toinspect the particles and make actualmeasurements of their dimensions. Microscopictechniques, for example, measure manydimensional parameters from particle images.48The second method utilizes the relationshipbetween particle behavior and its size. This oftenimplies an assumption of equivalent sphericalsize developed using a size-dependent propertyof the particle and relating it to a linear dimension[3]. Equivalent spherical diameters are thediameters of spheres that have the same orequivalent length, volume and etc. as irregularparticles themselves. An example of this methodis photon correlation spectroscopy (PCS) that thedynamic fluctuation of the scattered lightintensity is the basis for calculation of theaverage particle size [4]. It is not possible todiscuss rationally the size of a particle withoutconsidering the three-dimensional characteristics(shape) of the particle itself. This is because thesize of a particle is expressed either in terms oflinear dimension characteristics derived from itsshape or in terms of its projected surface orvolume. On the other hand, because the particlesbeing studied are not the exact same size,information is required about the average particlesize and the distribution of sizes about thataverage.Additionally, by comparing the results fromdifferent instruments with each other, one canobtain extra information about the system. Forexample, ratio of the median diameter from PCS
B. Akbari, M. Pirhadi Tavandashti and M. Zandrahimiand the dBET can be defined as the agglomerationfactor FAG indicative of the state ofagglomeration of the nanoaprticles [4, 5].Some studies were concerned with the particlesizing of nanoparticles. In a study by Staiger etal., particle size of alumina nanoparticles hasbeen measured and an assessment ofagglomeration of the nanoparticles has been doneusing the results [4]. Bowen has obtained particlesize distribution of ceramic nanoparticles usingdifferent instrument from nanometer tomillimeter [6]. In a study, Rawle has measuredthe particle size of barium ferrite nanoparticles bysurface area analysis and laser diffraction. Thedifferent interpretations of the results have beendiscussed and shown the nanopowders arecollections of micron-sized (agglomerates andaggregates) which simultaneously exhibit bothnano and micron-based properties [7].In this study, the different techniques includetransmission electron microscopy (TEM), photoncorrelation spectroscopy (PCS), surface areaanalysis (BET) and x-ray diffraction peakbroadening analysis have been used tocharacterize the particle size of ies and limitations of these techniquesare examined, together with a brief description ofthe general principles on which these methods arebased.2. EXPERIMENTAL PROCEDUREAlumina nanoparticles were prepared in a DCplasma reactor (Plasma Technik, Swiss). In thistechnique, Aluminum metal powder with theaverage size of 45µm was injected into theplasma jet. The powder particles melt andvaporize and the molten droplets and vapors ofaluminum react with oxygen resulting in theformation of aluminum oxide. The subsequentrapid quenching of the system results inproducing nano-sized particles. The resultingproduct is a nano-sized white powder. The highresolution transmission electron microscope(HRTEM) images of the nanoparticles wereobtained with a FEI CM200 field emission TEMoperating at accelerating voltage of 200 kV.Sample preparation was done by dispersingpowder in methanol and ultrasounded for a fewminute and then one drop pipetted onto a carbonsupport film on a 3 mm copper grid. Imageanalysis on the alumina particles was carried outon various TEM images. The processing of theimage files was performed on more than 500particles using standard image analysis software"Soft-Imaging Software GmbH CM-Prof2.11.002".The BET (Brunauer -Emmett -Teller) surfacearea measurement was made using aconventional BET multi-point N2 truments Corp). The N2 adsorption wasmeasured from a six-point isotherm in a relativepressure rang of 0.05 to 0.3 at 77.3 K. Theassumption for the cross-sectional area of N2 wastaken to be 16.2(oA) 2 and the density used was3.65 g/cm3. The sample was prepared by heatingat 150 oC for 1hr while simultaneously a flow ofN2 gas across the sample tube seeps away theliberated contaminants.The particle size distribution of the powderwasmeasuredbyphotoncorrelationspectroscopy (PCS) using a Malvern ZetasizerNano ZS laser particle size analyzer. Theinstrument was equipped with a He-Ne lasersource ( ʄ 633 nm) and at scattering angle of1730. The dispersion concentration was around0.1 g/L. The suspension was prepared bydispersing the powder in distilled water andtreated for 6mins in an ultrasonic bath to obtain awell-dispersed suspension.The XRD pattern of the sample was collectedat room temperature on a Philips X’Pert Prodiffractometer, equipped with Cu target X-raytube with step size of 0.020 2è and time per stepof 0.3s.3. RESULTS AND DISCUSSION3. 1. Transmission Electron Microscopy (TEM)The TEM can yield information such asparticle size, size distribution and morphology ofthe nanoparticles. In particle size measurement,microscopy is the only method in which theindividual particles are directly observed andmeasured [8]. Typically, the calculated sizes are49
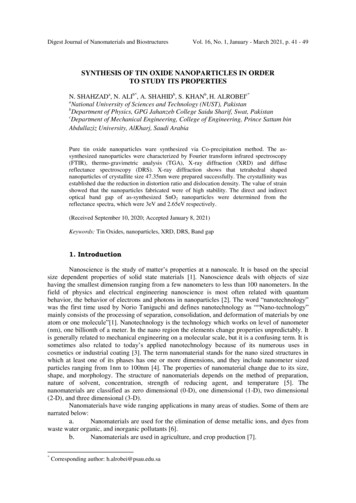
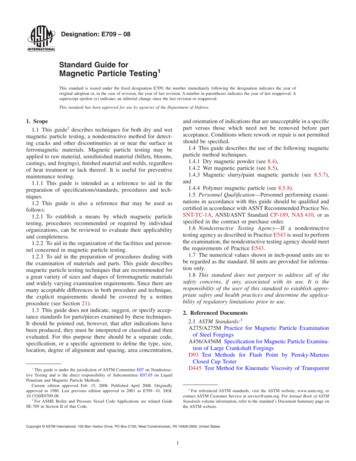
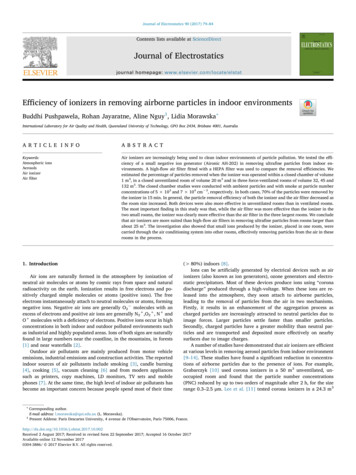
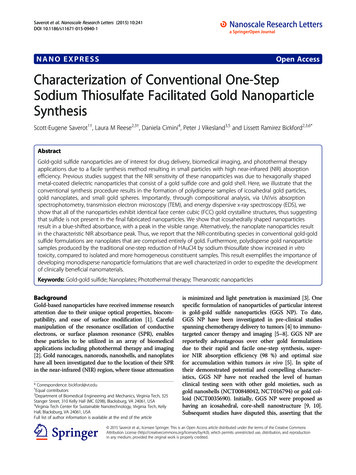
Iranian Journal of Materials Science & Engineering Vol. 8, Number 2, Spring 2011expressed as the diameter of a sphere that has thesame projected area as the projected image of theparticle. Manual or automatic techniques are usedfor particle size analysis. Manual technique isusually based on the use of a marking devicemoved along the particle to obtain a lineardimensional measure of the particle added up anddivided by the number of particles to get a meanresult [9]. TEM images can also be used to judgewhether good dispersion has been achieved orwhether agglomeration is present in the system.Electron microscopy requires elaborate samplepreparation and is slow and few particles areexamined. In combination with diffractionstudies, microscopy becomes a very valuable aidto the characterization of nanoparticles [10].Figure 1 illustrates HRTEM images of assynthesized Al2O3 nanoparticles. The imagesshow typical degrees of agglomeration andpolydispersity obtained in a thermal plasmaprocess. Typical nanoparticles are agglomeratesof several primary particles. The agglomeratesare termed as secondary particles. They formedwhen primary particles are held together by weaksurfaces forces (soft agglomerates) such as vander Waals or capillary forces or by strongchemical bonds (hard agglomerates) [1].The particle size data were obtained from thecounting of more than 500 particles. Particle sizeand size distribution data can be represented ineither a tabular or graphical form. Table 1summarizes the particle size data extracted formthe TEM images.Based on the particle size data given in table 1,Table 1. The particle size data extracted form the TEMimages.Mean (nm)24Median (nm)21.46Mode(nm)15.85Standard e size distribution was plotted. A typicalway to present the particle size and itsdistribution is in the form of a number-frequencyhistogram. A histogram is a bar graph thatillustrates the frequency of occurrence versus thesize range [11, 3]. Figure 2 shows numberfrequency histograms of particle size data inlinear scale. The smooth curve drawn through thehistogram is a valid size-frequency curve ifsufficient particles are counted and the sizeinterval is at least ten. Hundreds of particlesshould be measured to present statisticallyreliable mean size data. For instance, it has beenFig. 1. High-resolution TEM (HTREM) images of plasma-synthesized alumina nanoparticles.50
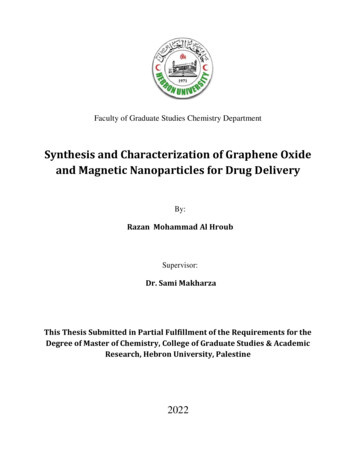
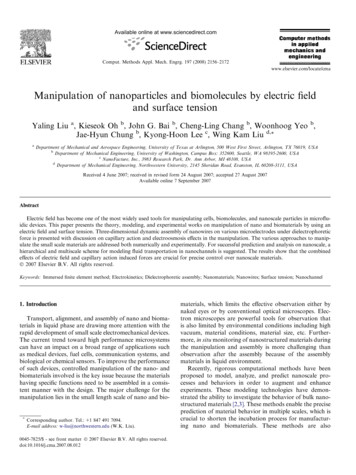
B. Akbari, M. Pirhadi Tavandashti and M. eanStDevN24.0512.20535001530456075Particle size (nm) in linear scale90Fig. 2. Number frequency histograms showing particle sizedistribution of plasma-synthesized alumina nanoparticles inlinear scale. The particle size data is based on the imageanalysis of more than 500 particles.proposed to measure 500-1000 grains for anoptimum sample size [12, 13].As it is observed in Fig.2, the size distribution ofthe particles is skewed toward the larger end of theparticle-size scale as the majority of real powdersamples when plotted on the linear scale [14].Despite the fact that the histogram reveals therange of the particle size, it is often insufficientfor finding a mathematical formula which fits thedistribution due to its shape changes with theparticle number. Thus, the particle size results arealso plotted as cumulative percentage frequencycurves as are shown in Fig.3. These curves can beplotted with either linear or logarithmic scales.From the plots, one can estimate the median andstandard deviation. Another advantage of thisplotting method is that it is easier to find a betterPercentage (% )99.990255075100fitting mathematical formula for the distribution.To verify this, we plot the cumulative percentagecurve with particle size axis in linear scale,Fig.3a. If the distribution is governed by a normalor Gaussian distribution formula, they shouldhave a straight-line fit [8, 12]. However, thefigure reveals that the distribution lies onsignificantly curved lines, which means thatGaussian does not adequately describe thedistribution. On the other hand, Fig 3.b containsthe same data with a logarithmic scale of theparticle size, and the distribution is fairly straight,which implies that the data can be moreaccurately represented by a log-normaldistribution formula. This governing formula isalso verified in the figure by solid line reflectingbest-fit log-normal distribution.To characterize the particle shape, differentshape factors are used. The irregularity parameter(IP) is a simple concept that is employed tocalculate the sphericity of particles. Thisdescriptor is used when particle size is measuredby microscopy method. For anisotropic particleswith a relatively regular morphology such as arod or plate one can define the irregularityparameter as the ratio of longest directions (themajor axes) to perpendicular to the directions (theminor axes) [6, 8].IP Major axis/Minor axisThe irregularity parameter of a perfect sphereis unity.As can be seen in the Fig.1, the spherical 05020202020555511110.010a1099Percentage (% )Frequency1202550Particle size (nm) in linear scale75100b10Particle size (nm) in logarithmic scale1000.01Fig. 3. Cumulative percentage frequency curves with particle size axes in (a) linear and (b) logarithmic scales. Solid line in(a) and (b) reflects Gaussian and log-normal distributions respectively.51
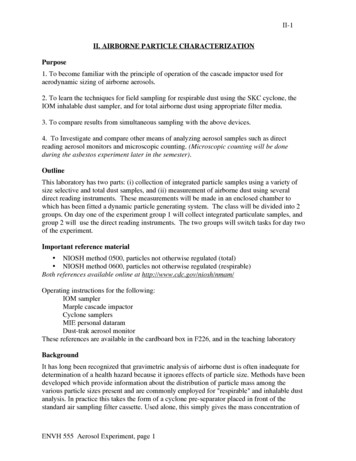
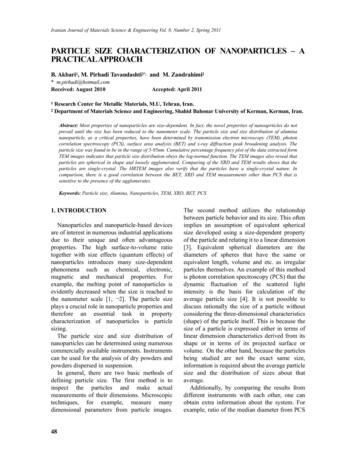
Iranian Journal of Materials Science & Engineering Vol. 8, Number 2, Spring 2011of the particles can appreciated from the IP equalsto 1 and also the circular shape of the particleprojection. Thermal plasma process has beenfound to produce the spherical nanoparticles asdiscussed in the literature [15, 16].Warren and Averbach and Scherrer can be used tocalculate crystallite size, and strain. The simplestand most widely used method for estimating theaverage crystallite size is from the full width athalf maximum (FWHM) of a diffraction peakusing the Scherrer equation as follow:3. 2. X-ray Diffraction Peak Broadening AnalysisAs a primary characterization tool forobtaining critical features such as crystalstructure, crystallite size, and strain, x-raydiffraction patterns have been widely used innanoparticle research. The randomly orientedcrystals in nanocrystalline materials causebroadening of diffraction peaks. This has beenattributed to the absence of total constructive anddestructive interferences of x-rays in a finitesized lattice. Moreover, inhomogeneous latticestrain and structural faults lead to broadening ofpeaks in the diffraction patterns [1]. The sizecalculated from x-ray diffraction peakbroadening is a measure of the smallest unfaultedregions or coherently scattering domains of thematerial. In fact, this is the size of regionsbounded by defects and grain boundaries andseparated from surrounding by a smallmisorientation, typically one or two degrees [17].Three methods of Williamson and Hall,d X RDKOBCos TWhere d is the crystallite size, ʄ thediffraction wavelength, B is the correctedFWHM, ɽ is the diffraction angle and K is aconstant is close to unity. The major assumptionis that the sample is free of the strain [1].B can be obtained from observed FWHM byconvoluting Gaussian profile which models thespecimen broadening Br , as follows:B 2rB 20 B i 2Where B0 is observed broadening and Bi isinstrumental broadening.Williamson and Hall is a simplified integralbreadth method for deconvoluting size and straincontributions to line broadening as a function of2 ɽ . They lead to a Williamson-Hall in which they-intercept can be used to calculate crystallitesize, while strain can be calculated from theFig. 4. The XRD pattern of alumina nanopaticles.52
B. Akbari, M. Pirhadi Tavandashti and M. ZandrahimiParticle Size dTEMCrystallite Size dXRDFig. 5. Schematic showing the size that is obtained byTEM and x-ray diffraction peak broadening analysis. Inthe case of single-crystal nanoparticle, crystallite size andparticle size are the same.slope. Warren and Averbach’s method takes notonly the peak width into account but also theshape of the peak. This method is based on aFourier deconvolution of the measured peaks andthe instrument broadening to obtain the truediffraction profile. This method is capable ofyielding both the crystallite size distribution andlattice microstrain [17, 18].Fig.4 illustrates the XRD pattern of thealumina nanoparticles. Instrumental peak widthwas obtained with a standard silicon powderwhich has no size, defect and strain broadening.Using the Scherrer method and assuming theGaussian profile for peaks model, the averagecrystallite sizes are obtained 15nm and 21.18nmfor the peaks of 2 ɽ 36.40 and 2 ɽ 46.40respectively.As can be understood, these values are veryclose to the TEM value. The correlation betweensize obtained by XRD and TEM is that the XRDsize is usually equals or smaller than thatobtained by TEM [17]. When the particles aredelineated by well-defined boundary or loosenanoparticles of ceramic materials as observed inFig.1, XRD and TEM values are in goodagreement. However, in bulk ormation, the XRD result is usually smallerthan TEM size. On the other hand, innanocrystalline materials, the term grain is usedinterchangeably with crystallite to refer to thesmallest single-phase and crystallized regionsseparated by grain boundaries. Each crystallite isitself a "single crystal" as such; it can contain anyor all of the zero-, one-, or two-dimensionaldefects except for grain boundaries, interphaseboundaries and surfaces. Usually, we will notconsider the case of a single crystallite containinga three-dimensional defect like a pore or secondphase precipitate. Except for a single-crystalnanoaprticle, in which crystallite size and particlesize are identical, the nanoparticles depending onthepreparationconditionsmayhavepolycrystalline or single crystalline structure[18]. In fact/on the other hand, as the crystallitesize approaches the particle size, we have singlecrystal nanoparticles. The atomic planes within acrystallite can be directly imaged using highresolution transmission electron microscopy(HRTEM).High-resolution TEM images in Fig.2 showthat the lattice planes extend up to the surface ofthe particle. The even diffraction contrast acrossthe particles and lack of grain boundaries suggestvirtually all particles are single crystal. This isFig. 6. High-resolution TEM (HTREM) images of the nanoparticles show the lattice planes extend up to the surface and nograin boundaries that indicate particles are single-crystal.53
Iranian Journal of Materials Science & Engineering Vol. 8, Number 2, Spring 2011Size Distribution by ber (%)25010000Size (d.nm)Record 276: aluminaFig. 7. Particle size distribution of the nanoparticles obtained by photon correlation spectroscopy (PCS).confirmed by the lattice fringes at highmagnification that are equal the lattice planes.The fact that they run uninterrupted across theparticles again indicates particles are singlecrystal. The synthesis of single-crystalnanoparticles in a thermal plasma reactor has alsobeen reported [15].3.65g/cm3, a mean particle size of 27 nm wascalculated which agrees well with the TEMvalue. This indicates that the powder consists ofsolid spheres and gas adsorption was able toaccess almost the full surface area of the materialthat implies measurable surface was not virtuallylost in interparticle contacts.3. 3. Surface Area Analysis (BET)3. 4. Photon Correlation Spectroscopy (PCS)The specific surface area of the particles is thesummation of the areas of the exposed surfaces ofthe particles per unit mass. There is an inverserelationship between particle size and surfacearea. Nitrogen adsorption can be used to measurethe specific surface area of a powder. The methodof Brunauer, Emmett, and Teller (BET) iscommonly used to determine the total surfacearea.If the particles are assumed to be as sphericaland in a narrow size distribution, the specificsurface area provides an average particlediameter in nanometer as formula below:dBET 6000/ñsin which S is specific surface area in m2/g andñ is the theoretical density in g/cm3[6].If particles do not bond too tightly, then the gasaccesses most of the surface area of the powderand provides a good measure of the actualparticle size independent of agglomeration. Thisthe size of the primary particles of which theagglomerate is made up. Thus, Surface areameasurement gives a value close to that obtainedby electron microscopy [4, 7].The specific surface area of the particles wasobtained 60.9 m2/g. Assuming a density ofThe most common technology of the particlesize distribution of nano- and submicron liquiddispersions typically is photon correlationspectroscopy (PCS) or Dynamic light scattering(DLS). PCS is a method depends on theinteraction of light with particles. The lightscattered by nanoparticles in suspension willfluctuate with time and can be related to theparticle diameter [6, 19].Figure 3 shows particle size distribution wasobtained by PCS. Mean and median sizesobtained with PCS are 96 and 85nm respectively.These values are larger than those measured byother methods. This can be explained throughdispersion of alumina powder in water andsubsequent sonication. In fact, the dispersion ofthe alumina powder to its primary particle sizedoes not happen completely because theattractive forces between dry particles are sogreat.This is because of Brownian motion at roomtemperature that cause solid bridging betweenadjoining particles in close contact due to van derWaals attraction [7]. This is attributed to the highpower (d6) dependence of the light scattering onthe particle size less than 100nm according to the54
B. Akbari, M. Pirhadi Tavandashti and M. ZandrahimiTable 2. The particle size of alumina nanoparticlesobtained with TEM, XRD, PCS and BET methods.Methodcharacterization of nanoparticles. A definition ofparticle size is simple for a spherical particle inwhich the size is uniquely defined by itsdiameter. Various methods of particle sizeanalysis are used so-called equivalent sphericaldiameter. Equivalent spherical diameters are thediameter of spheres that have the same orequivalent length, volume and etc. as theirregular particles themselves [3, 8].In case of this study, since the particles werespherical, there was a good agreement in TEM, BETand XRD results as is shown in Table 2. However,the difference between PCS and other results wasdue to the agglomerates as discussed earlier.Moreover, it is important to be aware that eachparticle size characterization technique willmeasure a different property of a particle(volume, surface area, projected area, and etc.)and therefore will give a different value fromanother technique that measures an alternativedimension. This leads to many approaches to dataanalysis which can affect the particle sizeinformation obtained. As a result, each techniqueis not wrong, they all are correct; it is simply thata different property of nanoaprticle is beingmeasured [3,7,10]. Table 3 summarizes thecharacteristics of methods that were employed inthe present study.Mean diameter(nm)dTEM24.1dPCS96.2dBET27dXRD20Rayleigh theory. For example, a 50nm particlewill scatter one million times more light than a 5nm particle. In order to obtain equal intensities ofscattering from two particles with the size of 5and 50nm, the presence of 1 million 5nmparticles for every 50nm particle is required.Conversely, on a number basis technique such asTEM, the vast majority of particles would be5nm. Therefore, in dynamic light scattering, theresults will be sensitive to the presence of largeparticles (agglomerates) as they will dominate thescattering of light which is detected. On the otherhand,agglomeratesactasindividualnonspherical particles in light scattering. ThePCS method is particularly well suited to themeasurement of narrow particle size distributionsin the range 1–500nm, but for systems whereagglomerates may be present, comparison withother methods is recommended [6].The preceding discussion demonstrates that anumber of particles properties such as shape andagglomeration are important in the particle size5. CONCLUSIONDifferent techniques were used for measuringparticle size of alumina nanoparticles. TheTable 3. Particle size analysis methods based on different physical principles [2, 3, 6, 8].MethodPhysical PrincipleTransmission amic LightScattering/Photon CorrelationLight ScatteringMediumNominal SizeRange(nm)DefinitionVacuum1-6000Diameter of a circle havingthe same projected areaLiquid5-5000HydrodynamicDiameterSurface AreaAnalysisGas5-5000Surface-volume DiameterX-ray Diffracting-1-200SpectroscopyGas Adsorption SurfaceArea Analysis(BET)X-ray Peak BroadeningAnalysisCoherently ScatteringDomain/ Crystallite size55
Iranian Journal of Materials Science & Engineering Vol. 8, Number 2, Spring 2011particle size, size distribution and shape weredetermined by transmission electron microscopy(TEM). The particle size was found to be in therange of 5-95nm. Statistical analysis of TEMresult indicates the particle size distributionobeys the log-normal distribution. The TEMimages also reveal that particles are spherical inshape and loosely agglomerated. Comparing theXRD and TEM results shows the particles aresingle-crystal. The HRTEM images also justifythat the particles have a single-crystal nature. Incomparison, there is a good correlation betweenthe BET, XRD and TEM measurements otherthan PCS that is sensitive to the presence of theagglomerates.9.10.11.12.13.ACKNOWLEDGMENTOne of the authors would like to thankProfessor R. M. D. Brydson, The Leeds ElectronMicroscopy and Spectroscopy Centre at LeedsUniversity, UK, for HRTEM characterization andProfessor Wolfgang Parak, München University,Germany for providing the XRD data.14.15.16.REFERENCES1.2.3.4.5.6.7.8.56Nalwa, H.S., “Encyclopedia for Nanoscienceand Nanotechnology”, Vol.1, AmericanScientific Publishers, 2004.Wang, Z. L., “Characterization of NanophaseMaterials”, Wiley-VCH Verlag GmbH, 2000.Engineered Materials Handbook: Ceramics andGlasses: Vol.4, ASM International, 1991.Staiger, M., Bowen, P., Ketterer,J. and BohonekJ., “Particle Size Distribution Measurementmand Assessment of Agglomeration ofCommercial Nanosized Ceramic Particles”, J.Disper. Sci. Tech., 2002, 23, 5, 619.German, R. M., “A measure of the number ofparticles in agglomerates”, Int. J. Powd. Metal.,1996, 32, 4, 365.Bowen, P., “Particle Size DistributionMeasurement from Millimeters to Nanometersand from Rods to Platelets” J. Disper. Sci. Tech,2002, 23, 5, 631.Rawle, A. F., “Micron sized nano-materials,Powder Technology”, 2007, 174, 6.Allen, T., “Particle Size Measurement,17.18.19.Chapman and Hall, 5th Edition”, Vol.1&2,1997.Jillavenkatesa, A., Dapkunas, S. J. and Lum,Lin-Sien H., “Particle Size Characterization,NIST Recommended Practical Guide”, 2001.Rawle, A., “The importance of particle sizing tothe coatings industry Part 1: Particle sizemeasurement”, Advances in color science andtechnology, 2002, 5, 1, 1.ASM Handbook, Powder metal technology andapplication, ASM International, Vol.7, 1998.Park, D., and Sinclair, R., “Grain size analysisof longitudinal thin film media”, J.Appl.Phys.2000, 87, 5687.Carpenter, D. T., Rickman, J.M., and Barmak,K., “A methodology for automated quantitativemicrostructral analysis of transmission electronmicrographs”, J.Appl.Phys. 1998, 84, 5843.Brittain, Harry G., “Particle Size Distribution,Part É – Representations of Particle, Shape,Size, and Distribution”, Pharm.Tech. 2001, 38.Carter, B., Perrey, C. R., “Insights intonanoparticle formation mechanisms”, J MaterSci, 2006, 41, 9, 2711.Agarwal, Balani, K., Laha, T., Patil, S., Seal, S.,“Synthesis of Nanostructured SphericalAluminum Oxide Powders by PlasmaEngineering, Metallurgical and MaterialsTransactions” A, 2005, 36A, 301.Gubicza, J., Tichy, G., Ungára, T., “Correlationbetween subgrains and coherently scatteringdomains, Powder Diffraction”, 2005, 20 (4),366.Nalwa H. S. , Handbook of nanostructruredMaterials and Nanotechnology ,Vol 2:Spectroscopy and Theory", Academic Press,2000, pp. 155-167.Tinke, A. P., Govoreanu R. and Vanhoutte K.,“Particle Size and Shape Characterization ofNano- and Submicron Liquid Dispersions,American Pharmaceutical Review”, 2006.
49 and the d BET can be defined as the agglomeration factor F AG indicative of the state of agglomeration of the nanoaprticles [4, 5]. Some studies were concerned with the particle sizing of nanoparticles. In a study by Staiger et