Transcription
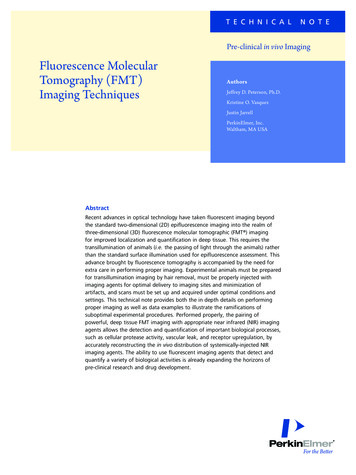
T e c h n i c a lN o t ePre-clinical in vivo ImagingFluorescence MolecularTomography (FMT)Imaging TechniquesAuthorsJeffrey D. Peterson, Ph.D.Kristine O. VasquezJustin JarrellPerkinElmer, Inc.Waltham, MA USAAbstractRecent advances in optical technology have taken fluorescent imaging beyondthe standard two-dimensional (2D) epifluorescence imaging into the realm ofthree-dimensional (3D) fluorescence molecular tomographic (FMT ) imagingfor improved localization and quantification in deep tissue. This requires thetransillumination of animals (i.e. the passing of light through the animals) ratherthan the standard surface illumination used for epifluorescence assessment. Thisadvance brought by fluorescence tomography is accompanied by the need forextra care in performing proper imaging. Experimental animals must be preparedfor transillumination imaging by hair removal, must be properly injected withimaging agents for optimal delivery to imaging sites and minimization ofartifacts, and scans must be set up and acquired under optimal conditions andsettings. This technical note provides both the in depth details on performingproper imaging as well as data examples to illustrate the ramifications ofsuboptimal experimental procedures. Performed properly, the pairing ofpowerful, deep tissue FMT imaging with appropriate near infrared (NIR) imagingagents allows the detection and quantification of important biological processes,such as cellular protease activity, vascular leak, and receptor upregulation, byaccurately reconstructing the in vivo distribution of systemically-injected NIRimaging agents. The ability to use fluorescent imaging agents that detect andquantify a variety of biological activities is already expanding the horizons ofpre-clinical research and drug development.
Materials and MethodsFluorescent AgentsThree different fluorescent agents (AngioSense 680 EX,AngioSense 750 EX, and ProSense 750 FAST) were used toimage tumors under different experimental conditions. Theimaging dose for these agents was as recommended in theproduct insert (2 nmol/25 g mouse).Table 1. Basic properties of two different PerkinElmerfluorescent tumor imaging agents.AngioSense680/750 EXProSense 750FASTAgent TypeUntargetedvascular agentPan-cathepsinactivatable agentMolecular Weight or Size 70,000 g/mol 22,500 g/mol670/690 nm750/770 nm750/770 nmBlood Half-life5h5hTissue Half-life96 h96 hEx/EmAgent Summary. Characteristics of the agents (MW/size,excitation/emission [Ex/Em], and blood/tissue pharmacokinetics)were determined in multiple independent studies. Blood halflives were measured by blood collection from mice at differenttimes post-intravenous injection. Blood samples were measuredfor fluorescence levels in a fluorescence microplate reader.Tissue half-lives were determined by time course FMT 4000imaging of tumors.4T1 Tumor ModelSix to eight week-old female nu/nu and BALB/c mice werepurchased from Charles River Laboratories (Wilmington,MA) and maintained in a pathogen-free animal facilitywith water and low-fluorescence mouse chow (HarlanTekland, Madison, WI). Handling of mice and experimentalprocedures were in accordance with PerkinElmer IACUCguidelines and approved veterinarian requirements foranimal care and use. To induce tumor growth, micewere injected in either the upper mammary fat pads, ordifferent subcutaneous sites, with 5x10⁵ 4T1 mouse breastadenocarcinoma cells/site (ATCC, Manassas, VA), yieldingtumor masses within 5-7 days (see Figure 1).This model, with positioning of tumors either on uppermammary fat pads, central torso, or on the flank, provideda tool to assess the effects of depilation (BALB/c), scanfield size, proper intravenous injections, and tumor/animalpositioning on qualitative and quantitative aspects oftomographic fluorescence imaging.2Figure 1. 4T1 Orthotopic breast cancer model.Figure 2. Carrageenan paw edema.Carrageenan Paw Edema ModelTo induce paw inflammation, BALB/c mice were injected inthe right hind footpad with 30 µL of a 1% carrageenan (CG)solution prepared in PBS. The left hind footpad was injectedwith 30 µL PBS and served as an negative internal control.Intravenous injection of 2 nmoles/mouse of a NIR vascularimaging agent (AngioSense 750 EX) provided a quantitativebiological imaging readout of vascular leak into the affectedpaw at 3h.Brain Fluorescence ModelNu/nu mice were anesthetized using inhaled isoflurane andinjected intravenously with AngioSense 750 EX to providecirculating background fluorescence. At 24h after injection,mice were sacrificed by CO2 inhalation and 40 pmol ofAngioSense 750 EX was injected intracerebrally into theright hemisphere of the brain to provide a discrete, smallregion of brain fluorescence.
In Vivo FMT 4000 tomographic imaging and analysisProper DepilationFor studies examining the effect of hair on tumorimaging, tumor-bearing mice were anesthetized usingan intraperitoneal injection of ketamine (100 mg/kg) andxylazine (20 mg/kg) and depilated prior to imaging. Nairlotion (Church & Dwight Co., Inc., Princeton, NJ) wasapplied thickly on skin over the upper torso (front, back,and sides) of each mouse, rinsed off with warm water, andre-applied until all fur had been removed. Mice were thenimaged using the FMT 4000 fluorescence tomography invivo imaging system (PerkinElmer, Waltham, MA), whichcollected both 2D surface fluorescence reflectance images(FRI) as well as 3D fluorescence molecular tomographic(FMT) imaging datasets. Nu/nu and SKH-1E mice required nodepilation.Animal hair is highly effective at blocking, absorbing, andscattering light during optical imaging. Even light within theNIR spectrum, which typically shows minimal scattering andabsorbance in tissue, is significantly absorbed and scatteredby hair. This is of particular concern for fluorescencemolecular tomography, which utilizes a transilluminatinglight source that passes through both sides of the animal(i.e. two regions of hair-covered skin). Nude mice, orimmunocompetent hairless SKH1-E mice, do not requiredepilation, however conventional strains of haired mice, likeBALB/c or C57BL/6, require depilation (Figure 3).ABFMT Reconstruction and AnalysisThe collected fluorescence data was reconstructed byFMT 4000 system software (TrueQuant v3.0, PerkinElmer,Waltham, MA) for the quantification of three-dimensionalfluorescence signal within the tumors and lungs. Threedimensional regions of interest (ROI) were drawn encompassingthe relevant biology.Introduction and ResultsOptimal FMT imaging of living animals requires special carein preparing animals and in performing the experimentalprocedures. This is especially important because errors inexperimental design, such as hair removal, agent injection,and size and position of tomographic scan fields, can havetremendous impact on the quality and quantification offluorescence signal. In some instances, neglecting some ofthese important considerations can mean the differencebetween successful, interpretable imaging and false negativeresults. To best illustrate the issues that most affect theaccuracy of near infrared (NIR) tomographic imaging, aseries of studies and illustrations were designed to addresscommon mistakes in depilation, considerations in animal/imaging site positioning, the range of effective scan fieldsizes, the impact of suboptimal injections, and specificapproaches for paw and brain imaging.An orthotopic 4T1 breast tumor xenograft model (in nu/nuor BALB/c mice) was imaged using either vascular agents orcathepsin-activatable agents to assess both image qualityand tumor fluorescence quantification (in pmol) undervarious imaging conditions. Brain imaging was addressed ina direct brain injection study to provide a single discrete siteof fluorescence of known concentration, and paw imagingwas explored using a well characterized paw inflammationmodel, carrageenan paw edema.Figure 3. A) Depilation not required: nu/nu mice; SKH1-E (immunocompetent hairless); B) Depilation required: normal, haired mouse strains (BALB/c,C57BL/6 etc.)To explore the impact of depilation on in vivo imaging,BALB/c mice bearing established orthotopic, syngeneic 4T1breast cancer tumors were injected IV with AngioSense 680EX and imaged without depilation, with partial depilation(only ventral), and with full depilation (ventral and dorsal).Both 2D (epifluorescence) and 3D (tomographic) imageswere acquired using the FMT 4000 as described in theMethods section. The biggest impact seen in imaging nondepilated mice is the incorrect localization of fluorescence,both in 2D and 3D. Regions in which hair is thinning orparted allow a disproportional amount of the fluorescenceto show, thus affecting both epifluorescence andtomography results (Figure 4A). This leads to significantvariability in imaging and at times prevents low levelsignals from being seen at all. Either partial depilation (i.e.ventral depilation only) or complete depilation generatedcomparable results, however qualitative differences wereseen with regard to tomographic imaging, favoring completedepilation. Dorsal only depilation (not shown) gives the sameresults as non-depilation, supporting the absolute needfor depilation on the side of the animal facing the camera.3
ABFigure 4. Effect of depilation on fluorescence imaging. A representative mouse bearing two established 4T1 tumors implanted superficially in the mammaryfat pad was imaged at different states of depilation by both 2D and 3D imaging (A) to show depilation effects on fluorescence localization. Quantitative results(B) show modest differences with depilation.This suggests that the effect of light scattering at the pointof light entry is somewhat less than the effect of lightscattering on the side toward the camera. Minimal effectswere seen on signal quantification in this particular datasetby either 2D or 3D imaging (Figure 4B); although there wasa trend for non-depilated animals to show both improper 3Dlocalization and higher quantification.Although the differences are not dramatic, partial depilationgenerates abnormal 3D reconstructions and variabilityin results that is best avoided, so full depilation is therecommendation. Naturally, the impact of not removing thefur prior to imaging is much greater when imaging darkhaired mice (not shown).To explore the impact of route of injection and quality ofinjection on imaging quality and quantification, nu/nu micebearing established orthotopic 4T1 breast cancer tumorswere co-injected with the vascular agents AngioSense 680EX and AngioSense 750 EX. AngioSense 680 EX served asthe optimal control via IV injection, and AngioSense 750 EXwas either co-injected under optimal conditions, given as a“bad IV” (i.e. partial IV/partial SC injection), or administeredIP. All 750 nm results were normalized to 680 nm (properinjection control) results for optimal comparison. FMTquantification of tumor, abdominal, and tail fluorescenceProper Injection and Injection RouteThe imaging agent route of injection is an extremelyimportant consideration when imaging fluorescence. Ingeneral, NIR imaging agents are designed for intravenousinjection and are not optimized for injections by any otherroutes (e.g. intraperitoneal, intramuscular, subcutaneous).In particular, large molecular weight imaging agents do notdistribute out of the peritoneal space effectively followinginjection and generally require direct delivery to thevasculature.4Figure 5. Quantitation of NIR agent with variation of injections. The micefrom Figure 4 were quantitatively assessed by TrueQuant software for theamount of epifluorescence in tumors, the abdomen, and the tail. Data isrepresented as % of the “good IV” control.
A. 2D imagingB. 3D tomographic imagingC. IV tail signal retentionD. IP abdominal signal retentionFigure 6. Effect of proper NIR agent injection on tumor imaging. Three representative nu/nu mice bearing two established 4T1 tumors implantedsuperficially in the upper mammary fat pads were injected with AngioSense 680 EX & AngioSense 750 EX under different injection conditions. Mice were byboth 2D (A) and 3D (B) imaging to show injection effects on fluorescence localization to tumors. (C) Proper intravenous injection shows little retention ofsignal in the site of tail vein injection, whereas poorly performed IV injection (i.e. mostly subcutaneous delivery) shows high fluorescence retention in the tail.(D) IP injection leads to signal retention within the abdominal region.(Figure 5) shows 25-50% signal decrease in tumors uponIP or bad IV injection, respectively. If IV injection qualityis a significant experimental variable, then the accuracyof measurements could vary considerably from mouse tomouse, perhaps limiting the ability to generate statisticallymeaningful results. IP injection, although it worked reasonablywell for AngioSense 750 EX, is not recommended andshows lower, more variable signal than a properly performedIV injection.injection yielded somewhat lower delivery of AngioSense750 EX to the tumor sites as compared to proper IVinjection (lower row). Figures 6C and 6D further indicatethe impact of injection site signal on imaging with bad IVinjections showing subcutaneous accumulation in the tailand IP injections to abdominal signal retention (quantifiedin Figure 5). The IP approach also precludes imaging inthe lower torso of the mouse due to excessive residualabdominal signal.Figure 6 (upper row) shows that both vascular agentsprovide comparable IV intratumoral distribution and tumordefinition, both by 2D and 3D imaging. When AngioSense750 EX was administered in a manner to mimic a “bad IV”,the quality of tumor imaging and the absolute intensityof fluorescence was compromised relative to properlyadministered AngioSense 680 EX (middle row). Similarly, IPLower molecular weight imaging agents (i.e. 5000 kDa),and even some larger agents, may be quite effective forimaging via IP injection. However, the researcher shouldexpect that, because of changes in blood pharmacokineticsrelative to IV injection, the optimal timepoints for imagingmay change relative to IV administration. IP injection mayyield lower peak circulation levels, yet more prolonged netexposure.5
Proper FMT Scan SizeAppropriate placement and sizing of tomographic scanfields (see Figure 7) are important components to successfultomographic imaging and quantification. Proper depthlocalization requires that some of the laser source points bepositioned distal to the biological site being imaged. Nearbylaser positions will less efficiently excite fluorophores atthe biological site due to the increased distance, whereasproximal laser positions will excite fluorophores maximally.Imaging across the entire scan field, an array of multipleproximal and nearby laser positions, provides sufficientdiversity of fluorescent patterns such that accurate sizeand position of the imaged biology can be determined andrepresented in 3D.image. All three scan field approaches incorporating nearbypoints, however, yield good quality reconstructions andquantification of tumor fluorescence with only a 10%coefficient of variance in their pmol values. This offersmaximal flexibility for imaging complex, multiple sites offluorescence with minimal impact of site position.Whereas the 2D epifluorescence images of this superficialtumor (acquired by a different imaging process and differentlight source) are very consistent upon repeated imaging(Figure 8C), it is important to note that detection of deeptissue tumors would be more problematic and challengingwith regard to accurate quantification. This is illustrated bythe 2X under-representation of signal within the bladderas measured by epifluorescence as compared to what ismeasured by tomography.Figure 7. Scan field placement and size.The images shown in Figure 8 illustrate the impact ofscan field size and position (Figure 8A) on tumor imagequality (Figure 8B). A scan field that is undersized (i.e. onlyplacing laser source points directly in the tumor region)yields a poorly reconstructed tumor by tomography thatoften does not co-localize well to the obvious position ofthe superficial tumor. It is recommended that scan fieldsbe sized appropriately to allow at least 1-2 rows of lasersource points to surround the biological site, however theFMT reconstruction can work reasonably well even underconditions in which the site of biological signal is near theedge of the scan field (Figure 8B). The medium optimalfield, or larger, provides the ideal conditions for generatingconsistent quantitative data and high quality tomographicimages. The obvious benefit of the larger scan field is theability to detect and quantify other sites of fluorescence, asseen with bladder detection in the “large field” tomographic6Figure 8. Effect of proper scan field size on imaging quality. A representativenu/nu mouse bearing a single established subcutaneous 4T1 tumor implantedover the upper abdominal region was injected IV with ProSense 750 FASTand imaged 24h later. The same mouse was imaged using 4 different scanfields to assess the effects of different scanning approaches on tomographicreconstruction quality. (A) Representation of scan field sizes and laserpositions, with transillumination fluorescence represented from a single laserposition behind the center of the tumor, indicated by the white dot. (B)Tomographic 3D fluorescence datasets with reconstruction field and ROIsplaced for quantification. (C) Reference 2D epifluorescence images collectedin parallel prior to each tomographic image acquisition to confirm consistencyof superficial fluorescence.
Effect of Tumor/Animal PositioningAppropriate positioning of the animal can also affect thequality of both 2D and 3D imaging when the biologicalsite is not centralized on the animal’s body. This is becausethe same tumor, in a different orientation, may oftenpresent both a smaller visible surface area as well as adifferent tissue depth. For 2D imaging, this can have adramatic effect on quantification as this type of imagingis highly dependent on signal depth. However, the qualityof 3D imaging can also be affected by animal positioningwhen the site of biology to be imaged is on the edgeof the animal. In the extreme example of a flank tumorthat protrudes laterally from the animal, there may bean air gap beneath the tumor, precluding optimal lasertransillumination. As long as this is not the case, optimal3D imaging can be achieved if care is taken to properly sizeand position the scan field. The TrueQuant reconstructionalgorithm does not absolutely require multiple laser sourcepoints directly through the biological site. However, it is stillessential to have enough nearby laser source points placedfor optimal image acquisition. The best, and recommended,approach is to reposition the animal to place the biologicalsite more centrally within the imaging field of view or toimplant tumors in a slightly more dorsal position. This allowsoptimal placement of laser source points on all sides of thebiological for the highest quality 3D reconstruction.To illustrate the issues of proper imaging of biologicalsites that are positioned either laterally or centrally onthe mouse’s body, we implanted a single 4T1 tumorsubcutaneously on the flank of a nude mouse. Wepositioned the mouse either prone (tumor protrudinglaterally to the left) or on its side (tumor centralized inthe imaging field of view). Figure 9A illustrates the scanfield sizes and positions examined, and it is clear that, asin Figure 8) a small scan field that does not provide a rowof laser positions surrounding this laterally-placed tumoryields a poor reconstruction and low tumor quantificationin pmol. In contrast, more accurate reconstruction can begenerated when the mouse is repositioned to centralizethe tumor and a fully encompassing scan field is placed(Figure 9B). The lateral positioning can work reasonablywell if the scan field is enlarged to include additional lasersource positions above/right and below/right relative to thetumor mass. This approach achieves an improved 3D tumorreconstruction as well as quantification (Figure 9D) similarto that of the centralized imaging. However, the data willsuffer somewhat with regard to accurate depth localizationwithout appropriate encircling laser positioning as defined inFigures 7 and 8.It is interesting to note the impact of tumor position on 2Depifluorescence imaging (Figure 9C); the laterally placedtumor consistently shows half of the signal evident in thecentralized tumor image. There is no imaging solution thatcan improve 2D epifluorescence quantification in comparingsuch significant changes in position.Figure 9. Effect of tumor/animal positioning on imaging quality. A representative nu/nu mouse bearing a single established subcutaneous 4T1 tumorimplanted on the left flank was injected with ProSense 750 FAST and imaged 24h later. The same mouse was imaged using 2 different animal positions thatplaced the tumor either laterally or centrally within the imaging field of view. (A) Representation of scan field sizes and laser positions, with transilluminationfluorescence represented from a single laser position behind the center of the tumor, indicated by the white dot. (B) Tomographic 3D fluorescence datasetswith reconstruction field and ROIs placed for quantification. (C) Reference 2D epifluorescence images collected in parallel prior to each tomographic imageacquisition to confirm consistency of superficial fluorescence. (D) Quantification of 3D (upper) and 2D (lower) imaging data by TrueQuant software.7
Optimal Paw Imaging TechniqueAs FMT utilizes transillumination of tissue, it is important toposition the laser at each source point with tissue betweenit and the camera. Without the intervening tissue, the laserwould directly project to the camera, providing uselessdata and potential harm to the camera. To avoid this issue,the FMT 4000 identifies the boundaries of the animal andplaces each laser source point a minimum of 3 mm fromthe boundary. This means that the system will generally notplace laser source points in any tissues less than 6 mm inwidth (e.g. in paws or tail).To image biological changes in the paws of mice, it isnecessary to modify the imaging procedure to facilitate thetransillumination of narrow parts of the anatomy by using atissue imaging block (a thick resin material that mimics theNIR scattering and absorbance of normal tissues) beneaththese regions (Figure 10). Without the block, as can be seenin Figure 11A (left panel), even a large scan field drawnaround the lower abdomen and legs is unable to placesource points within the paw regions. An imaging block canbe placed beneath the lower torso and legs/paws of theanimal to allow a full scan field across the legs and paws.A sloped region on one end of the block (placed under theabdomen) minimizes discomfort of the animals, and thepaws are positioned on the flat upper surface. The use ofclear double-sided sticky tape (placed between the paw andthe block) allows the paws to be fully stretched out onto theflat surface and away from the abdomen (right panel). Thisalso facilitates better centralization of the paws as comparedto using the block without tape (middle panel).Figure 10. Paw tomography using imaging block.8Figure 11B (left panel) shows the truncated reconstructionfield generated when the imaging block is not used,capturing only the ankle region of the paws. In contrast,use of the imaging block allows the generation of a largereconstruction field that fully captures both paws (middleand right panels). The taped paws (right panel) show betterpositioning and there is less risk of imaging artifacts becauseof the good contact of the paws to the flat surface of theblock. Nevertheless, the quantification is similar with andwithout tape.For 2D epifluorescence imaging (Figure 11C) there is amodest effect of the imaging block on paw fluorescence,with slightly lower signal seen in the absence of the imagingblock. The overall results are very similar, however, withand without the block, and has been found to be consistentwithin each approach.Figure 11. Imaging paw inflammation. A representative BALB/c mouse wasinjected in the right paw with 1% carrageenan and in the left paw with PBS.Immediately thereafter, the mouse was injected intravenously with AngioSense680 EX to assess the vascular leak at 3h associated with the induced edemaresponse. The same mouse was imaged dorsally using 3 different approaches;(1) imaged without any special consideration for the small anatomy to beexamined, (2) imaged with the paws elevated on an index-matching imagingblock, and (3) imaged with the paws elevated on an index-matching imagingblock and paws taped in place to extend the legs/paws away from the lowertorso. (A) Representation of scan field sizes and laser positions, with transillumination fluorescence represented from a single laser position, indicated by thewhite dot. Red dots indicate source points omitted during the scan because ofexcessive light transmission. (B) Tomographic 3D fluorescence datasets withreconstruction field and ROIs placed for quantification. (C) Reference 2Depifluorescence images collected in parallel prior to each tomographic imageacquisition to confirm the consistency of superficial fluorescence.
Brain ImagingHead/brain imaging by FMT faces no restrictions with regard to theability to effectively transilluminate the skull. Reasonable images canbe acquired under a variety of experimental settings, however scanfield “pitch” (the density of laser source points per scan field) can havesome impact due to the small anatomy being imaged. Scan field shouldbe sized to the skull rather than to the entire head/ears, as the thinear tissue is too thin and will not be image-able by transillumination(Figure 12A). Either the standard scan pitch or fine pitch will both workwell in yielding good 3D images as well as accurate quantification,whereas the coarse scan will underestimate the amount of signal in thebrain (Figure 12B).Because of the small size of the brain region, finescanning is generally recommended in order toprovide more laser sources through the specificsite within the brain tissue. For more diffusebrain signal (as in brain inflammation), thereconstruction will show broad areas of signalthrough the head, generally localized to thebrain. Discrete hot spots of inflammation withinbroad inflammation in the brain may be difficultto discriminate and localize due to the inability toprovide laser positions outside the brain duringimaging, however the quantification of total brainsignal will agree well with ex vivo validation.Figure 12. Imaging Brain Fluorescence. A representative nu/nu mouse with systemic levels of AngioSense 750 EX was killedand injected in the right hemisphere of the brain with 40 pmolof AngioSense 750 EX. The same mouse was imaged dorsallyusing 3 different laser source point densities; (1) course scanfield (5 mm spacing for laser source points), (2) medium scanfield (3 mm spacing for laser source points), and (3) fine scanfield (2 mm spacing for laser source points). (A) Representationof scan field sizes and laser positions, with transilluminationfluorescence represented from a single laser position, indicatedby the white dot. (B) Tomographic 3D fluorescence datasetswith reconstruction field and ROIs placed for quantification.ConclusionsOptimal FMT imaging of living animals generates complex 3D imagesof fluorescence utilizing specific NIR imaging agents designedto detect and quantify in situ biology. The ability to detect andlocalize fluorescence in 3D is an essential component to accuratequantification, providing a distinct advantage to standard 2Depifluorescence imaging (which is dominated by superficial signaland subject to depth-dependent variability). This accurate localizationof fluorescent signal is absolutely dependent on the use of carefulimaging procedures that effectively allow the delivery of light throughtissue in a matrix pattern that captures both proximal and distal siteswith respect to the biological site of interest. Proper hair removal isone of the critical steps for fluorescent tomography in order to providean unobstructed surface for light penetration. Hair must be removedon the front, back, and sides of the appropriate region on the mouseand the approriate site for imaging should be centered in the imagingwindow if possible. Agents must be injected properly (according toinstructions), and the scan field must be appropriately sized aroundthe site of interest to provide sufficient proximal and distal viewsfor determining signal localization and quantification in 3D. Smalleranatomical sites such as paws, which present a challenge for opticaltomography, can be imaged by placing them on an imaging block thatmimics the density of normal tissue. This provides a robust means fortransilluminating the paws and generating quantitative data.9
ReferencesFMT Imaging Technology1. Mohajerani P., Adibi A., Kempner J. and Yared W.Compensation of optical heterogeneity-induced artifactsin fluorescence molecular tomography: theory and in vivovalidation. Journal of Biomedical Optics 14:034021 (2009).2. Weissleder R. A clearer vision for in vivo imaging. NatureBiotechnology 19:316-317 (2001).Tumor Imaging1. Montet X., Figueiredo J.L., Alencar H., Ntziachristos V.,Mahmood U., Weissleder R. Tomographic fluorescenceimaging of tumor vascular volume in mice. Radiology242(3):751-758 (2007).2. Kossodo S., Pickarski M., Lin S.A., Gleason A., Gaspar R.,Buono C., Ho G., Blusztajn A., Cuneo G., Zhang J., Jensen J.,Hargreaves R., Coleman P., Hartman G., Rajopadhye M.,Duong le T., Sur C., Yared W., Peterson J., Bednar B. Dualin vivo quantification of integrin-targeted and proteaseactivated agents in cancer using fluorescence moleculartomography (FMT). Molecular Imaging and Biology12(5):488-99 (2010).Paw Imaging1. Peterson J.D., Labranche T.P., Vasquez K.O., Kossodo S.,Melton M.,
(FMT) imaging datasets. Nu/nu and SKH-1E mice required no depilation. FMT Reconstruction and Analysis The collected fluorescence data was reconstructed by FMT 4000 system software (TrueQuant v3.0, PerkinElmer, Waltham, MA) for the quantification of three-dimensional fluorescence signal within the tumors and lungs. Three-