Transcription
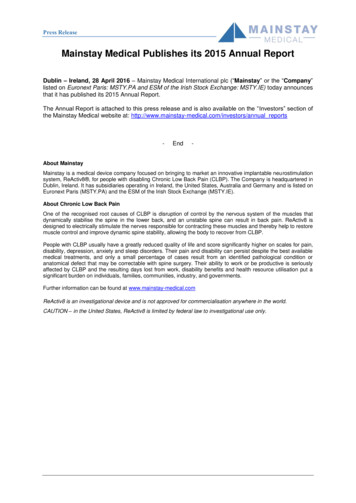
MainStay VP Series Mid Cap Core Portfolio Initial ClassEquity03-31-2017This fact sheet is provided because the Investment Division is available within a variable universal life policy issued by New York Life Insurance and Annuity Corporation. Variable Universal Life (VUL)is a type of permanent insurance which provides a death benefit in exchange for flexible premiums. The policy's cash value, including any assets allocated to the Investment Divisions, is subject tomarket risks and fluctuates in value. VUL policies are subject to insurance related fees and charges such as mortality and expense risk charges, cost of insurance, administrative fees, and underlyingfund expenses. This material is authorized for distribution to the general public only if preceded or accompanied by an effective policy prospectus and fund prospectus. Policyowners should considerthe investment objectives, risks, charges, and expenses of the policy and the Investment Divisions carefully before investing. The prospectus for the policy and the underlying fund prospectus containthis and other information. Please read the prospectuses carefully before investing. To obtain a copy of the prospectuses, please contact your Registered Representative or call (888) 695-4748.Investment InformationInvestment StrategyMorningstar Equity Style Box as of 01-31-17% Mkt Cap.Value Blend hmark Description: Russell Mid Cap TR USDThe index measures the performance of the mid-cap segmentof the US equity universe. It is a subset of Russell 1000 indexand includes approximately 800 of the smallest securitiesbased on a combination of their market cap and current indexmembership. The index represents approximately 31% of thetotal market capitalization of the Russell 1000 companies.Category Description: Mid-Cap BlendThe typical mid-cap blend portfolio invests in U.S. stocks ofvarious sizes and styles, giving it a middle-of-the-road profile.Most shy away from high-priced growth stocks but aren't soprice-conscious that they land in value territory. The U.S. midcap range for market capitalization typically falls between 1billion and 8 billion and represents 20% of the totalcapitalization of the U.S. equity market. The blend style isassigned to portfolios where neither growth nor valuecharacteristics predominate.Low - Moderate - High - Highest0.12.SmallGiantRisk LevelLarge MidThe investment seeks long-term growth of capital.The fund normally invests at least 80% of its assets (netassets plus any borrowings for investment purposes) incompanies with market capitalizations at the time ofinvestment that are similar to the market capitalizations ofcompanies in the Russell Midcap Index, and invests primarilyin common stocks of U.S. companies.Morningstar Style Box The Risk Levels are based on an analysis of the 10-Year AverageStandard Deviation (10-Year ASD) of the Morningstar Inc.investment company categories in which the InvestmentDivision resides. The Risk Levels are defined by Morningstar Inc.benchmarks which are assigned grades of Low, Moderate, Highand Highest based on their 10-Year ASDs as of December 31,2016. The Risk Levels are analyzed and updated at least on anannual basis. Morningstar Inc. is a widely recognizedindependent research firm which ranks mutual funds and otherinvestment companies by overall performance, investmentobjective and assets.Principal RisksInvestments in common stocks and other equity securities are particularly subject to the risk of changing economic, stock market,industry and company conditions and the risks inherent in the portfolio managers' ability to anticipate such changes that can adverselyaffect the value of the Portfolio's holdings. Stocks of mid-cap companies may be subject to greater price volatility, significantly lowertrading volumes, cyclical, static or moderate growth prospects and greater spreads between their bid and ask prices than stocksof larger companies. Growth stocks may be more volatile than other stocks because they are generally more sensitive to investorperceptions and market moves. During periods of growth stock underperformance, the Portfolio’s performance may suffer. Valuestocks may never reach what the Subadvisor believes is their full value or they may go down in value.Fees and ExpensesMorningstar Proprietary StatisticsFees and Expenses as of 06-30-16Management FeeProspectus Net Expense Ratio0.85%0.87%Fund FactsInception DatePrimary BenchmarkPortfolio Manager(s)Firm NameAdvisorSubadvisorTotal Number of HoldingsAvg Market Cap ( M)Annual Turnover Ratio %Total Net Assets ( mil)07-02-01Russell Mid Cap TR USDMigene Kim. Since 12-07.Andrew Ver Planck. Since 02-13.Mona Patni. Since 05-14.New York Life InvestmentManagement LLCNew York Life InvestmentManagement LLCCornerstone Capital ManagementHoldings Llc3529,047164929.77 2017 Morningstar, Inc., Morningstar Investment Profiles 312-696-6000. All rights reserved. The information contained herein: (1) is proprietary to Morningstar and/orits content providers; (2) may not be copied or distributed and (3) is not warranted to be accurate, complete or timely. Neither Morningstar nor its content providers areresponsible for any damages or losses arising from any use of information. Past performance is no guarantee of future performance. Visit our investment website atwww.morningstar.com.3 Year5 Year10 YearOverallMorningstar Rating Out of # ofInvestmentsQQQQQQQQQQQQQQQ377340219.NoteAn investment's overall Morningstar Rating, based on its riskadjusted return, is a weighted average of its applicable 3-, 5-,and 10-year Ratings.ß Page 1 of 5
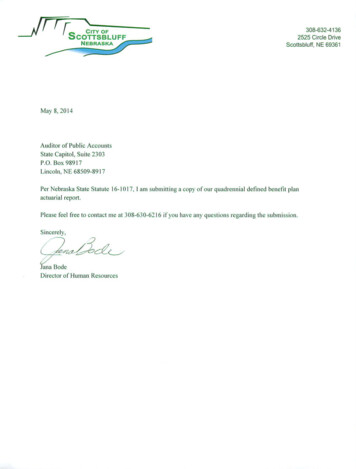
MainStay VP Series Mid Cap Core Portfolio Initial ClassEquity03-31-2017Portfolio AnalysisRisk Evaluation3-Yr Risk Measures as of 03-31-17Standard DeviationSharpe RatioInformation RatioR-SquaredTracking ErrorExcess ReturnBetaAlphaNumber of Positive MonthsPositive Month Average %Number of Negative MonthsNegative Month Average %5-Yr Risk Measures as of 03-31-17Standard DeviationSharpe RatioInformation RatioR-SquaredTracking ErrorExcess ReturnBetaAlphaNumber of Positive MonthsPositive Month Average %Number of Negative MonthsNegative Month Average %10-Yr Risk Measures as of 03-31-17Standard DeviationSharpe RatioInformation RatioR-SquaredTracking ErrorExcess ReturnBetaAlphaNumber of Positive MonthsPositive Month Average %Number of Negative MonthsNegative Month Average %Port AvgRel BmarkRel 061.000.96Port AvgRel BmarkRel 111.000.98Port AvgRel BmarkRel 030.981.03Composition as of 01-31-17% AssetsU.S. StocksNon-U.S. StocksBondsCashOtherCountry Exposure as of 01-31-17%United StatesUnited .120.580.300.000.00.IrelandMorningstar Sectors as of 01-31-17% FundS&P 500 %h 6.052.35j 0.3619.8015.9726.805.814.855.319.3914.223.19.Basic MaterialsConsumer CyclicalFinancial ServicesReal Estate.Communication ServicesEnergyIndustrialsTechnologyk Defensive.s Consumer Defensived Healthcaref Utilities0.00Top 10 Holdings as of 01-31-17SectorSPDR S&P MidCap 400 ETFMicron Technology IncSunTrust Banks IncEdison InternationalLam Research CorpTechFin 90.860.85Omnicom Group IncMarathon Petroleum CorpDr Pepper Snapple Group IncLincoln National CorpTyson Foods Inc Class ACnsr CycEnergyCnsr DefFin SvcsCnsr Def8.538.408.137.968.030.840.830.810.790.79Mkt Value % Assets.The Equity Sector Allocations and Top 10 Holdings percentages are based on the total portfolioas of the quarter-end, are shown for informational purposes only, and should not be considereda recommendation to purchase or sell any security.Historical Asset Allocation100%75502520122013201420152016Most Recent Allocation as of 01-31-17Stock100.0%Bonds0.0% 2017 Morningstar, Inc., Morningstar Investment Profiles 312-696-6000. All rights reserved. The information contained herein: (1) is proprietary to Morningstar and/orits content providers; (2) may not be copied or distributed and (3) is not warranted to be accurate, complete or timely. Neither Morningstar nor its content providers areresponsible for any damages or losses arising from any use of information. Past performance is no guarantee of future performance. Visit our investment website atwww.morningstar.com.Cashß0.0% Other0.0%Page 2 of 5
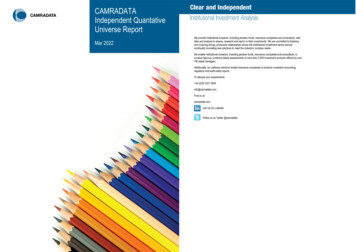
MainStay VP Series Mid Cap Core Portfolio Initial ClassEquity03-31-201720Performance Disclosure: The performance data quotedrepresents past performance and does not guaranteefuture results. The investment return and principal valueof an investment will fluctuate; thus an investor'sshares, when redeemed, may be worth or more less thantheir original cost. See Disclosure page for moreinformation.151050-5-10-15Correlation MatrixTime Period 03-31-12 to 03-31-171. MainStay VP Series Mid CapCore Portfolio Initial Class2. Russell Mid Cap TR USD3. Mid-Cap BlendYTD11.00230.980.981.000.991.001 Year3 Year5 Year10 YearSince Inception60PortfolioBmarkAverage annual, if greaterthan 1 year4.8214.267.4913.867.388.97Investment Return %5.1517.038.4813.097.949.12Benchmark Return %.Morningstar Rating QQQ QQQQQQQQ.377340219# of Funds in CategoryDrawdownTime Period 03-31-12 to 03-31-17Total Return %as of 03-31-17Investment ReturnBenchmarkYTDCat AvgYTDYTDYTDYTD 4530YTDMax Drawdown-14.30-12.77-14.10Max Drawdown # Periods8.008.008.00Max Drawdown Peak Date 06-01-15 06-01-15 06-01-15Max Drawdown Valley Date 01-31-16 01-31-16 01-31-1615Calendar Year Return %as of 12-31-16Investment ReturnBenchmark0-15-30-45The performance data contained within this document reflectsinvestment management fees and direct operating expensesof the Investment Division. It does not reflect mortality andexpense risk charges, cost of insurance charges, monthlycontract charges, sales expense charges, or state and federalpremium tax charges. If these charges were reflected, thereturns would be significantly lower. We recommend obtaininga personalized illustration which takes into account the amountof insurance purchased, complete fees and charges under thepolicy, gender, age and underwriting classification of theinsured. The performance data shown represents pastperformance and is no guarantee of future results. Theinvestment returns and the Cash Value of the policy willfluctuate so that the Cash Value of the policy, if surrendered,may be more or less than the value of the premiums paid.Performance reflects the percentage change in net asset valuefor the period shown with capital gains and dividendsreinvested. Visit www.NewYorkLife.com to obtainperformance data current to the most recent month-end. Dueto market volatility, current performance may be better orworse than the figures shown. The returns should beconsidered in light of the investment objectives and policies,characteristics and quality of the Portfolio in which theInvestment Division invests and the market conditions duringthe given time period, and should not be considered as arepresentation of what may be achieved in the future. The CashValue of the policy will depend on a number of factors, includingthe allocations among Investment Divisions and the differentinvestment rates of return for the Investment Division. Theresults for the periods from the Portfolio's inception date untilthe policy's introduction of December 2001 for CEVUL andNovember 2009 for CEAVUL are hypothetical only in the sensethat they will predate the availability of a .76Growth of 100 as of 03-31-17250201514.3813.22Investment : 2142016-3.68-2.4411.1713.80Investment Return %Benchmark Return %Benchmark: n Distribution as of 03-31-17820102011201220132014MainStay VP Series Mid Cap Core Portfolio Initial Class2015201603 - 17Russell Mid Cap TR USD6420-10-8-6-4-202468101214Quarterly Returns as of 03-31-171st Qtr2nd Qtr3rd Qtr4th 2 2017 Morningstar, Inc., Morningstar Investment Profiles 312-696-6000. All rights reserved. The information contained herein: (1) is proprietary to Morningstar and/orits content providers; (2) may not be copied or distributed and (3) is not warranted to be accurate, complete or timely. Neither Morningstar nor its content providers areresponsible for any damages or losses arising from any use of information. Past performance is no guarantee of future performance. Visit our investment website atwww.morningstar.com.ß Page 3 of 5
MainStay VP Series Mid Cap Core Portfolio Initial ClassDefinitionsAverage Market Cap ( M): Morningstar defines the overall"size" of a stock fund's portfolio as the geometric mean of themarket capitalization for all of the stocks it owns. It's calculatedby multiplying the stock’s portfolio weight by the natural log ofthe market cap. The results for each stock are summed anddivided by sum of the portfolio weights, and then theexponential of the resulting number is taken.Alpha: Alpha measures a fund’s performance after adjustingfor the fund’s systematic risk as measured by the fund’s betawith respect to its benchmark index. An investor could haveformed a passive portfolio with the same beta as that of thefund by investing in the index and either borrowing or lendingat the risk-free rate of return. Alpha is the difference betweenthe average excess return on the fund and the average excessreturn on the levered or de-levered index portfolio. For example,if the fund had an average excess return of 6% per year and itsbeta with respect to the S&P 500 was 0.8 over a period whenthe S&P 500’s average excess return was 7%, its alpha wouldbe 6%-0.8*7% 0.4%. There are limitations to alpha’s ability toaccurately depict a fund’s added or subtracted value. In somecases, a negative alpha can result from the expenses that arepresent in the fund’s figures but are not present in the figuresof the comparison index. The usefulness of alpha is completelydependent on the accuracy of beta. If the investor accepts betaas a conclusive definition of risk, a positive alpha would be aconclusive indicator of good fund performance.Beta: Beta is a measure of a fund’s sensitivity to movementsin its benchmark index. By construction, the beta of the indexis 1.00. A fund with a 1.10 beta has tended to have an excessreturn that is 10% higher than that of the index in up marketsand 10% lower in down markets, holding all other factors remainconstant. A beta of 0.85 would indicate that the fund hasperformed 15% worse than the index in up markets and 15%better in down markets. A low beta does not imply that the fundhas a low level of volatility, though; rather, a low beta meansonly that the fund’s index-related risk is low. A specialty fundthat invests primarily in gold, for example, will usually have alow beta (and a low R-squared), as its performance is tied moreclosely to the price of gold and gold-mining stocks than to theoverall stock market. Thus, although the specialty fund mightfluctuate wildly because of rapid changes in gold prices, its betawill be low.Correlation: This indicates the strength and direction of a linearrelationship between two random variables. The value willrange between -1 and 1. A value of 1 indicates a perfect positivedependency and -1 indicates a perfect negative dependencybetween the 2 investments. A correlation value of 0 indicatesthat no relationship between the 2 investments exist, and aresaid to be independent of each other. The correlation betweentwo investments can be determined based on the returns ofthe investments or the excess returns of the investments overa risk-free rate.Information Ratio: Information ratio is a risk-adjustedperformance measure. The information ratio is a special versionof the Sharpe Ratio in that the benchmark doesn't have to bethe risk-free rate. The Israelson method is an adjustment of theInformation Ratio to take into account the inconsistency of theIR when excess returns are negative.Net Assets - Average: This is a 12-month trailing average asof the Annual Report's date. If this data is not available in theAnnual Report, a 12-month average is calculated usingsurveyed net assets.Max Drawdown: The peak to trough decline during a specificrecord period of an investment or fund. It is usually quoted asthe percentage between the peak to the trough.Morningstar Rating :The Morningstar Rating for funds, or"star rating", is calculated for funds and separate accounts withat least a three-year history. Exchange-traded funds and openended mutual funds are considered a single population forcomparative purposes. It is calculated based on a MorningstarRisk-Adjusted Return measure that accounts for variation in amanaged product's monthly excess performance, placing moreemphasis on downward variations and rewarding consistentperformance. The top 10% of products in each product categoryreceive 5 stars, the next 22.5% receive 4 stars, the next 35%receive 3 stars, the next 22.5% receive 2 stars, and the bottom10% receive 1 star. The Overall Morningstar Rating for amanaged product is derived from a weighted average of theperformance figures associated with its three-, five-, and 10year (if applicable) Morningstar Rating metrics.Morningstar Style Box: The Morningstar Style Box reveals afund’s investment strategy as of the date noted on thisreport.For equity funds, the vertical axis shows the marketcapitalization of the long stocks owned, and the horizontal axisshows the investment style (value, blend, or growth). Adarkened square in the style box indicates the weightedaverage style of the portfolio.P/B Ratio: The weighted average of the price/book ratios of allthe stocks in a portfolio. The P/B ratio of a company is calculatedby dividing the market price of its stock by the company’s pershare book value. Stocks with negative book values areexcluded from this calculation. In theory, a high P/B ratioindicates that the price of the stock exceeds the actual worthof the company's assets, while a low P/B ratio indicates thatthe stock is a bargain. All P/B ratios greater than 75 are cappedat 75 for the calculation.P/E Ratio: A fund’s price/earnings ratio can act as a gauge ofthe fund’s investment strategy in the current market climate,and whether it has a value or growth orientation. Companies inthose industries enjoying a surge of popularity tend to have highP/E ratios, reflecting a growth orientation. More staid industriestend to have low P/E ratios, reflecting a value orientation.Morningstar generates this figure in-house on a monthly basis,based on the most-recent portfolio holdings submitted by thefund and stock statistics gleaned from our internal U.S. equitiesdatabases. Negative P/Es are not used, and any P/E greaterthan 60 is capped at 60 in the calculation of the average.Return Distribution: A graphical representation, similar to abar chart in structure, that organizes a group of data points intouser-specified ranges. The chart condenses a data series intoan easily interpreted visual by taking many data points, in thiscase, returns and grouping them into logical ranges or bins.R-squared: R-squared is another statistic that is produced bya least-squares regression analysis. R-squared is a numberbetween 0 and 100% that measures the strength of therelationship between the dependent and independentvariables. An R-squared of 0 means that there is no relationshipbetween the two variables and an R-squared of 100% meansthat the relationship is perfect with every scatter point falling 2017 Morningstar, Inc., Morningstar Investment Profiles 312-696-6000. All rights reserved. The information contained herein: (1) is proprietary to Morningstar and/orits content providers; (2) may not be copied or distributed and (3) is not warranted to be accurate, complete or timely. Neither Morningstar nor its content providers areresponsible for any damages or losses arising from any use of information. Past performance is no guarantee of future performance. Visit our investment website atwww.morningstar.com.exactly on the regression line. Thus, stock index funds that trackthe S&P 500 index will have an R-squared very close to100%.A low R-squared indicates that the fund’s movements are notwell explained by movements in the benchmark index. An Rsquared measure of 35%, for example, means that only 35% ofthe fund’s movements can be explained by movements in theindex. R-squared can be used to ascertain the significance of aparticular beta estimate. Generally, a high R-squared willindicate a more reliable beta figure. R-squared ranges from 0(perfectly uncorrelated) to 100 (perfectly correlated).Correlation (p) is the square root of R-squared.Sharpe Ratio: A risk-adjusted measure developed by NobelLaureate William Sharpe. It is calculated by using standarddeviation and excess return to determine reward per unit of risk.The higher the Sharpe Ratio, the better the fund's historical riskadjusted performance. The Sharpe ratio is calculated for thepast 36-month period by dividing a fund's annualized excessreturns by the standard deviation of a fund's annualized excessreturns. Since this ratio uses standard deviation as its riskmeasure, it is most appropriately applied when analyzing a fundthat is an investor's sole holding. The Sharpe Ratio can be usedto compare two funds directly on how much risk a fund had tobear to earn excess return over the risk-free rate.Standard Deviation: A statistical measurement of dispersionabout an average, which, for a mutual fund, depicts how widelythe returns varied over a certain period of time. Investors usethe standard deviation of historical performance to try to predictthe range of returns that are most likely for a given fund. Whena fund has a high standard deviation, the predicted range ofperformance is wide, implying greater volatility. Standarddeviation is most appropriate for measuring risk if it is for a fundthat is an investor's only holding. The figure cannot be combinedfor more than one fund because the standard deviation for aportfolio of multiple funds is a function of not only the individualstandard deviations, but also of the degree of correlation amongthe funds' returns. If a fund's returns follow a normal distribution,then approximately 68 percent of the time they will fall withinone standard deviation of the mean return for the fund, and 95percent of the time within two standard deviations. Morningstarcomputes standard deviation using the trailing monthly totalreturns for the appropriate time period. All of the monthlystandard deviations are then annualized.Tracking Error: Tracking error is a measure of the volatility ofexcess returns relative to a benchmark.Turnover Ratio: US SEC measures the portfolio manager’strading activity by taking the lesser of purchases or sales(excluding all securities with maturities of less than one year)and dividing by average monthly net assets. A turnover ratio of100% or more does not necessarily suggest that all securitiesin the portfolio have been traded. In practical terms, theresulting percentage loosely represents the percentage of theportfolio’s holdings that have changed over the past year.ß Page 4 of 5
MainStay VP Series Mid Cap Core Portfolio Initial ClassDisclosuresThis material is general in nature and is being provided forinformational purposes only. It was not prepared, and is notintended, to address the needs, circumstances and/orobjectives of any specific individual or group of individuals. NewYork Life and its affiliates are not making a recommendation topurchase any specific products. For advice regarding yourpersonal circumstances, you should consult with your ownindependent financial and tax advisors.SMRU1669318 (Exp. 10/17/2017)New York Life Investment Management LLC is the manager /investment advisor for the Investment Division. New York LifeInsurance and Annuity Corporation is the issuer of the variableuniversal life policy in which this Investment Division is madeavailable.New York Life Investment Management LLC is the manager/investment advisor for the Investment Division. New York LifeInsurance and Annuity Corporation is the issuer of the variableuniversal life policy in which this Investment Division is madeavailable.New York Life Insurance and Annuity Corporation ("NYLIAC")CorpExec Variable Universal Life VI ("CEVUL") and CorpExecAccumulator Variable Universal Life ("CEAVUL") insurancepolicies are issued by New York Life Insurance and AnnuityCorporation (A Delaware Corporation) and are distributed byNYLIFE Distributors LLC, Member FINRA/SIPC. NYLIAC & NYLIFEDistributors LLC are wholly owned subsidiaries of New York LifeInsurance Company, 51 Madison Avenue, New York, NY10010.Performance values are calculated using the accumulation unitvalue on the last business day of the prior period and theaccumulation unit value of the last business day of the currentperiod. Please note that the last business day of a month maynot be the last calendar day of that month.The Investment Divisions offered within the CEVUL and CEAVULpolicies are different from mutual funds that may have similarnames but are available directly to the general public.Investment results may differ.Asset Allocations, Sector Weights, Portfolio characteristics andPerformance Results are as of the effective date noted, and aresubject to change based on market and other conditions.Information about the portfolio composition is no indication offuture holdings. Past performance is no guarantee of futureresults.In most jurisdictions, the CEAVUL policy form number is 309-20and the CEVUL VI policy form number is 307-43. In the State ofOregon, the CEAVUL policy form number is 309-27.27 and theCEVUL VI policy form number is 307-43.27.New York Life Insurance CompanyNew York Life Insurance and Annuity Corporation (A Delaware Corporation)51 Madison Avenue, New York, NY 10010www.newyorklife.com 2017 Morningstar, Inc., Morningstar Investment Profiles 312-696-6000. All rights reserved. The information contained herein: (1) is proprietary to Morningstar and/orits content providers; (2) may not be copied or distributed and (3) is not warranted to be accurate, complete or timely. Neither Morningstar nor its content providers areresponsible for any damages or losses arising from any use of information. Past performance is no guarantee of future performance. Visit our investment website atwww.morningstar.com.ß Page 5 of 5
MainStay VP Series Mid Cap Core Portfolio Initial Class Equity 03-31-2017 Performance Disclosure: The performance data quoted represents past performance and does not guarantee future results. The investment return and principal value of an investment will fluctuate; thus an investor's shares, when redeemed, may be worth or more less than