Transcription
International Journal of Engineering Research & Technology (IJERT)ISSN: 2278-0181Vol. 2 Issue 7, July - 2013A Tool For Cost Estimation Using Cocomo Ii And Object Oriented MetricsRahul Chaudhary, Anuj Kumar, Amrendra Pratap1. M.Tech(CSE),ASET,Amity University Noida,2. M.Tech(IT),ASET,Amity University Noida,3. M.Tech(CSE),ASET,Amity University Noida,AbstractThe Software Cost Estimation Tools are becomesprominent in use. Although there are many more toolspresent, but there is not a single tool that allowcomparison of cost and effort of two Real Time Projecton a single window (in parallel), by using GroupingMethod, Object Oriented Metrics and COCOMO II.KeywordsGrouping Methodologies, Object Oriented Metrics,COCOMO II, Class Diagram, Sequence Diagram,CodingIJERTThis paper going to demonstrate my Software, onwhich three modules are designedmore suitable to use(effective to Cost andEffort).b) When same goal project is developed by twodifferent logics, then this Tool helps tocompare between both Real Time Project in asingle Dynamic window on the basic ofObject Oriented MetricFirst module to calculate line of code using ObjectOriented Metrics (Class Diagram, Sequence Diagramand Coding Files),Second module which is dedicated to execute firstmodule to number of times(i.e. both project in parallelor only first project or only second project) and theexecution depend on groups( combination of ClassDiagram, Sequence Diagram and Coding Files) thatare made for real time projects separately usingGrouping Methodology,Third module is the implementation of COCOMO IIover the calculated Lines of Code in second modulewith the help of their four models i.e. Early DesignModel(EDM), Post Architecture Model(PAM),Application Composition Model(ACM) and ReuseModel(RM).This way easily able to Estimate and Compare the costand effort more accurately by taking help/using threetechnologies which are very prominent; they areGrouping Methodologies, Object Oriented Metrics andCOCOMO II. All this work helps a manager orEstimator or User of Software:a) To use the previous work (project) in new RealTime Project i.e. there are many referencesavailable for continuing to new Real TimeProject, this Tool identify which reference isIJERTV2IS70335www.ijert.org1. IntroductionThis paper mainly focuses on the development of toolor comparison of two past work (Real Time Project) inorder to select best among them, to implement theresult in new project(Real Time Project) developmentand the comparison is done with the help of ObjectOriented Metrics(i.e. Case Diagram, Sequence Diagrametc).Although there are many other Work/Tools are alreadyconstructed in market and also available easily, butthere is no software present in market which help amanager to compare Real Time Projects that are doneusing different method for a unique goal, by the help ofObject Oriented Metrics.Various given point gives step by step light over theconcept behind this development: Login Module for Authentication. Sequential (one after another) analysis ofGroups. SLOC (single line of code) calculation usingCase Diagram. SLOC (single line of code) calculation usingSequence Diagram. SLOC (single line of code) calculation usingCoding Files. Total SLOC (single line of code) calculation.2436
International Journal of Engineering Research & Technology (IJERT)ISSN: 2278-0181Vol. 2 Issue 7, July - 2013 Where a (coefficient) is about 2.94 andfactor) is about 1.0997.b (scalingIn practice COCOMO parameters are very differentfrom there typical values, COCOMO II providesclassification of various factors that have theirinfluence on Project cost estimation.While comparing COCOMO and COCOMO II is theintroduction of five scaling factors, out of while threedirectly related to project manager’s activities, and helpto raise the role of management of project in reducingcosts related to project. CMMlevels-Processmaturityisaccounted.Accounting of degree to which projectarch exists and stabilized before phase ofconstruction.Accounting relationship perspective i.e.Team Cohesion, Stockholders andRelations.IJERTImplementation of various COCOMO II submodels. Calculation of Cost and Effort. Comparison of Result using variousTechniques (tables, values, graphs etc.).Steps (2, 3, 4, 5, and 6) are explained next in thesection 3. Rest of other steps in illustrated throughexample in Section-4.This tool helps a manager for estimating in differentaspect, as follow:When a manager want to use the previous work(project) in new Real Time Project i.e. there are manyreferences available for continuing to new Real TimeProject, this Tool identify which reference is moresuitable to use as reference to Cost and Effort.When same goal project is developed by two differentlogics, then this Tool helps to compare between bothReal Time Project in a single Dynamic window.From 1960s, there are many software project models,such as – COCOMO (Constructive cost model) byB.W.Bohem[1], Albrecht’s FPA (functional pointanalysis), and Putman Model by Putman [2]. Out ofwhich FPA is very representative [3], use of varioussub-model Methods for Cost Estimation will decreasethe Error margin in between 20%. Whereas after thedevelopment realized that impact of this error is stilllarge. Therefore use COCOMO II model, to set theforecast accuracy of our software as our first goal, andthen discuss Cost Estimation accuracy from thePractice and Innovative views.1. Technologies used for Estimation:1.1. COCOMO II:As COCOMO (constructive cost model) is one whichgives manager a path to estimate project Duration andCost. It was developed by Barry Boehm in the earlyEighties [7].The COCOMO II [8] Model is update of COCOMOModel in order to address software development during1990 & 2000s. The model is now invigorative softwareengineering artefact that has, customer perspective,with following features:I.II.Simple and well tested model.Provide accuracy about 70% in time and20% in cost.In general COCOMOII is used to estimate project cost,directly from person-months efforts, just assuming thatproject file size expressed in (SLOC) i.e. thousandssingle lines of code. Using estimation formula:1.2. SLOC (size in single line of code) calculationmeasure:The line of code generated by software activities andthe source program code which is used to measuring oflinage (most commonly), also instruction number ofobject code [4] (2.2), delivered system documentationphases. The calculation of single line of code includesdesign and analysis, written program, instruments testsand documentation of system in person-month.1.3. Measures in Object Oriented concepts:Focus on C&K[5] and MOOD[6] Measures to identityweather a design is reasonable or not reasonable. C&Kgives six class level Metrics: Each class weightedmethod, inheritance tree depth, total children; objectclasses coupling, responses for a class, methods havinglack of cohesion.MOOD Measures allusion to four attributes i.e.Polymorphism, Inheritance, Encapsulation andMessage transferring of object oriented. Two mostimportant measures i.e. methods of attributes are maincharacteristics of MOOD.effort (in person month) a * KSLOCbIJERTV2IS70335www.ijert.org2437
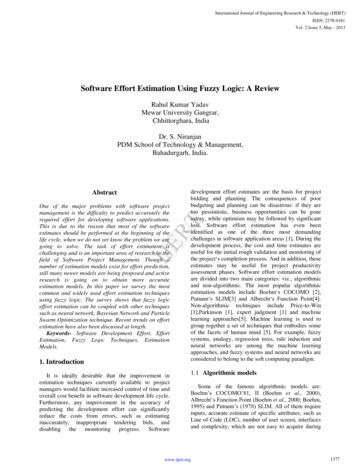
International Journal of Engineering Research & Technology (IJERT)ISSN: 2278-0181Vol. 2 Issue 7, July - 20132. Software project Cost Estimation:Divide the software into components. This is calledsplitting or grouping of software which not requireunnecessary internal knowledge and his helps toconfigured to complete word as required, hence by thisway, it is easy and convenient for developer and itprovides great convenient for estimation.After grouping, application having two relationships:Integer relationship b/w classes with in an individualgroup.The relationship b/w various groups are previouslycreated.Now while see the individual group then realize thatlarge-scale work/application is decomposed into smallwork, which is much easy to analyses and solve. Thisleads to improve accuracy of estimation results. To therelation b/w groups, because of several feature detailsof grouping are hidden, the application granularity getsmaller, and dramatically complexity reduced.measuring of each class in design groups and then fromthe output determine complexity of classes togetherwith measurement of reasonable design.Now, for reasonable designs, proceeds to size calculateon of code for each reasonable group, this calculationdone as follow.a) For Class Diagram:In the class diagram, there several methods whichrequire only one line of code to elaborate like get value,set value etc. All these are taken as single line of codeand record to database, together with a record ofmethod name in database where as several are muchcomplex and needed more single line of code toelaborate hence to note those methods from classdiagram such as insert, division and sequence diagramof those methods are needed to draw for calculatingtotal single line of code corresponding to those method. Complete class diagram. Complete sequence diagram.IJERTNow, for individual group, often details designcompletion each group will have.Now, use both of above complete class and sequencediagram, i.e. as follow Use number of class in class diagram. The number of methods in all class.The relationship b/w class C i.e. aggregation,inheritance etc, to calculate total size i.e. single line ofcode.While dealing with high complexity , weighted forreasonable value is required and then use COCOMO2model for calculation of cost and effort for relation b/wvarious groups, where when a group call another is arelationship that usually exist or data transfer b/wdifferent group. Whereas this complete process ismainly suitable for functional point analysis.Figure 1 Class Diagram AnalysisNOTE: The methods analyzed, needed to inputthere name or record their name to database.Here in this paper, demonstrating a new methodthrough as my software describe in [7] to calculate thefunction point through these group diagram and usecase figure/diagram.Basic idea behind this development is UML classdiagram and sequence diagram in order to calculatesingle line of code size of each group individually.Firstly use C&K [5] and MOOD [6] measure forIJERTV2IS70335www.ijert.org2438
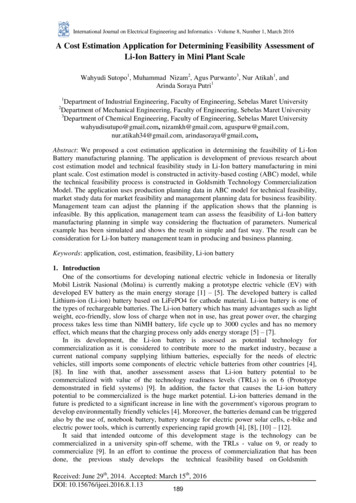
International Journal of Engineering Research & Technology (IJERT)ISSN: 2278-0181Vol. 2 Issue 7, July - 2013b) For Sequence Diagram:First, you have to enter number of methods, that arewith your corresponding group which is currentlyused process, whose sequence diagram areanalyzed for calculating single line of code. Andthen our software window repeats that number oftime for the analysis of all sequence diagrams.Hence in analysis of sequence diagrams are focuson real line arrow (each operation) as single line ofcode (one line), but if the method is more complex,then single operation can also noted as more thanone line, and here to estimate source code size ofsequence diagram very properly.c) Coding File Analysis:Browse Coding files to software for calculatingtotal single line of code in file, this softwareautomatically remove single line comments,multiline comments and white/ blank lines, Itimports all files to their database and auto recordall the results to database, including those SLOCwhich are already calculated using class andsequence diagrams analysis.d) Total SLOC Calculation:Now, have all method names that are analyze inclass diagrams analysis & sequence diagramanalysis and also total SLOC calculation in codingfile analysis. This data is used to calculateSignificant number of accurate SLOC, Softwareauto recognize all the methods by name and as ithave all coding files loaded in it, Now it removethose SLOC which are already counted in the ClassDiagram Analysis & Sequence Diagram Analysisby recognizing the module of concern methodsname that saved in database during previous steps.IJERTAlthough, if complexities of class in grouping aredifferent, to the method of high complexity, useweighted value to multiply its source code by usingCarrying out complexity analysis and weightedvalue estimation. Apply CBO method and COFmethod.After estimation of size of project code throughclass and sequence diagrams- proceeds to coding.Figure 2: Number of Sequence DiagramFigure 4 Coding Files Analysis (allow any number offile select)Figure 3 Sequence Diagram AnalysisNOTE: The methods analyzed, needed to inputthere name or record their name to database.IJERTV2IS70335Hence this way, calculate total SLOC related toconcern group, and also for every group insequential fashion,Repeat section 3 repeatedly for every group inorder to calculate each group separately, thisrealistically increases the accuracy of estimatingthe source code size, and average margin is nowbounded b/w 5%.www.ijert.org2439
International Journal of Engineering Research & Technology (IJERT)ISSN: 2278-0181Vol. 2 Issue 7, July - 20133. Example to Illustrate ([4] (Sec-4)):Example provides accuracy in result of sizecomputation of source code. for user informationcomponents. This component based on databaseoperation i.e. getting user’s information, creatinguser (new), modify user detail, deleting userinformation & updating user’s status.Using Java language to develop the component,and JDBC used to operate databases, the classdiagram in fig given below:Figure 6 [9] Sequence diagram for deleting MethodIJERTGet the estimated SLOC is 5 and figure 7 showsimplementation of method to delete userFigure 5 [9] Class Diagram of user info.Here User Profile is an entity class, used to storeinformation that is user required. To make thiscomponent more flexible, define interface calledUser Persistence, and five methods on it to achievefunctionsthatareabovementioned.User Persistence implements User Db Persistenceand information of user stored in database if theclass diagram is reasonable (reasonabilityexplained in section-3) then calculate Source CodeSize of Component.According to methodexplained in analysis of Class Diagram, thosemethods in User Db Persistence are more complex& required to have sequence diagram. For examplelet deleting user’s Information Method.Figure 7 [9] Coding for deleting UserGet the estimated SLOC is 10.While calculating size of source code, usingfollowing rules: If there is semicolon, it is new line. Logical operation counted as one line i.e.if else, do while, for, try catch finallyetc. The right bracket not recognized as singleline. Breaking of one statement in more thanone line, then it can be counted as on line.Using the above rules count the Size of coding filei.e. as shown in (figure 7).The last step is to use Cost Estimation ModelCOCOMOII for Cost Estimation, Which take thecalculation size of source code as input & used forIJERTV2IS70335www.ijert.org2440
International Journal of Engineering Research & Technology (IJERT)ISSN: 2278-0181Vol. 2 Issue 7, July - 2013achieving the result but there is little difference, i.e.no direct implementation of COCOMO II ispossible but in its place use its 4 sub models namedas: Early design model Post-architecture model Application composition model Reuse modelFigure 9 : Early Design Model (parameters) SnapshotIJERTFigure 8 Model Selection SnapshootFigure 10 Early Design Model (Result) Snapshot4. Conclusion:Figure 8 Early Design Model (selected) SnapshotFor calculation of Cost Estimation for both theWindow in parallel, hence using this approach, i.e.the use of some model for task estimation increaseour system flexibility to do their task and alsoprovide more choice to the user.IJERTV2IS70335Correct and accurate Estimation in cost of project(guarantee our work). Software project costestimation methods based on grouping/groups asthey are new methods that estimates softwareproject cost accurately, which is then comparedbetween both the window (or projects result) resultand help to fetch out much accurate and correctcomparison that helps user/manager to select bestold work for their future project. All this is basedon RUP (Rational Unified Model), and this ismilestone in Software Development CostEstimation together with it helps to reduce cost andtime engaged in software development andestimations.www.ijert.org2441
International Journal of Engineering Research & Technology (IJERT)ISSN: 2278-0181Vol. 2 Issue 7, July - 20135. Future Work: Analysis of class diagram Image throughDIP (Digital Image Processing) and AI(Artificial Intelligence). Analysis of Sequence diagram Imagethrough DIP (Digital Image Processing).Making the solution online. 6. ReferencesBoehm B W. Software l, 1981.[2]H. Putnam. "A General Empirical Solutionto the Macro Software Sizing andEstimating Problem". IEEE Transactionson Software Engineering,1978(7), 1(4).[3]P. S. Pressman. “Software Engineering”.National defense industry Press. twareProjectCostEstimation Based On Groupware”, 2009[5]Shyam R. Chidamber, Chris F. Kemerer.Towards A Metric Suite for ObjectOriented Design. IEEE Trans.Softw.Eng,1994.[6]Abreu, Fernando B. "The MOOD MetricsSet," Proc. ECOOP'95 Workshop onMetrics, 1995.[7]“software Engineering economics ” byBarry Boehm, Prentice Hall, 1981.[8]“SoftwareCostEstimationWithCOCOMO II”, Prentice HALL, 2000.[9]Software Project Cost Estimation BasedOn Groupware by JIN Yongqin1,LIIJERT[1]Jun,LIN Jianming,CHEN QingzhangIJERTV2IS70335www.ijert.org2442
then discuss Cost Estimation accuracy from the Practice and Innovative views. 1. Technologies used for Estimation: 1.1. COCOMO II: As COCOMO (constructive cost model) is one which gives manager a path to estimate project Duration and Cost. It was developed by Barry Boehm in the early Eighties [7]. The COCOMO II [8] Model is update of COCOMO