Transcription
Margining ProcessMargin ModelEconometric MethodologyEmpirical ResultsSimple Parametric Models for Generating Stableand Efficient Margin Requirements for DerivativesCarol Alexander Andreas KaeckAnannit SumawongUniversity of Sussex c.alexander@sussex.ac.ukThematic Semester, ParisNovember 2015Thematic Semester, Paris
Margining ProcessMargin ModelEconometric MethodologyOutlineIMargining Process:Players, challenges, regulations and SPANIMargin Model:Risk metric (MTL) and parameter-based margin rulesIEconometric Methodology:Calibration, backtesting, margin model selectionIEmpirical Results:On WTI and comparison with SPANThematic Semester, ParisEmpirical Results
Margining ProcessMargin ModelEconometric MethodologyEmpirical ResultsPlayersPlayers in the Futures MarketRecommendationsRegulatorsCentral BanksLawSupervisionCentral Counter Parties (CCP)Margin ( )SpeculatorsMargin (-)Clearing MembersMargin (?)Smaller ClientsThematic Semester, ParisMargin (-)Hedgers
Margining ProcessMargin ModelEconometric MethodologyEmpirical ResultsPlayersInstitutions Registered with CCPCCP recevies margins from three types of registered counterpartiesIClearing Members:IIIILarge Hedgers:IIMembers receive net positions from clients (small speculators,hedgers, brokers)Margin required from clients is typically higher than marginpaid to CCPThe whole margining process is supervised by the CCPLarge institutional investorsLarge Speculators:IHigher marginsThematic Semester, Paris
Margining ProcessMargin ModelEconometric MethodologyEmpirical ResultsPlayersRole of Central Counter Party (CCP)IBuyers and sellers deposit initial margin on entering tradeagreementIPortfolios MtM daily and price evolution trackedIMargin call initiated when maintenance margin falls belowbound given by daily maintenance margin calculationIDefault on call CCP takes financial obligation of portfolioICCP has recourse to additional capital via default waterfallThematic Semester, Paris
Margining ProcessMargin ModelEconometric MethodologyEmpirical ResultsPlayersDefault WaterfallIAfter default on maintenance margin call, CCP utilises capitalin this order:1. Initial margin2. Default fund contributions from defaulting clearing member3. A tranche of the CCP’s own capital4. Default fund contributions from surviving clearing members5. Unfunded default fund contributions6. Additional CCP capitalThematic Semester, Paris
Margining ProcessMargin ModelEconometric MethodologyEmpirical ResultsPlayersRegulators Views on CCP MarginsIAre CCPs now ‘’too big to fail”IPro-cyclicality Fear of tax-payer bailouts Focus on stability of margin requirementsIAre margins sufficiently prudent? And is the default waterfalladequate?I CCPs required to integrate margin model withinenterprise-wide risk management systemThematic Semester, Paris
Margining ProcessMargin ModelEconometric MethodologyEmpirical ResultsPlayersNew Margin RegulationsIDodd-Frank Act (2010)IIIIRequirements for OTC trades to move to CCPsStrict requirements on margins for some derivativese.g. Margins for un-cleared swaps must cover the 10-day 99% VaREMIR (2013)IEuropean Market Infrastructure RegulationsStrict requirements on all OTC derivatives:IPortfolio margining, liquidity/concentration adjustments by capital type,stress testing, backtesting, default fund contributions, etc.e.g. Exchange-traded derivatives margins must cover the 2-day 99% VaRIThematic Semester, Paris
Margining ProcessMargin ModelEconometric MethodologyEmpirical ResultsSPANStandard Portfolio Analysis of Risk Software (SPAN)ICME (1988). Now used by largest exchanges, e.g. ICEILacks firm econometric foundation: hundreds of parametersrequire re-setting dailyIMargin requirement worst case loss over 16 scenariosITechinical documents difficult to assess. Also, historical seriesof SPAN margins is difficult to recreate exactly [Kupiec and White, 1996]IHistorical data on parameters:https://www.theice.com/clear europe span.jhtml for ICE products t/historical-margins.html for some CME productsThematic Semester, Paris
Margining ProcessMargin ModelEconometric MethodologyEmpirical ResultsSPANObtaining SPAN MarginsISome historical movements on CME ent/historical-margins.htmlIICE SPAN software free download and twice-daily parameterfiles here:https://www.theice.com/clear europe span.jhtmlIEnd-of-day historical parameter files downloaded January 2009to December 2014 daily time series of margin movementsfor any product (WTI crude oil futures in this case)Thematic Semester, Paris
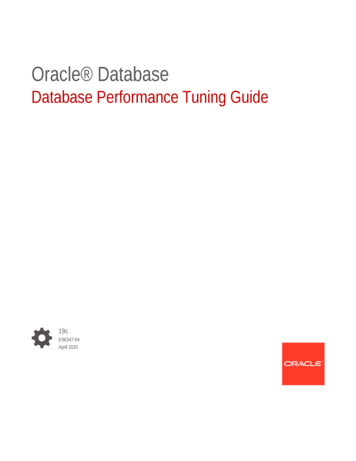
Margining ProcessMargin ModelEconometric MethodologyEmpirical ResultsSPANSPAN Margins: WTI Crude Synthetic 30-dayP&LICECME1086420 2 4 6 8 10Jan 10Jan 11Jan 12Jan 13Jan 14Daily P&L on WTI 30-day Contracts (grey)ICE (blue) and CME (green) SPAN margin movements Jan 2009 – Dec 2014.Thematic Semester, Paris
Margining ProcessMargin ModelEconometric MethodologyEmpirical ResultsChallengesExchange Clearing ActivitiesRank12345678910ExchangeJan-Dec 2013Jan-Dec 2014% ChangeCME GroupIntercontinental ExchangeEurexNational Stock Exchange of IndiaBM&FBovespaMoscow ExchangeCBOE HoldingsNasdaq OMXShanghai Futures ExchangeDalian Commodity 60%-1.40%31.10%9.90%The ten largest exchanges clearing futures and options contracts.Thematic Semester, Paris
Margining ProcessMargin ModelEconometric MethodologyEmpirical ResultsChallengesSummary of Challenges for ExchangesIICompetitive EnvironmentIHow to fund large-scale risk management system?IConflicts between EURO and US recommendations?Unclear recommendationsIISome EMIR (2013) articles still under debateSPAN requires updating . Or replacing?IHow to build a parsimonious margin model that is:Thematic Semester, ParisIBased on sound econometric principles? What principles?IYields prudent and stable and competitive margin re-setsIIntegrated within the enterprise-wide risk management system
Margining ProcessMargin ModelEconometric MethodologyEmpirical ResultsChallengesMargin Requirement LiteratureIPrudential Margin Requirements: Should cover all possibleprice movements[Figlewski, 1984], [Booth et al., 1997],[Cotter and Dowd, 2006]IEfficient Contract Design: Setting margins and price limitssimultaneously[Brennan, 1986], [Fenn and Kupiec, 1993],[Shanker and Balakrishnan, 2005]IRules-Based Models: Risk metrics used as bounds formargin re-sets[Chiu et al., 2006], [Lam et al., 2010]Thematic Semester, Paris
Margining ProcessMargin ModelEconometric MethodologyEmpirical ResultsChallengesResearch Questions for our Parsimonious Margin ModelIWhat’s the best risk measure for a rules-based margin model?IHow can the model incorporate challenges for exchanges?IHow to formulate a calibration procedure which produces anoptimally stable margin which balances two aims:(a) small and frequent margin re-sets are operationally costlyfor investors and exchanges, but they avoid pro-cyclicality infinancial markets, vs(b) fewer, larger re-sets can produce stable margins over time,but they are highly risky in this competitive environmentThematic Semester, Paris
Margining ProcessMargin ModelEconometric MethodologyEmpirical ResultsOutlineIMargining Process:Players, challenges, regulations and SPANIMargin Model:Risk metric (MTL) and parameter-based margin rulesIEconometric Methodology:Calibration and backtesting of two-stage margin modelIEmpirical Results:On WTI and comparison with SPANThematic Semester, Paris
Margining ProcessMargin ModelEconometric MethodologyTwo-Stage Margin ModelStage 1: Risk Metric (MTL) EstimationBased on calibration to portfolio returnsAt set-up, a selection of competing riskmodels for estimating MTL are calibrated andback-tested and the ‘best’ model selected(e.g. Student-t EGARCH).Stage 2: Margin Rule Parameters CalibratedBased on historical series of ‘best’ MTL estimatesAt set-up, a selection of parsimonious rulesbased ‘models’ are calibrated and backtested and the ‘best’ model selectedThematic Semester, ParisEmpirical Results
Margining ProcessMargin ModelEconometric MethodologyEmpirical ResultsMTLMargins Based on VaRI[Dowd and Blake, 2006] - Volatility, Value-at-Risk (VaR),Expected Tail Loss (ETL), Median Tail Loss (MTL), partialmoments, etc.IMargins based on VaR; estimated via EVT [Figlewski, 1984],[Booth et al., 1997],[Broussard and Booth, 1998],[Longin, 1999], [Broussard, 2001], [Cotter, 2001]Iα% h-day VaR is α-quantile of h-day returns distributionILiterature review [Abad et al., 2014]Thematic Semester, Paris
Margining ProcessMargin ModelEconometric MethodologyEmpirical ResultsMTLMargins Based on VaRIVaR is elicitable [Gneiting, 2011]IBut is VaR coherent?IINot always, [Acerbi and Tasche, 2002]IParametric VaR with no numerical error is typically coherent[Danı́elsson et al., 2013]However, VaR does not represent the extent of losses, shouldVaR be exceed VaR not suited to margin modelThematic Semester, Paris
Margining ProcessMargin ModelEconometric MethodologyEmpirical ResultsMTLWhy Median Tail Loss (MTL)?IExpected tail loss (ETL) expected loss, given VaRIETL is coherent. Advocates: [Acerbi and Tasche, 2002],[Tasche, 2002], [Yamai and Yoshiba, 2005]IBut ETL is not elicitable [Gneiting, 2011]IThe α% MTL is simply the (1 α)/2 percentile VaRITherefore MTL is representative of the scale of loss,elicitable and coherent – provided MTL parametric andestimates analyticThematic Semester, Paris
Margining ProcessMargin ModelEconometric MethodologyEmpirical ResultsMTLStage 1: MTL ModelsIEWMA:2σ̂t2 ζ σ̂t 1 (1 ζ)ε2t 1 ,Iεt rt r tEGARCH: [Nelson, 1990]ln σt β0 g (εt 1 ) β3 ln σt 1 ,g (εt ) β1 εt β2 ( εt E [ εt ]),Iwithεt D(0, σt2 )GJR-GARCH: [Glosten et al., 1993]2σt2 β0 β1 ε2t 1 β2 σt 1 β3 1εt 1 0 ε2t 1Thematic Semester, Paris
Margining ProcessMargin ModelEconometric MethodologyEmpirical ResultsMargin Re-set RulesStage 2: Margin Re-set Rules Based on BufferMargins driven by MTL evolution with periodic jumps.EMIR (Article 28a) Base rules on buffer of at least 25%, which may be exhaustedwhen margins increases significantly. Graph below illustrates three possible re-set rulesMargin BoundsM(1)M(2)M(3)2.521.5150100150timeThematic Semester, Paris200250
Margining ProcessMargin ModelEconometric MethodologyEmpirical ResultsMargin Re-set RulesMargin RulesIAll rules are based on symmetric margin band of width equalto the buffer B above the MTL, i.e.Margin band at time t [Mt , (1 B) Mt ] , where Mt MTL0.99,1tIBoundary hit margin reset to different level Rt :Rule LabelReset Level (Rt )M (1)1.125 MtM (2)(1 β) MtM (3)(1 β u ) Mt if margin falls below Mt(1 β d ) (1 B) Mt if margin exceeds (1 B)MtThematic Semester, Paris
Margining ProcessMargin ModelEconometric MethodologyEmpirical ResultsMargin Re-set RulesMargin Rule CalibrationIMargin resets follow a process with correlated jump size andarrival timeIFocus on stability calibration parameters, e.g. β u , β dbased on minimizing the variance of this processIA standard compound Poisson process Yt PNti 1 Xihas i.i.d. jumps sizes Xi X , independent of Nt , t 0IIts total variance between time 0 and time t is V [Yt ] E [Nt ] E X 2Thematic Semester, Paris
Margining ProcessMargin ModelEconometric MethodologyEmpirical ResultsOutlineIMargining Process:Players, challenges, regulations and SPANIMargin Model:Risk metric (MTL) and parameter-based margin rulesIEconometric Methodology:Calibration and backtesting of two-stage margin modelIEmpirical Results:On WTI and comparison with SPANThematic Semester, Paris
Margining ProcessMargin ModelEconometric MethodologySummary of New Model ImplementationStage 1:1. Calibrate MTL models: MLE2. Backtest MTL models: [Christoffersen, 1998]3. Select MTL model(s): [Gneiting and Ranjan, 2011]4. Check robustness of results: [Hansen et al., 2011]Stage 2:1. Use historical estimates on selected MTL model(s) tocalibrate margin rule parameters2. Backtest margin rulesThematic Semester, ParisEmpirical Results
Margining ProcessMargin ModelEconometric MethodologyEmpirical ResultsBacktesting MTLIBacktesting VaR [Kupiec, 1995], [Christoffersen, 1998],[Engle and Manganelli, 2004]ICCPs exposed to long and short positions simultaneously Use the lesser-known [Christoffersen, 1998] two-tailedcoverage testsILR uc χ23 , LR in χ24 and LR cc χ26 respectivelyThematic Semester, Paris
Margining ProcessMargin ModelEconometric MethodologyEmpirical ResultsMTL Model SelectionF(z)The actual forecastThe perfect forecastzThematic Semester, Paris
Margining ProcessMargin ModelEconometric MethodologyEmpirical ResultsContinuous Ranked Probability Score (CRPS)[Gneiting and Ranjan, 2011]ForecastBetter Forecast10.80.60.40.20 3 2 10123Figure 1: Continuous Ranked Probability Score (CRPS) is equal to the sum of thesquared shaded areas.Thematic Semester, Paris
Margining ProcessMargin ModelEconometric MethodologyEmpirical ResultsContinuous Ranked Probability Score (CRPS)[Gneiting and Ranjan, 2011]ForecastBetter ForecastPerfect Forecast10.80.60.40.20 3 2 10123Figure 2: (Weighted) relative CRPS negative value indicates first model betterThematic Semester, Paris
Margining ProcessMargin ModelEconometric MethodologyEmpirical ResultsRobustness Check: Model Confidence Set (MCS)[Hansen et al., 2011]IExtension of Hansen’s SPA in absence of benchmark modelICorrects for data-snooping bias when testing out-performanceI Like SPA, MCS uses pair-wise comparison of distribution of 10,000 performance metrics (CRPS) each based on very large bootstrapped samplesI But MCS more computationally intensive, e.g. with 10 models no. pairwisecomparisons is about 100,000, each taking 10,000 repetitions of the bootstrapITesting down yields a set of superior models which arestatistically indistinguishable from each other at auser-specified level of confidenceThematic Semester, Paris
Margining ProcessMargin ModelEconometric MethodologyOutlineIMargining Process:Players, challenges, regulations and SPANIMargin Model:Risk metric (MTL) and parameter-based margin rulesIEconometric Methodology:Calibration and backtesting of two-stage margin modelIEmpirical Results:On WTI and comparison with SPANThematic Semester, ParisEmpirical Results
Margining ProcessMargin ModelEconometric MethodologyEmpirical ResultsDataEnergy FuturesRank123456789ContractJan-Dec 2013Jan-Dec 2014ChangeBrent Crude (ICE)LS Crude, WTI (CME)HH NG (CME)Coke (DCE)Coking Coal (DCE)Gasoil (ICE)NYH RBOB (CME)HO No.2 (CME)WTI Crude 12.0%-44.8%68.1%-17.5-0.1%3.7%-12.5%Top ten traded energy futures by contracts ual-global-futures-and-options-volume-gainThematic Semester, Paris
Margining ProcessMargin ModelEconometric MethodologyEmpirical ResultsDataWTI Crude Oil Futures0.10 0.1Jan 90Jan 94Jan 98Jan 02Jan 06Jan 10Jan 1430-day synthetic WTI crude oil futures daily returnsNov 1989 – Dec 2014Thematic Semester, Paris
Margining ProcessMargin ModelEconometric MethodologyEmpirical ResultsStage 1Stage 1ICalibrate GARCH parameters for the first sample period (Inour case, Jan 1990 - Dec 1995)IRoll the sample forward daily, re-estimating all parameters togenerate a series of 1-day 99% MTL forecasts for the riskmodel out-of-sample period (In our case, Jan 1995 - Dec2008)IBacktesting, Selection, RobustnessThematic Semester, Paris
Margining ProcessMargin ModelEconometric MethodologyEmpirical ResultsStage 1Backtesting: Coverage ResultsCodeIIIIIIIVVVIVolatilityErrorUCINDCCEWMA 0.96EWMA 0.96Student CHEGARCHEGARCHGJRGJRStudent tnormalStudent tnormalStudent 27Rejection at 95% (99%) level indicated by red (dark red)EWMA smoothing constants 6 0.96 reject nulls with even greater confidenceThematic Semester, Paris
Margining ProcessMargin ModelEconometric MethodologyEmpirical ResultsStage 1Selection: CRPS ResultsSymmetric: CRPS weights (φ, 1 φ)No RCHEGARCHEGARCHGJRGJRStudent tnormalStudent tnormalStudent 75-3.16–Both CHEGARCHEGARCHGJRGJRStudent tnormalStudent tnormalStudent 74-3.00–Thematic Semester, Paris
Margining ProcessMargin ModelEconometric MethodologyEmpirical ResultsStage 1Selection: CRPS ResultsAsymmetric: CRPS weights (Φ, 1 Φ)Right HEGARCHEGARCHGJRGJRStudent tnormalStudent tnormalStudent 95-0.89–Left HEGARCHEGARCHGJRGJRStudent tnormalStudent tnormalStudent 00-3.36–Thematic Semester, Paris
Margining ProcessMargin ModelEconometric MethodologyEmpirical ResultsStage 1Robustness: MCS ResultsModels in 25% or higher MCS should confirm CRPS results same tail-weight combinations as in CRPS testsBest model p-value 1.00All models with a p-value 0.25 lie in the 25% MCSErrorVolatilityNo WeightLeft TailRight TailBoth TailsIIIIIIIVVVIt-GARCHNormal 000.284MCS p-values. Blue belongs to 25% MCSThematic Semester, Paris
Margining ProcessMargin ModelEconometric MethodologyStage 1Stage 1: ConclusionsI[Christoffersen, 1998] Best backtests:Student t, EGARCH or GJRI[Gneiting, 2011] Best CRPS:Student t, EGARCH or GJRI[Gneiting and Ranjan, 2011] Models in 25% MCS:GARCH, EGARCH or GJR with Student t innovationsIModels III and V taken to Stage 2IIStudent t innovationsEGARCH and GJR conditional variance processesThematic Semester, ParisEmpirical Results
Margining ProcessMargin ModelEconometric MethodologyEmpirical ResultsStage 2Stage 2: Margin Rule Implementation ProcedureICalibrate MTL models III and V, sample Jan 1995 - Dec 2008IForecast a time series for each 1-day 99% MTLICalibrate margin rule parameters for each MTLIApply the same margin parameters out-of-sample (Jan 2009 Dec 2014) and compare margins with SPAN over this periodThematic Semester, Paris
Margining ProcessMargin ModelEconometric MethodologyEmpirical ResultsStage 2Margin Model StabilityCPP VarianceUpper tailLower .76123.55693.342No. ExceedancesUpper tailLower tailSPAN4545Model III: Student-t EGARCH223532412Model III: Student-t GJR243632412Average ExceedanceUpper tailLower .5788.163CPP variance, number of margin exceedances and average exceedances for eachmargin rule according to MTL models III and IV. Out-of-sample period: Jan 2009 Dec 2014. CPP variance in 2 . Average exceedances denoted in per bblThematic Semester, Paris
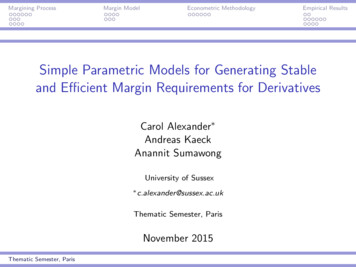
Margining ProcessMargin ModelEconometric MethodologyEmpirical ResultsStage 2Margin Evolution Out-of-SampleP&LMTL0.99,1ICE SPANCME SPANM(3)M(2)1086420 2 4 6 8 10Jan 10Jan 11Jan 12Jan 13Jan 14Out-of-sample margins for the 30-day synthetic WTI futures (Jan 2009 - Dec 2014).Based on Student t-EGARCH modelThematic Semester, Paris
Margining ProcessMargin ModelEconometric MethodologyEmpirical ResultsStage 2SummaryIParsimonious two-stage margin calibration process seeks toaddress current challenges for CPPs and regulatorsIParametric MTL models preferred elicitable, sub-additiveand reflect average extreme lossIPreliminary results 25% buffer can provide foundation forparsimonious model which generates margins as stable as ICEhistorical SPANIExtension to multivariate framework: aggregated MTL shouldincorporate term-structure and cross-product correlationsINext step: calibrate margin rules based on minimisingvariance of coupled CTRWThematic Semester, Paris
Margining ProcessMargin ModelEconometric MethodologyEmpirical ResultsStage 2Abad, P., Benito, S., and López, C. (2014).A comprehensive review of value at risk methodologies.The Spanish Review of Financial Economics, 12(1):15–32.Acerbi, C. and Tasche, D. (2002).Expected shortfall: a natural coherent alternative to value at risk.Economic notes, 31(2):379–388.Booth, G. G., Broussard, J. P., Martikainen, T., and Puttonen, V. (1997).Prudent margin levels in the Finnish stock index futures market.Management Science, 43:1177–1188.Brennan, M. J. (1986).A theory of price limits in futures markets.Journal of Financial Economics, 16(2):213–233.Broussard, J. P. (2001).Extreme-value and margin setting with and without price limits.The Quarterly Review of Economics and Finance, 41(3):365–385.Broussard, J. P. and Booth, G. (1998).The behavior of extreme values in Germany’s stock index futures: An applicationto intradaily margin setting.Thematic Semester, Paris
Margining ProcessMargin ModelEconometric MethodologyEmpirical ResultsStage 2European Journal of Operational Research, 104(3):393–402.Chiu, C.-L., Chiang, S.-M., Hung, J.-C., and Chen, Y.-L. (2006).Clearing margin system in the futures markets–applying the value-at-risk modelto taiwanese data.Physica A: Statistical Mechanics and its Applications, 367(0):353 –374.Christoffersen, P. F. (1998).Evaluating interval forecasts.International Economic Review, 39(4):841 – 862.Cotter, J. (2001).Margin exceedences for european stock index futures using extreme value theory.Journal of Banking & Finance, 25(8):1475 – 1502.Cotter, J. and Dowd, K. (2006).Extreme spectral risk measures: An application to futures clearinghouse marginrequirements.Journal of Banking & Finance, 30(12):3469 – 3485.Danı́elsson, J., Jorgensen, B. N., Samorodnitsky, G., Sarma, M., and de Vries,C. G. (2013).Fat tails, var and subadditivity.Thematic Semester, Paris
Margining ProcessMargin ModelEconometric MethodologyEmpirical ResultsStage 2Journal of econometrics, 172(2):283–291.Dowd, K. and Blake, D. (2006).After var: The theory, estimation, and insurance applications of quantile-basedrisk measures.Journal of Risk and Insurance, 73(2):193–229.Engle, R. F. and Manganelli, S. (2004).CAViaR.Journal of Business & Economic Statistics, 22(4):367–381.Fenn, G. W. and Kupiec, P. (1993).Prudential margin policy in a futures-style settlement system.Journal of Futures Markets, 13(4):389–408.Figlewski, S. (1984).Margins and market integrity: Margin setting for stock index futures andoptions.Journal of Futures Markets, 4(3):385–416.Glosten, L., Jagannathan, R., , and Runkle, D. (1993).On the relation between the expected value and the volatility of nominal excessreturn on stocks.Thematic Semester, Paris
Margining ProcessMargin ModelEconometric MethodologyEmpirical ResultsStage 2Journal of Finance, 48:1779–1801.Gneiting, T. (2011).Making and evaluating point forecasts.Journal of the American Statistical Association, 106(494):746–762.Gneiting, T. and Ranjan, R. (2011).Comparing density forecasts using threshold-and quantile-weighted scoring rules.Journal of Business & Economic Statistics.Hansen, P. R., Lunde, A., and Nason, J. M. (2011).The model confidence set.Econometrica, 79(2):453–497.Kupiec, P. H. (1995).Techniques for verifying the accuracy of risk measurement models.The Journal of Derivatives, 3(2).Kupiec, P. H. and White, A. P. (1996).Regulatory competition and the efficiency of alternative derivative productmargining systems.Journal of Futures Markets, 16(8):943–968.Lam, K., Yu, P., and Lee, P. (2010).Thematic Semester, Paris
Margining ProcessMargin ModelEconometric MethodologyEmpirical ResultsStage 2A margin scheme that advises on when to change required margin.European Journal of Operational Research, 207(1):524–530.Longin, F. M. (1999).Optimal margin level in futures markets: Extreme price movements.Journal of Futures Markets, 19(2):127–152.Nelson, D. B. (1990).ARCH models as diffusion approximations.Journal of Econometrics, 45(1-2):7 – 38.Shanker, L. and Balakrishnan, N. (2005).Optimal clearing margin, capital and price limits for futures clearinghouses.Journal of Banking & Finance, 29(7):1611 – 1630.Tasche, D. (2002).Expected shortfall and beyond.Journal of Banking & Finance, 26(7):1519–1533.Yamai, Y. and Yoshiba, T. (2005).Value-at-risk versus expected shortfall: A practical perspective.Journal of Banking & Finance, 29(4):997–1015.Thematic Semester, Paris
Margining Process Margin Model Econometric Methodology Empirical Results SPAN Standard Portfolio Analysis of Risk Software (SPAN) I CME (1988). Now used by largest exchanges, e.g. ICE I Lacks rm econometric foundation: hundreds of parameters require re-setting daily I Margin requirement worst case loss over 16 scenarios