Transcription
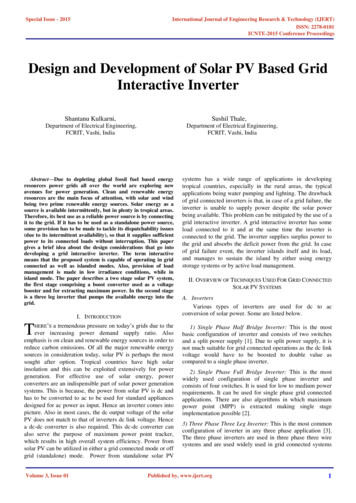
GEGrid SolutionsPerception FleetTransformer Fleet Risk ManagementSoftware SystemSmart ManagementSystemEasy to install and configure, Perception Fleet delivers instantaneous results upon installation.Continuing its legacy in providing innovative solutions, Perception Fleet is GE’s Online Transformer FleetManagement Software System that provides a revolutionary and holistic approach for transformer fleetassessments for utilities and industrial customers around the globe. Automated, continuously calculated andalways available, fleet transformer conditionrisk rankings and reportingGE’s Perception Fleet is a smart, simplified and standards-based software system that moves customersfrom a manual, one-on-one transformer assessment process to an automated and online fleetmanagement assessment. By evaluating the condition of assets and establishing their risk of failure,Perception Fleet is able to prioritize and rank assets within a fleet.The Perception Fleet software with web browser interface provides customers comprehensivetransformer fleet condition rankings, transformer risk information, and expert analysis on-demand,removing time-consuming and costly manual processes as well as unnecessary maintenance, helpingfocus capital and reduce operational expenses. Integrated Workflow Designer application forcustomizing algorithms to support uniquetransformer insightSimple Diagnostics Web browser interface to critical fleet andtransformer dataKey Benefits Provides a clear strategic view for asset replacement across the entire fleet Built in dashboards with prioritized reportingon critical fleet and transformers “at-a-glance”enabling action plans for rapid response Tracks the fleet risk index over time to show the fluctuations in the fleetscondition as well as the trend of individual transformers Simple setup, simple data acquisition andinstant results Allows for flexible and scalable transformer fleet risk management Broad range and comprehensive suite of DGAdiagnostics toolsTransformer Fleet Replacement StrategyCondition-Based Maintenance Program Provides the insight required to shift from costly time-based maintenance to costeffective and focused condition-based maintenance Reduces ambiguity and the need to speculate regarding budget requirements Reduces OPEX usage on assets to only as requiredAutomated Data Analysis Reduces time required to gather, amalgamate, analyze and interpret transformerdiagnostic data Provides intelligent algorithms to determine each transformer’s condition, andranks the transformers in the fleet based on their risks Reduces the burden on transformer expertise that is rapidly being lostg Automatic, scheduled, real-time conditionassessments and alarms (DGA, moisture,bushing monitoring and partial discharge data)imagination at work Fully interoperable data exchange facility withno predefined formats required Risk and rank evaluation of transformer andOLTC’s using data received from GE onlinetransformer monitors and lab oil propertyanalysis data.Standards-Based Risk calculations built on globally recognizedIEC, IEEE, ASTM, ISO & DIN standards as well asCIGRÉ and EPRI best practices. Increased accuracy with 24/7/365 gas rate-ofchange analysis utilizing Piecewise Linear Rateof Change versus single period of time analysis
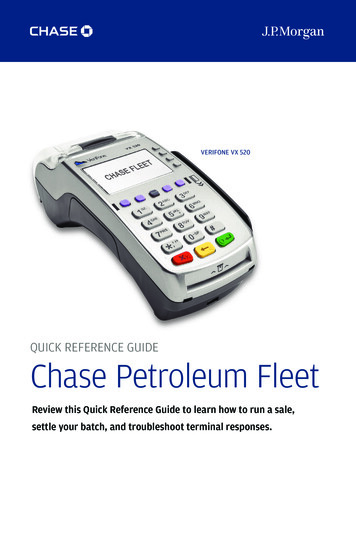
A Smart Transformer Fleet Management SystemPerception Fleet is a smart software solution designed to provide a comprehensive condition evaluation of a transformer fleet. Perception Fleet can analyzeand interpret data in order to determine the risk of a transformer without the need for expert data analysis. Full technical analysis is also instantly available fortransformer technical expert use.This is accomplished by gathering, amalgamating, analyzing and interpreting the data held on transformers utilizing GE’s online monitoring devices and offlinedata. The data is analyzed using intelligent algorithms for condition anomalies and characteristics to determine the transformers risk. Each transformer is thenassigned a risk score, and they are ranked based on their criticality and risk of failure.Automated Fleet Transformer Condition Risk Rankings and ReportingThe built-in data download schedule ensures that Perception Fleet isalways up to date with the latest data collected from the online monitoringdevices. The data is then passed through an automated algorithm enginewhich analyzes the data for specific condition triggers and interprets thetransformers condition and risk of failure based on the trigger points.Perception Fleet uses data from the GE multi gas and single gas as wellas lab oil properties analysis data along with online bushing monitoring todetermine the condition of a transformer.OLTC evaluation is also performed using a specific algorithm that wasdesigned to use data from the Kelman TAPTRANS device.Once the condition of each transformer has been evaluated, the PerceptionFleet software compares the transformers within the fleet and ranks themaccordingly. Providing a ranked view of transformers that are at risk offailure gives an accurate picture of maintenance priority. This deliversvaluable time savings as a majority of organizations currently perform suchevaluations manually which can take weeks of data analysis.RISK INDEX: 1RISK INDEX: 4RISK INDEX: 3RISK INDEX: 1RISK INDEX: 1RISK INDEX: 5RISK INDEX: 4TRANS-DIST-04Perception Fleet’s built-in algorithms incorporatethe data from the monitoring devices and producea Risk Index from 1 to 5.2GEGridSolutions.com
Critical Online Measured CharacteristicsThe intelligence within the algorithms evaluates the data received from GE Digital Energy’s online transformer monitors, focusing on four critical characteristics.Piecewise linear rate of change of gas concentration evaluation based onIEC 60599 and Cigré TB 227 best practices.Bushing power factor, capacitance alarms as well as inter-phaseangle plottingAbsolute gas level concentrations and moisture evaluation based onIEEE C57.104, IEC 60422 and EPRI ratios as well as alarm levels andCigré TB 227 best practices.Partial discharge alarms and PRPD evaluationCritical Offline Oil Property CharacteristicsThe transformer insulation oil properties and quality is also evaluated based on the results receivedfrom labs for manually sampled transformer oil. Perception Fleet’s specific offline oil algorithm usesoil analysis technics outlined by standards, working groups, committees and industry experts toevaluate the condition of the transformer along with GE online monitoring data analysis or whereonline monitoring is not available.Due to the increased and varied level of information provided in lab results Perception Fleet iscapable of evaluating a wealth of information beyond pure DGA, as outlined in the table.The automated import facility enables not only the users but their labs to seamlessly updatePerception Fleet with the latest data for a manual oil sample analysis. Perception Fleet thenperforms an automated analysis and evaluation of the newly imported data without the need forany operator interaction.As well as analysing manually sampled oil data, the offline algorithm can also perform an analysisof oil information from 3rd party online monitors or software applications. The algorithm determinesthe data available in the imported CSV file received from the 3rd party and performs an evaluation.A risk index is then generated for each transformer based on the results of all the analytics.GEGridSolutions.comOIL PROPERTYSTANDARDColor and appearanceBDV, kVH2O, ppmAcidity, mgKOH/gISO 2049, ASTM D1500IEC 60156, ASTM D1816IEC 60814, ASTM D1533IEC 62021 - (1 & 2), ASTMD974, D644IEC 60247, ASTM D924IEC 60247, ASTM D924IEC 60247IEC 60666, ASTM D4768,ASTM D2668IEC 60422 - Annex CASTM D971, EN 14210, ASTMD2285IEC 60666-2010 - Annex BASTM D3487ASTM D5837IEC 62535, ASTM D1275Method A & B, DIN 51353IEC 61619, ASTM D4059Power factor, 90CPower Factor, 25C & 100CResistivity, 20C & 90C, GOhmInhibitor, %Sediment and sludge, %IFT, mN/mPassivatorFurans, ppbCorrosive sulfurPCBs3
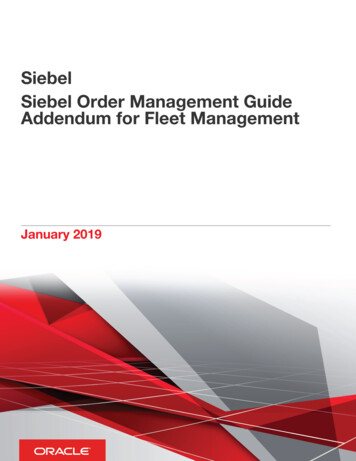
Current Transformer Risk RatingsOnce the risk index for each transformer has been established using the intelligent algorithms, Perception Fleet then analyzes the entire fleet, compares therisk index and risk score of each transformer within the fleet, and then ranks them according to their risk index. The risk index feature provides focus on criticalassets and helps build a condition based maintenance program focusing valuable expenditure. Based on the information provided in the ranking table it ispossible to evaluate which transformers are in potential need of replacing and which require maintenance.The Risk Score and Ranking Graph DashboardIt is expected that several transformers will have the same risk index. Inorder to segregate the transformers even further, Perception Fleet thencalculates the transformers risk score.The risk score is based on an amalgamated value generated by thealgorithms inside Perception Fleet. The risk score allows Perception Fleet todisplay which transformers within the same condition grouping are at thegreatest risk of failing or developing further faults.The ranking graph dashboard simplifies the process of tracking atransformer’s risk and rank within the fleet over time to determine if thetransformer health is degrading or improving and if maintenance actionswere effective.Risk Index04/03/201304/12/20135The risk index ring shows the varying risk indexstages the transformer has been in over a 9 monthperiod, with the current risk index in the center.At the top the ranking history graph displays the transformers ranking position over a 30 day period.A condition statement for each point is displayed on the dashboard when a point is selected on thegraph. The condition statement provides details on the risk and rank evaluation. At the bottom the riskhistory graph displays the transformer risk variation over a period of 30 days.The ranking table shows all the transformers within the fleet color codedand ranked by risk index – from the transformer considered at greatest riskat the top, to the safest at the bottom. Transformers not highlighted witha color in the ranking table are not being risk evaluated.4GEGridSolutions.com
Integrated Workflow DesignerAs transformers may vary greatly from one another due to design orvintage, and/or the organizations best practices may differ from the IEEE/IEC guidelines, Perception Fleet has the built in capability of allowing usersto define their own risk evaluation or simply adjust the sensitivity of thestandard algorithms. The customized algorithms can be as complex orsimple as required by your fleets unique characteristics.The Workflow Designer application allows users to alter and create newintelligent algorithms to be used within Perception Fleet. Customers havethe ability to add custom algorithms to support additional and/or uniquetransformers insight into each transformers unique characteristics.This provides a tailored evaluation on a transformer-by-transformer ortransformer family basis if desired or needed. Creation, modification orassignment of workflows require special permission levels due to its criticalrole for fleet management.The Perception Workflow designer is a decision based flow chart. The userselects which elements of the transformer they want to evaluate within thealgorithm and then provide the decision statements and results.The result of the decision statement can then produce a condition valuebased on analyzed data or can flow into additional decision statementsadding another layer of validation into the algorithm, producing in-depthrisk index evaluation.GE offers the facility to write and develop your custom algorithms for youbased on your unique requirements. For more information please contactyour GE sales representative.Perception Workflow Designer ApplicationAlgorithm workflow evaluation statements and decisionsFully Interoperable Data Exchange FacilityPerception Fleet provides interoperability with other systems through itsfully customizable automatic CSV import/export functionality. It allows dataexchange and integration with other customer’s systems such as SCADA,EMS, DMS, Historian, AM, SAS, planning, ERP, etc. Applications which supportCSV file exchange can easily interface with Perception Fleet, enabling datato be exchanged between applications.The CSV import and export facility can also be used to build the assetstructure and properties in Perception allowing for quick and easyconfiguration of the Perception Fleet asset structure and properties.Seamless automatic data import is achieved by utilizing Perception Fleet’sfilewatcher facility. The software constantly monitors a folder for the arrivalof a new CSV file and automatically imports the contents into its database.Conversely Perception Fleet allows scheduled automatic export of data toCSV files. As well as the scheduled exports, when a scheduled downloadfrom an online monitor occurs, Perception Fleet automatically exports anynew data downloaded to a CSV file.The CSV file exchange facility allows for the import of any data that can becaptured in a CSV file into Perception Fleet, enabling the evaluation andanalysis of additional asset data not captured by GE’s online monitors, as wellas offline and lab oil properties analysis data.Perception Fleet utilizes the OPC UA interface and object model ensuringa secure 128 bit RSA encrypted channel between Perception Fleet and theremote clients. In addition to providing a secure communication channel,OPC UA also provides a secure interface allowing OPC UA compatibleapplications to interface directly with Perception Fleet.GEGridSolutions.com5
Simple Management with Dashboards and DiagnosticsIn a world of intelligent and powerful monitoring devices, customers facethe problem of data overload making it hard for operators and other usersto recognize changes, identify abnormal conditions and react quickly.Perception uses cognitive techniques to build its dashboards for rapidrecognition of any change by utilizing a traffic light approach that empowersusers with at-a-glance recognition of key indicators or important conditionchanges optimizing reaction time.Perception Fleet’s built-in dashboards provide simplified, concise and criticalinformation gathered on individual transformers, as well as a “big picture”overview of the entire transformer fleet in a clean intuitive design. TheDashboards are automatically updated every time new data is available, anevent occurs or a risk assessment is performed on the fleet.By segregating the fleet based on transformer risk, crews can then beassigned to the most critical transformers in the fleet – thus ensuring thetime and material is utilized where it is most needed.Fleet DashboardThe fleet dashboard provides a comprehensive overview of the transformer fleet, highlighting which transformers are being monitored and risk assessed, howmany monitoring devices are experiencing alarms, the overall fleet risk index history and the critical events occurring within the fleet.A “Latest Events” section reportscrucial events as they occur withinthe fleet, highlighting the specifictransformers affected along with thetime, event and location details.The “Top Critical Transformers” listdisplays the transformers at highest riskof developing a serious fault or failing,helping focus maintenance action.The pie chart shows a visualbreakdown of the transformerconditions within the fleet.The “Average Fleet Risk Index History”shows if your fleet is getting healthieror becoming more at risk over time.Device Summary DashboardThe device summary dashboard automatically self-configures to show, the most important data from all available online monitoring devices in a simple andconcise design.The title bar on the dashboardprovides critical risk and rank detail,alarm information, transformer loadand environment information.The center section of the dashboardprovides a snapshot of the latestcritical data including DGAinformation, bushing power factor andcapacitance, partial discharge, windinghot spot details, oil temperature andOLTC temperature and tap position.The gages change color if the valuebreaches the limits set for cautionor alarm and depicts how close themeasured value is to the defined alarmlimits. A miniature chart of TDCG isalso available for quick graphicalvisualization of gas trends.6GEGridSolutions.com
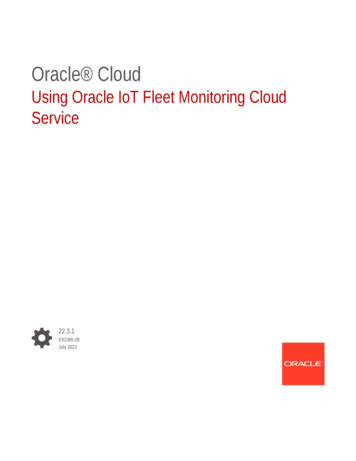
Perception WebPerception Web is a web browser interface for Perception Fleet that provides critical fleet and transformers information via any modern web browser applicationrunning on any platform. By using a web browser to interface with Perception Fleet; Perception Web removes the need to install Perception Desktop therebysimplifying and speeding up the Perception Fleet deployment and rollout process. The information provided via Perception Web is perfect for any user who isinterested in viewing the critical fleet and transformer data.As well as running on a desktop or laptop platform, Perception Web can also be viewed on any Smart Phone or Tablet. The data displays provided by PerceptionWeb are designed to automatically adapt to suit the screen size of the device.Perception Web can be configured to run as an Intranet or Internet service. The Internet configuration allows users to access and browse the Perception Webdata from anywhere on a device with an Internet connection securely. When configured for Intranet access users must be connected to their organizationsnetwork infrastructure directly or via a VPN.Perception Web provides access to the following critical data:Fleet OverviewAsset Hierarchy Summary count of the number of transformers in the fleet, the assetsthat are ranked and the alarms that have been triggered. Risk index distribution of the fleet. Visual representation of the network of areas, substations, transformersand online monitors as preconfigured in Perception Fleet via thePerception Desktop application. Fleet ranking table. Click through on an Area or Substation asset to show associated Wallboard. Latest events list containing details of crucial events that occurs for anasset within the fleet. Click through on transformer asset to show associated Wallboard orTransformer Dashboard. Average fleet risk index history providing a timeline of the overall healthrisk index of the transformer fleet.Transformer DashboardsCritical transformer information, such as current risk index and history,fleet ranking position, alarms, load current and PU percentage, ambientenvironment information and critical measurement data taken by the onlinemonitors.Asset WallboardsArea’s, Substation’s and Transformer’s wallboards as preconfigured inPerception Fleet via the Perception Desktop application.The Transformer Dashboard displays the critical data captured for the transformer.The Fleet Overview provides a comprehensive overview of the transformer fleet.The Wallboard provides a virtual representation of your fleets alarm status.GEGridSolutions.com7
Comprehensive DGA Diagnostics ToolsPerception Fleet provides a broad range and comprehensive suite of DGA diagnostics tools. The diagnostics intelligence built into Perception Fleet providesinternationally recognized industry standard transformer fault diagnostics based on dissolved gas analysis. Transformer experts throughout the world havepublished papers on data interpretation and transformer fault diagnosis methods supported within Perception Fleet. Perception Fleet simplifies the process ofapplying those widely trusted diagnostics methods to your transformer, expediting the process and liberating precious resources in the task of fault identification,intervention and prevention.Duval’s TriangleGas RatioDeveloped by Michel Duval, this diagnostics method compares concentrationsof key gases in transformer oil and presents a probable condition fault.*Classic, LTC, 4 & 5 – Low Temp FaultsEncompasses the IEC 60599 & IEEE C57.104 standards in a 3D rotatablegraph. Rogers and Doernenburg ratio diagnostics are also included in aseparate concise and detailed table.Japanese ETRATransformer ModelsDiagrams A and B compare concentrations of C2H2/C2H4 against C2H4/C2H6, aswell as C2H2/C2H6 against C2H4/C2H6 in order to determine fault conditions.Measurements taken by units with modelling capabilities are convertedinto meaningful information and displayed in the models worksheets.This provides the user with information which ordinary cannot be directlymeasured through sensors.Manual data can be entered enabling simulations on the dynamic loading &apparent power models.8GEGridSolutions.com
Data Retrieval from Online MonitorsPerception Fleet has the ability to connect and download data from the entire range of GE’s Monitoring and Diagnostic devices. The download schedule featurein Perception Fleet facilitates the automatic retrieval of data from GE online monitoring devices, ensuring data is up to date without the need for user interaction.Perception Fleet also allows users to rename stored measurement and data point information. This enables organizations to update and customise PerceptionFleet to follow their own internal naming conventions for data and asset details.DGA monitoring and PD detectionHydran M2, Kelman TRANSFIX, Intellix BMT 330DGA monitoringKelman TAPTRANSBushing monitoringIntellix BMT 330Transformer models including cooling efficiencyIntellix MO 150Standards-Based ManagementPerception Fleet incorporates several internationally recognized standardsfor dissolved gas analysis. These standards are widely considered as thebest in class and are attired to by transformer technical experts throughoutthe world.The algorithms used in Perception Fleet automatically apply data analysistechnics derived from these standards against the dissolved gas datareceived by the GE online monitoring device. By combining these standardsalong with best practice techniques within the algorithms, the softwareis able to calculate the transformers risk index and score. The algorithmassigned to a transformer can also be weighted and its sensitive to theparameters adjusted – these adjustments have has a direct impact on thealgorithm and affects the final risk index and risk score applied to eachtransformer.Perception Fleet’s standards-based algorithmsinclude:EPRI Ratios: Provides details on gas concentration ratio characteristics,used to analyse OLTC insulation oil.ASTM D3487: Specifies properties for new mineral insulating oil of petroleumorigin for use as an insulating and cooling medium in new and existingpower and distribution electrical apparatus.ASTM D4768 & ASTM D2668: Covers the determination of 2,6-ditertiarybutyl para-cresol and 2,6-ditertiary-butyl phenol in new and used insulatingliquids at concentrations up to 0.5 %.EN 14210: Specifies test methods for the determination of interfacial tensionin the range from 4 mN/m to 50 mN/m between two immiscible liquidswhich can also be free from surface active agents. It is particularly suitablefor determining the interfacial tension between water or aqueous solutionsand organic liquids which are immiscible with water.IEC 60156 & ASTM D1816: Specifies the method for determining thedielectric breakdown voltage of insulating liquids at power frequency.IEC 60814 & ASTM D1533: Describes methods for the determination ofwater in insulating liquids and in oil-impregnated cellulosic insulation withcoulometrically generated Karl Fischer reagent.CIGRÉ TB 227: CIGRÉ TB 227 provides five (5)transformer conditions in terms of its reliableoperation. Using this information we are able totailor the standards used within the PerceptionFleet algorithms to determine 5 transformer risk index conditions.IEC 62021-(1 & 2) & ASTM D974 & D664: Describes the procedure for thedetermination of the acidity of unused and used electrical mineral insulating oils.IEEE C57.104: Describes four (4) condition levels for absolute dissolved gasconcentration. To increase accuracy and provide a broader scope, GE rebuiltthe condition limits and set five (5) condition levels using information fromCIGRÉ TB 227. By individually assigning each gas, its condition level limits andtriggers, we factor in the potential risk associated with the concentrations ofcertain gases over others.IEC 60599 (1999): Provides the dissolved gas rate ofchange expectance for normally operating transformers.IEC 60422 (2013): Used to analyze moisture in oil providingthree (3) levels of H2O concentration. To increase accuracyand provide a broader scope, GE rebuilt the condition limits and set four (4)condition levels based on information from CIGRÉ TB 227.IEC 60247 & ASTM D924: Describes methods for the determination of thedielectric dissipation factor (tan δ), relative permittivity and d.c. resistivity ofany insulating liquid material at the test temperature.IEC 60666: Described concern the detection and determination of specifiedadditives in unused and used mineral insulating oils.EC 61198 & ASTM D5837: Specifies test methods for the analysis of2-furfural and related furan compounds resulting from the degradation ofcellulosic insulation and found in mineral insulating oil samples taken fromelectrical equipment.IEC 62535, DIN 51353 & D1275 Method A & B: Specifies a test method fordetection of potentially corrosive sulphur in (both inorganic and organic) usedand unused mineral insulating oil.GEGridSolutions.com9
IEC61619 & ASTM D4059: Specifies a method for the determination ofpolychlorinated biphenyl (PCB) concentration in non-halogenated insulatingliquids by high-resolution capillary column gas chromatography using anelectron capture detector (ECD)ASTM D971 & ASTM D2285: This test method covers the measurement ofthe interfacial tension between mineral oil and water, under non-equilibriumconditions.Piecewise Linear Rate of Change Long rate of change – Observation of defects developing andaccumulating through transformer life (e.g. overheating defects, ageing,some types of discharge activity and general condition deterioration).Dissolved gas rate of change is another key aspect of the algorithms usedin the Perception Fleet ranking. In order to increase the accuracy of the rateof change calculations, GE adopted a piecewise linear approach for the rateof change calculation.This methodology for determining dissolved gas rate of change allows for a24/7/365 gas rate of change analysis above and beyond the conventionalsingle set period-of-time analysis used in online monitoring equipment. Thismethod of calculating dissolved gas rate of change is considered to be morecomprehensive as it can be used to distinguish fault conditions.Piecewise linear rate of change works by using three (3) separate spans oftime, providing the following:Additional FeaturesASTM D1500 & ISO 2049: Specifies a method for the visual determination ofthe color of a variety of petroleum products. Mid rate of change – Observation of seasonal dependent trends, relatedto changes in electrical systems (load etc.) or ambient condition. Short rate of change – Observation of defects which have spurious riseand need to be tracked from a short term perspective (e.g. dischargeof high energy, high temperature overheating which will require urgentaction and investigation).A rate of change value is then calculated for each individual time span. Thealgorithm in Perception Fleet combines these three individual values anddetermines the criticality of a gas rate of change pattern.Transformer ReportsPerception Fleet’s additional features provide visualization of the datacaptured from the monitoring units in a number of ways depending on theusers’ requirements. The intuitive data display options offer a variety of dataviews enabling users to view raw or interpreted data as needed.The naming convention for the data captured in Perception Fleet can also befully customized to suit your organizations own requirements.Expert Analysis and Alarm Notification EmailsEnsuring prompt action is taken when a fault is reported can preventfurther damage and potential catastrophic failures of transformers. TheExpert Analysis Notification email feature in Perception Fleet facilitates suchintervention. By providing a detailed snapshot of the transformers conditionwhen a fault is reported, both the technical advisor and operator are alertedto the alarm at the same time and can remotely analyze the transformerdata. The snapshot contains the critical information required for the advisorto diagnose the fault, react and intervene if necessary.Standard notification emails can also be configured on a per device basis.Designated recipients will receive emails should a monitoring devicetrigger a concentration alarm, rate-of-change alarm, require a service, orif Perception Fleet is unable to communicate with the monitoring device.10Perception Fleet enables users to automatically generate a customizedtransformer overview report. Upon selection, the report creation wizard willguide the user through the report generation process and automaticallypopulate information regarding the transformer status, measurements anddiagnostics. Space for editable text enables the user to comment on theassets, graphs and diagnostics. The report can be further customized byadding a company logo for presentation.GEGridSolutions.com
Visual Fleet OverviewTotal Dissolved Combustible Gases (TDCG)An asset network is built by adding monitoring units using Perception Fleet’sintuitive graphical user interface. The wallboard screen displays the units ina geographical virtual fleet overview, automatically refreshing the status asmeasurements are collected. The network health can be quickly analyzed toidentify problematic units or sites. Wallboard screens can be configured forsites and assets. Perception Fleet’s asset explorer section can then be usedto investigate the unit/site where the alert was raised. The user can selectan asset, view the status of the unit, including the curre
Perception Fleet is a smart software solution designed to provide a comprehensive condition evaluation of a transformer fleet. Perception Fleet can analyze and interpret data in order to determine the risk of a transformer without the need for expert data analysis. Full technical analysis is also instantly available for