Transcription
ANNUALSTATEMENTSTUDIESFINANCIAL RATIO BENCHMARKSVolume I20162019201720202019 RMA FinRatioBenchmarks FRONTMATTER REV3.indd 110/4/19 9:48 AM
2019 RMA FinRatioBenchmarks FRONTMATTER REV3.indd 210/4/19 9:48 AM
RMAAnnual Statement Studies Copyright, Ordering, Licensing, and Use of Data InformationiiiAll of the information contained herein is obtained from sources believed to be accurate and reliable.ALL REPRESENTATIONS CONTAINED HEREIN ARE BELIEVED BY RMA TO BE AS ACCURATE ASTHE DATA AND METHODOLOGIES WILL ALLOW. HOWEVER, BECAUSE OF THE POSSIBILITIES OFHUMAN AND MECHANICAL ERROR, AS WELL AS UNFORESEEN FACTORS BEYOND RMA’SCONTROL, THE INFORMATION IN THIS BOOK IS PROVIDED “AS IS” WITHOUT WARRANTY OF ANYKIND. RMA MAKES NO REPRESENTATIONS OR WARRANTIES EXPRESS OR IMPLIED TO ASUBSCRIBER OR LICENSEE OR ANY OTHER PERSON OR ENTITY AS TO THE ACCURACY,TIMELINESS, COMPLETENESS, MERCHANTABILITY OR FITNESS FOR ANY PARTICULAR PURPOSEOF ANY OF THE INFORMATION CONTAINED IN THIS BOOK. MOREOVER, INFORMATION ISSUPPLIED WITHOUT WARRANTY ON THE UNDERSTANDING THAT ANY PERSON WHO ACTS UPONIT OR OTHERWISE CHANGES POSITION IN RELIANCE THEREON DOES SO ENTIRELY AT SUCHPERSON’S OWN RISK.This Annual Statement Studies book and information is not intended to provide loan advice or recommendations of anykind. The information contained herein is intended for educational, informational, and research purposes only.Accordingly, RMA does not offer any advice regarding the suitability of any loan, of any debtor or of any other businessdetermination related to the information contained in this Annual Statement Studies book. You use this book andinformation at your own risk, and RMA assumes no responsibility or liability for any advice or other guidance that youmay take from this book or the information contained therein. Prior to making any business decisions, you shouldconduct all necessary due diligence as may be appropriate under the circumstances, and RMA assumes no responsibilityor liability for any business decisions, including but not limited to loan decisions, or other services rendered by you basedupon the Statement Studies data or results obtained therefrom.The Annual Statement Studies :Financial Ratio Benchmarks, 2019-2020is a copyrighted product of RMA.All rights reserved.No part of this product may be copied, reproduced, replicated, disseminated, or distributed in any form or by anymeans, electronic or mechanical, without the express written permission of RMA.To obtain permission to copy, quote, reproduce, replicate, disseminate, or distribute the Statement Studies data/material please fax or email a brief letter stating who you are and how you intend to use the Statement Studies datato: Statement Studies Information Products at fax number 215-446-4101 or via email to studies@rmahq.org. Dependingon the requested use, RMA may require a license agreement and royalty fee.A License Agreement is required if you wish to use or incorporate any portion of the data, in whole or in part in otherproducts that will in turn be sold to others, such as in software oriented or derived products, scholarly publications, ortraining materials.To purchase a copy, or additional copies, of the Statement Studies data in book or online format, contact RMA’sCustomer Relations at 1-800-677-7621. Regional data presented in the same fashion as you see in this book is onlyavailable in eStatement Studies.If you have a question regarding the data please reference the detailed explanatory notes provided in the Introductionsection of the enclosed product. If you are unable to find the answer to your question please contact us by e-mail at:studies@rmahq.org. Be sure to include your detailed question along with your telephone number, fax number, and emailaddress.The Risk Management Association1801 Market Street, Suite 300Philadelphia, PA 19103 2019 by RMAISBN# 978-1-57070-352-22019 RMA FinRatioBenchmarks FRONTMATTER REV3.indd 310/4/19 9:48 AM
4ivTABLE OF CONTENTSInformation on Copyright, Ordering, Licensing, and use of Data . . . . . . . . . . . . . . . . . . . . . . . . . . . . . . . . . . iiiList of Participating Institutions . . . . . . . . . . . . . . . . . . . . . . . . . . . . . . . . . . . . . . . . . . . . . . . . . . . . . . . . . . . . viIntroduction to Statement Studies and Organization of Content . . . . . . . . . . . . . . . . . . . . . . . . . . . . . . . . . .viiiDefinition of Ratios . . . . . . . . . . . . . . . . . . . . . . . . . . . . . . . . . . . . . . . . . . . . . . . . . . . . . . . . . . . . . . . . . . . . xExplanation of Noncontractor Balance Sheet and Income Data . . . . . . . . . . . . . . . . . . . . . . . . . . . . . . . . . xixExplanation of Contractor—Percentage-of-Completion Basis of Accounting . . . . . . . . . . . . . . . . . . . . . . . xxIDP Sample Report . . . . . . . . . . . . . . . . . . . . . . . . . . . . . . . . . . . . . . . . . . . . . . . . . . . . . . . . . . . . . . . . . . . .xxiiiNAICS Codes Appearing in the Statement Studies . . . . . . . . . . . . . . . . . . . . . . . . . . . . . . . . . . . . . . . . . . . 27Full Descriptions of Industries Appearing in the Statement Studies . . . . . . . . . . . . . . . . . . . . . . . . . . . . . . 33Agriculture, Forestry, Fishing and Hunting .Mining.Utilities.Construction—General Industries Format* .Manufacturing .Wholesale Trade .Retail Trade .Transportation and Warehousing.Information .Finance and Insurance .Real Estate and Rental and Leasing.Professional, Scientific and Technical Services .Management of Companies and Enterprises.Administrative and Support and Waste Management and RemediationServices .Educational Services .Health Care and Social Assistance .Arts, Entertainment and Recreation .Accommodation and Food Services.Other Services (Except Public Administration) .Public Administration .Construction—Percentage of Completion Basis of Accounting* .DescriptionIndexData SetBegins 14911531155916271655Supplemental Information:Text—Key Word Index of Industries Appearing in the Statement Studies . . . . . . . . . . . . . . . . . . . . . . . . . . . IConstruction Financial Management Association Data . . . . . . . . . . . . . . . . . . . . . . . . . . . . . . . . . . . . . . . . IXRMA’s Credit & Lending Dictionary . . . . . . . . . . . . . . . . . . . . . . . . . . . . . . . . . . . . . . . . . . . . . . . . . . . . . . XIX*General Industries Format means that a valid construction NAICS was assigned to the subject companies contained in the sample;however, the financial statements were prepared using a general or traditional manufacturing or service industries presentation of resultsversus using a percentage-of-completion method of accounting. Industries found in the percentage-of-completion presentation follow thepresentation used by RMA in the past.2019 RMA FinRatioBenchmarks FRONTMATTER REV3.indd 410/4/19 9:48 AM
v4About RMAFounded in 1914, The Risk Management Association is a not-for-profit, member-drivenprofessional association whose sole purpose is to advance the use of sound risk principlesin the financial services industry. RMA promotes an enterprise approach to risk managementthat focuses on credit risk, market risk, and operational risk.Headquartered in Philadelphia, Pennsylvania, RMA has 2,500 institutional members thatinclude banks of all sizes as well as nonbank financial institutions. They are represented inthe association by 18,000 risk management professionals who are chapter members infinancial centers throughout North America, Europe, and Asia/Pacific. Visit RMA on the Webat www.rmahq.org.2019 RMA FinRatioBenchmarks FRONTMATTER REV3.indd 510/4/19 9:48 AM
viRMA ACKNOWLEDGES AND THANKS THE FOLLOWINGINSTITUTIONS, CONTRIBUTORS TO THE 2019 STATEMENT STUDIESDATA SUBMISSION PROGRAM.AlabamaBBVA CompassRegions BankArizonaArizona Bank & TrustFirst Fidelity BankCaliforniaBank of the WestCentral Valley Community BankFarmers and Merchants Bank ofCentral Valley CaliforniaMerchants Bank & TrustMontecito Bank & TrustPinnacle BankPremier Valley BankPresidio BankColoradoCitywide BanksFirst National Bank of OmahaIndependent BankConnecticutDime BankJewett City Savings BankPeoples United BankThe Milford BankFloridaCenterState BankThe Bank of TampaGeorgiaSunTrust Banks, Inc.HawaiiCentral Pacific BankFirst Hawaiian BankIdahoFirst Interstate BankIdaho First BankWashington Trust BankIllinoisDevon BankFirst Midwest BankFirst National Bank of OmahaGlenview State BankIllinois Bank & Trust2019 RMA FinRatioBenchmarks FRONTMATTER REV3.indd 6IndianaFirst Federal Savings BankFirst Financial BankOld National BankIowaDubuque Bank & TrustFarmers State BankKansasBank of Blue ValleyConway Bank NAEmprise BankFirst National Bank of OmahaINTRUST Bank, N.A.KentuckyCentral Bank & Trust Co.Community Trust Bank, Inc.LouisianaBusiness First BankWhitney BankMaineBangor Savings BankFirst National BankKennebunk SavingsMarylandHarford BankThe Bank of Glen BurnieMassachusettsBrookline BancorpEastern BankFall River Five dba BankFivePittsfield Cooperative BankSantander Bank, N.A.MichiganChemical Bank a division ofTCF National BankComerica BankCommercial BankFirst National Bank of MichiganFirst State BankHuron Community BankMinnesotaBankCherokeeBlackRidgeBANKBremer Bank, National AssociationCitizens Independent BankCommunity Resource BankFidelity BankFirst Minnetonka City BankMinnesota Bank & TrustMinnwest BankNorth Star BankStearns Bank N.A.MississippiBancorpSouthHancock BankThe Peoples BankTrustmark National BankMissouriAcademy Bank, N.A.Cass Commercial BankCentral BancompanyCommerce Bank NARoyal Banks of MissouriMontanaFirst Interstate BankRocky Mountain BankNebraskaFirst National Bank of OmahaMutual of Omaha BankUnion Bank and Trust CompanyNew JerseyPeapack-Gladstone BankTD Bank, N.A.New MexicoNew Mexico Bank & TrustNew YorkCanandaigua National Bank & TrustCIT GroupCommunity Bank, NALake Shore Savings BankM&T BankNBT Bank, N.A.Steuben Trust CompanyTompkins Trust Company10/4/19 9:48 AM
viiNorth CarolinaBB&TTowneBankTennesseeFirst Tennessee Bank, N.A.Pinnacle BankNorth DakotaBell BankBlackRidgeBANKTexasAmerican Bank, N.A.American National Bank of TexasComerica BankExtraco Banks, N.A.First Bank & TrustFirst United Bank & Trust CoFrost BankIndependent BankTexas Capital BankWoodforest National BankOhioFirst Financial BankHuntington National BankOklahomaFirst Fidelity BankFirst United Bank & Trust CoOregonFirst Interstate BankPeople’s Bank of CommerceWashington Trust BankPennsylvania1st Summit BankCommunity BankFirst Columbia Bank & Trust Co.First Commonwealth BankFirstrust BankFulton BankGemino Healthcare Finance, LLCKish BankOrrstown BankPeoplesBank, a CodorusValley CompanyQNB BankRepublic BankS&T BankSomerset Trust CompanyWashington Financial BankPuerto RicoOriental BankRhode IslandCitizens Financial GroupSouth DakotaFirst Interstate BankFirst PREMIER BankThe First National Bank inSioux Falls2019 RMA FinRatioBenchmarks FRONTMATTER REV3.indd 7WisconsinAssociated Bank N.A.Bank of Sun PrairieFirst Bank Financial CentreFirst National Bank andTrust CompanyHoricon BankJohnson BankState Bank FinancialWisconsin Bank & TrustWyomingFirst Interstate BankUtahCache Valley BankZions BancorporationVermontCommunity National BankMascoma BankNational Bank of MiddleburyThe Bank of BenningtonThe Brattleboro Savings andLoan AssociationUnion BankVirginiaFirst Community BankSonabankTowneBankUnited Bankshares, Inc.WashingtonColumbia BankFirst Interstate BankHomeStreet BankMountain Pacific BankNorthwest Farm Credit ServicesWashington Trust BankWest VirginiaUnited Bankshares, Inc.WesBanco Bank, Inc.10/4/19 9:48 AM
viiiIntroduction to Annual Statement Studies: Financial Ratio Benchmarks,2019-2020 and General Organization of ContentThe notes below will explain the presentation of Annual Statement Studies: Financial Ratio Benchmarks, describehow the book is organized, and answer most of your questions.The Quality You Expect from RMA: RMA is the most respected source of objective, unbiased information on issuesof importance to credit risk professionals. In its 100th year, RMA’s Annual Statement Studies has been the industrystandard for comparison financial data. Material contained in today’s Annual Statement Studies was first published inthe March 1919 issue of the Federal Reserve Bulletin. In the days before computers, the Annual Statement Studiesdata was recorded in pencil on yellow ledger paper! Today, it features data for over 781 industries derived directlyfrom more than 260,000 statements of financial institutions’ borrowers and prospects. Data That Comes Straight from Original Sources: The more than 260,000 statements used to produce thecomposites presented here come directly from RMA member institutions and represent the financials from theircommercial customers and prospects. RMA does not know the names of the individual entities. In fact, to ensureconfidentiality, company names are removed before the data is even delivered to RMA. The raw data making upeach composite is not available to any third party. Data Presented in Common Size: Annual Statement Studies: Financial Ratio Benchmarks contains compositefinancial data. Balance sheet and income statement information is shown in common size format, with each itema percentage of total assets and sales. RMA computes common size statements for each individual statement inan industry group, then aggregates and averages all the figures. In some cases, because of computer rounding,the figures to the right of the decimal point do not balance exactly with the totals shown. A minus sign beside thevalue indicates credits and losses. Includes the Most Widely Used Ratios: Nineteen of the most widely used ratios in the financial servicesindustry accompany the balance sheet information, including various types of liquidity, coverage, leverage, andoperating ratios. Organized by the NAICS for Ease of Use: This edition is organized according to the 2017 North AmericanIndustry Classification System (NAICS), a product of the U.S. Office of Management and Budget. At the topof each page of data, you will find the NAICS. Please note, in the revised 2017 catalog some industries weremerged to create its new 2017 NAICS. In these instances, RMA recalculated aggregate historical reporting. Fordetailed 2017 and 2012 NAICS mapping, please visit the RMA site or: http://www.census.gov/eos/www/naics/ Twenty Sections Outline Major Types of Businesses: To provide further delineation, the book is dividedinto 20 sections outlining major lines of businesses. If you know the NAICS number you are looking for, usethe NAICS-page guide provided in the front of this book. In general, the book is arranged in ascending NAICSnumerical order. For your convenience, full descriptions of each NAICS are presented in this book. In addition,you will find a text-based index near the end of the book. If You Do Not Know the NAICS Code You Are Looking for If you do not know the precise industry NAICSyou are looking for, contact the Census Bureau at 1-888-75NAICS or naics@census.gov. Describe the activity ofthe establishment for which you need an industry code and you will receive a reply. Another source to help youassign the correct NAICS industry name and number can be found at www.census.gov/epcd/www/naics.html. Can’t Find the Industry You Want? There are a number of reasons you may not find the industry you arelooking for (i.e., you know you need industry xxxxxx but it is not in the product). Many times we have informationon an industry, but it is not published because the sample size was too small or there were significant questionsconcerning the data. (For an industry to be displayed in the Annual Statement Studies: Financial RatioBenchmarks, there must be at least 30 valid statements submitted to RMA.) In other instances, we simply do nothave the data. Generally, most of what we receive is published. Composite Data Not Shown? When there are fewer than 10 financial statements in a particular asset or salessize category, the composite data is not shown because a sample this small is not considered representative andcould be misleading. However, all the data for that industry is shown in the All Sizes column. The total numberof statements for each size category is shown in bold print at the top of each column. In addition, the number ofstatements used in a ratio array will differ from the number of statements in a sample because certain elementsof data may not be present in all financial statements. In these cases, the number of statements used is shownin parentheses to the left of the array.2019 RMA FinRatioBenchmarks FRONTMATTER REV3.indd 810/4/19 9:48 AM
ix Presentation of the Data on Each Page-Spread: For all non-contracting spread statements, the data for aparticular industry appears on both the left and right pages. The heading Current Data Sorted by Assets is inthe five columns on the left side. The center section of the double-page presentation contains the ComparativeHistorical Data, with the All Sizes column for the current year shown under the heading 4/1/18-3/31/19.Comparable data from past editions of the Annual Statement Studies: Financial Ratio Benchmarks also appearsin this section. Current Data Sorted by Sales is displayed in the five columns to the far right. Companies with Less than 250 Million in Total Assets: In our presentation, we used companies havingless than 250 million in total assets—except in the case of contractors who use the percentage-of-completionmethod of accounting. The section for contractors using the percentage-of-completion method of accountingcontains data only sorted by revenue. There is no upper limit placed on revenue size for any industry. Itsinformation is found on only one page. Page Headers: The information shown at the top of each page includes the following: 1) the identity of theindustry group; 2) its North American Industry Classification System (NAICS); 3) a breakdown by size categoriesof the types of financial statements reported; 4) the number of statements in each category; 5) the dates of thestatements used; and 6) the size categories. For instance, 16 (4/1-9/30/18) means that 16 statements with fiscaldates between April 1 and September 30, 2018, make up part of the sample. Page Footers: At the bottom of each page, we have included the sum of the sales (or revenues) and total assetsfor all the financial statements in each size category. This data allows recasting of the common size statementsinto dollar amounts. To do this, divide the number at the bottom of the page by the number of statements inthat size category. Then multiply the result by the percentages in the common size statement. Please note:The dollar amounts will be an approximation because RMA computes the balance sheet and income statementpercentages for each individual statement in an industry group, then aggregates and averages all the figures. Our Thanks to CFMA: RMA appreciates the cooperation of the Construction Financial Management Associationin permitting us to reproduce excerpts from its Construction Industry Annual Financial Survey. This datacomplements the RMA contractor industry data. For more details on this data, please visit www.cfma.org. Recommended for Use as General Guidelines: RMA recommends you use Annual Statement Studies:Financial Ratio Benchmarks data only as general guidelines and not as absolute industry norms. There areseveral reasons why the data may not be fully representative of a given industry:1. Data Not Random — The financial statements used in the Annual Statement Studies: Financial RatioBenchmarks are not selected by any random or statistically reliable method. RMA member banks voluntarilysubmit the raw data they have available each year with no limitation on company size.2. Categorized by Primary Product Only — Many companies have varied product lines; however, the AnnualStatement Studies: Financial Ratio Benchmarks categorizes them by their primary product NAICS numberonly.3. Small Samples — Some of the industry samples are small in relation to the total number of firms for a givenindustry. A relatively small sample can increase the chances that some composites do not fully represent anindustry.4. Extreme Statements — An extreme or outlier statement can occasionally be present in a sample, causinga disproportionate influence on the industry composite. This is particularly true in a relatively small sample.5. Operational Differences — Companies within the same industry may differ in their method of operations,which in turn can directly influence their financial statements. Since they are included in the sample, thesestatements can significantly affect the composite calculations.6. Additional Considerations — There are other considerations that can result in variations among differentcompanies engaged in the same general line of business. These include different labor markets, geographicallocation, different accounting methods, quality of products handled, sources and methods of financing, andterms of sale. For these reasons, RMA does not recommend using the Annual Statement Studies: Financial RatioBenchmarks figures as absolute norms for a given industry. Rather, you should use the figures only asgeneral guidelines and as a supplement to the other methods of financial analysis. RMA makes no claimregarding how representative the figures printed in this book are.2019 RMA FinRatioBenchmarks FRONTMATTER REV3.indd 910/4/19 9:48 AM
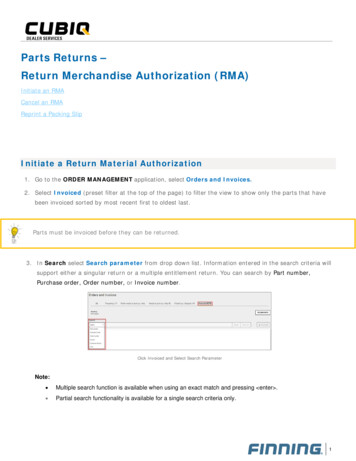
10xDEFINITIONRATIOSDEFINITION OF OFRATIOSIntroductionIntroductionOn eachdatadatapage,belowthe ormation,youwillfindOn eachpage,belowcommon finda aseriesseriesof ratioscomputedfromfromthe financialstatementdata.data.of ratioscomputedthe financialstatementHereHereis howthesefiguresare calculatedfor anyratio:ratio:is howthesefiguresare calculatedfor givenany given1. isTheratio is computedfor eachstatementfinancial statementin the sample.1. The ratiocomputedfor each financialin the sample.2. These values are arrayed (listed) in an order from the strongest to the weakest. In interpreting ratios, the2. These valuesare arrayedin notan alwaysorder thefromlargestthe strongestthe norweakest.In interpretingratios,the“strongest”or “best”(listed)value isnumericaltovalue,is the “weakest”alwaysthe lowest“strongest”numericalor “best” value.value isnotcertainalwaysratios,the largestnumericalvalue,opinionsnor is thealways thelowest ornumeri(Forthere maybe differingas“weakest”to what constitutesa stronga weakcal value. value.(For certainratios, generalthere maybe differingopinionsas to whatconstitutesstrong ora weak thisvalue.RMARMA followsbankingguidelinesconsistentwith soundcreditapracticeto resolveproblem.)follows general banking guidelines consistent with sound credit practice to resolve this problem.)3. The array of values is divided into four groups of equal size. The description of each ratio appearing in theprovidesdetailsregardingthe arrayingof thevalues. of each ratio appearing in the3. The arrayStatementof values Studiesis dividedinto fourgroupsof equalsize. ThedescriptionStatement Studies provides details regarding the arraying of the values.What Are Quartiles?WhatAre ratioQuartiles?Eachhas three points, or “cutoff values,” that divide an array of values into four equal-sized groups calledEachquartiles,ratio hasasthreepoints,or “cut-offvalues,”that dividean arrayof valuesinto fourquartile,equal-sizedgroups calledquarshownbelow.The quartilesincludethe tiles,theas lowershownquartile.below. TheThe quartile,lower-middlequartile,andquartile is the cutoff value where one-quarter of the array of ratios falls between ittheandlowerthequartile.Theratio.upperquartileis isthecut-offvalue whereone-quarterof thearraywhereof ratiosbetweenit andthe itstrongestThemedianthemidpoint—thatis, themiddle cutoffvaluehalf fallsof thearray lsaboveitandand half below it. The lower quartile is the point where one-quarter of the array falls between it and the weakest ratio.half Inbelowit.cases,The lowerquartile ofis twothe pointone-quarterthequartilearray fallsbetweenandthethemedianweakestratio.Inmanythe averagevalueswhereis usedto arrive atofthevalue.You edianandquartilevalues on all Statement Studies data pages in the order indicated in the chart below.values on all Statement Studies data pages in the order indicated in the chart below.StrongRatios25% ofratiosUpper QuartileExample of Current dian— *Upper25% ofratiosUpper MiddleQuartileMedian— *25% ofratiosLower MiddleQuartileMedian— *Lower25% ofratiosLower QuartileWeakRatiosWhy Use Medians/Quartiles Instead of the Average?WhyMedians/QuartilesInsteadof the Average?ThereareUseseveralreasons mediansand quartilesare used instead of an average. Medians and quartiles eliminatethe influence an “outlier” (an extremely high or low value compared to the rest of the values). They also more accuTherewhy mediansand quartilesaremethodused insteadratelyreflectaretheseveralranges reasonsof ratio valuesthan a straightaveragingwould. of an average. Medians and quartileseliminate the influence of an “outlier” (an extremely high or low value compared to the rest of the values). They alsoaccuratelyreflect thethatrangesof ratio (range)values thana straightaveragingwould. represents the middleIt is moreimportantto understandthe spreadbetweenthe upperand methodlower quartiles50% of all the companies in a sample. Therefore, ratio values greater than the upper quartile or less than the lowerIt is important to understand that the spread (range) between the upper and lower quartiles represents the middlequartile may begin to approach “unusual” values.50% of all the companies in a sample. Therefore, ratio values greater than the upper quartile or less than the lowerquartile may begin to approach “unusual” values.2019 RMA FinRatioBenchmarks FRONTMATTER REV3.indd 1010/4/19 9:48 AM
xiNonconventional Values:For some ratio values, you will occasionally see an entry that is other than a conventional number. These entries aredefined as follows:(1) UND — This stands for “undefined,” the result of the denominator in a ratio calculation approaching zero.(2) NM — This may occasionally appear as a quartile or median for the ratios sales/working capital, debt/worth, andfixed/worth. It stands for “no meaning” in cases where the dispersion is so small that any interpretation is meaningless.(3) 999.8 — When a ratio value equals 1,000 or more, it also becomes an “unusual” value and is given the “999.8”designation. This is considered to be a close enough approximation to the actual unusually large value.Linear versus Nonlinear Ratios:An array that is ordered in ascending sequence or in descending sequence is linear. An array that deviates fromtrue ascending or true descending when its values change from positive to negative (low to high positive, followedby high to low negative) is non-linear.A specific example of a nonlinear ratio would be the Sales/Working Capital ratio. In other words, when the Sales/Working Capital ratio is positive, then the top quartile would be represented by the lowest positive ratio. However, if theratio is negative, the top quartile will be represented by the highest negative ratio! In a nonlinear array such as this, themedian could be either positive or negative because it is whatever the middle value is in the particular array of numbers.Nonlinear RatiosSales/Working CapitalFixed/WorthDebt/WorthLinear RatiosCurrent RatioQuick RatioSales ReceivablesDays’ ReceivablesCost of Sales/InventoryDays’ InventoryCost of Sales/PayablesDays’ PayablesEBIT/InterestNet Profit Deprec, Depletion, Amort/Current Maturities Long-Term Debt% Profits Before Taxes/Tangible Net Worth% Profits Before Taxes/Total AssetsSales/Net Fixed AssetsSales/Total Assets% Depreciation, Depletion, Amortization/Sales% Offic
FINANCIAL RATIO BENCHMARKS 2019 2020 ANNUAL STATEMENT STUDIES FINANCIAL RATIO BENCHMARKS 2016 2017 Volume I 2019 RMA FinRatioBenchmarks_FRONTMATTER_REV3.indd 1 10/4/19 9:48 AM. 2019 RMA FinRatioBenchmarks_FRONTMATTER_REV3.indd 2 10/4/19 9:48 AM. RMA iii Annual Statement Studies