Transcription
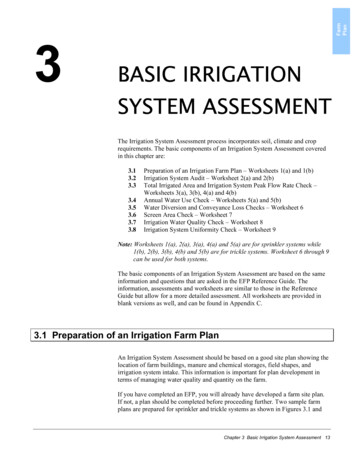
3.43.53.63.73.8Preparation of an Irrigation Farm Plan – Worksheets 1(a) and 1(b)Irrigation System Audit – Worksheet 2(a) and 2(b)Total Irrigated Area and Irrigation System Peak Flow Rate Check –Worksheets 3(a), 3(b), 4(a) and 4(b)Annual Water Use Check – Worksheets 5(a) and 5(b)Water Diversion and Conveyance Loss Checks – Worksheet 6Screen Area Check – Worksheet 7Irrigation Water Quality Check – Worksheet 8Irrigation System Uniformity Check – Worksheet 9Note: Worksheets 1(a), 2(a), 3(a), 4(a) and 5(a) are for sprinkler systems while1(b), 2(b), 3(b), 4(b) and 5(b) are for trickle systems. Worksheet 6 through 9can be used for both systems.The basic components of an Irrigation System Assessment are based on the sameinformation and questions that are asked in the EFP Reference Guide. Theinformation, assessments and worksheets are similar to those in the ReferenceGuide but allow for a more detailed assessment. All worksheets are provided inblank versions as well, and can be found in Appendix C.IrrigatedAreaPeakFlow RateWaterQuality3.1 Preparation of an Irrigation Farm PlanSystemAuditFarmPlan3.13.23.3AnnualWater UseThe Irrigation System Assessment process incorporates soil, climate and croprequirements. The basic components of an Irrigation System Assessment coveredin this chapter are:Water Diversion &Conveyance LossSYSTEM ASSESSMENTScreenAreaBASIC IRRIGATIONAn Irrigation System Assessment should be based on a good site plan showing thelocation of farm buildings, manure and chemical storages, field shapes, andirrigation system intake. This information is important for plan development interms of managing water quality and quantity on the farm.If you have completed an EFP, you will already have developed a farm site plan.If not, a plan should be completed before proceeding further. Two sample farmplans are prepared for sprinkler and trickle systems as shown in Figures 3.1 andChapter 3 Basic Irrigation System Assessment 13DistributionUniformity3
FarmPlanSystemAuditAssessment 3.1 Irrigation Farm PlanIrrigatedArea3.2. Refer to Assessment 3.1 for obtaining a list of information from the plans tobe used in irrigation worksheets throughout this chapter.InformationWorksheet 1(a) – SprinklerWorksheet 1(b) – Trickle Farm site information. Farm plan that includes the irrigation design information and layout. An irrigation plan may be a separateplan from the farm site plan. Irrigation system supplier. Water licences pertaining to the farm. Water purveyor information if water is obtained from a purveyor. Pump name and pump curve if a pump is used. B.C. Hydro bill if a pump is used.Follow Examples 3.1 (sprinkler system in Armstrong) and 3.2 (trickle system in Kelowna) to identify theinformation necessary to complete the rest of the worksheets in this chapter. Some of the information will beobtained from the farm plan while others from field or equipment measurements. Not all of the information will beused in the worksheets but they will help in performing a better assessment of your ater Diversion &Conveyance LossAnnualWater UsePeakFlow RateThe basic information required to complete an irrigation assessment can be determined from:14Irrigation System Assessment Guide
Chapter 3 Basic Irrigation System Assessment r Diversion &Conveyance LossAnnualWater UsePeakFlow RateIrrigatedAreaSystemAuditFarmPlan
FarmPlanSystemAuditExample 3.1 Farm Plan for a Sprinkler Irrigation System in ArmstrongWorksheet 1(a) Information from Farm Plan – SPRINKLERINFORMATIONValue and Box No.IrrigatedAreaWorksheet 3(a) Total Irrigated Area Using System InformationIrrigation interval per pass . .Irrigation sets per day . . . .Sprinkler spacing . . .Number of sprinklers . . . .Distance moved per set . . .PeakFlow RateWorksheet 3(b) Total Irrigated Area Using Field DimensionField width . . .Field length . . . UnitSource12345days/passsetsftsprinklersftFarm infoFarm infoFarm infoFarm infoFarm info–12ftftFarm infoFarm info–2US gpmWaterlicence orpurveyor0.215.0–3in/dUS gpm/acreTable 2.1Table 2.2 or2.3–5US gpmMeter ordistrictST007–––6in Dia.rpmUS gpm107––78in x inpsiUS gpmnozzlesField checkField checkFarm planFarm plan2622ac-ftWaterlicence1234in%Table 2.4Table 3.267US galUS galWaterpurveyor152403060–Worksheet 4(a) Irrigation System Peak Flow Rate CheckAnnualWater UseCalculated Irrigation System Peak Flow RatePeak flow rate on water licence or provided byirrigation district or water purveyor . . .ArmstrongPeak evapotranspiration (ET) inEstimated peak flow rate requirement per acre .Water Diversion &Conveyance LossActual Irrigation System Flow RateFlow rate metered or provided by district .Pump Specifications:Model number Impellor size .Revolution per minute (rpm) Flow rate .WaterQualityScreenAreaNozzle Specifications:Size .Operating pressure .Flow rate Number of nozzles 15 – 7/322,20085011/64 x 3/32508.0Field checkPumpname platePump curveWorksheet 5(a) Annual Water Use CheckDistributionUniformityCalculated Annual Water Use RequirementAnnual water withdrawal stated on water licence Estimated annual crop water requirement Application efficiency of irrigation system .Meter InformationMeter reading at start of year .Meter reading at end of year .16Irrigation System Assessment Guide72––
FarmPlanHydro bill1617daysFarm planFarm plan1234US gpmUS gpmdaysac-ftSiteSiteSiteWaterlicence8205US gpmSite8x823mesh%SiteTable /100 mlcfu/100 mlLaboratoryTable 3.5LaboratoryLaboratory4Worksheet 6 Water Diversion and Conveyance Loss ChecksConveyance channel flow rate at/near diversion .1,000Overflow in channel50Number of operating days per season .80Amount of water licensed 300Conveyance channel flow rate at/near intake .Worksheet 7 Intake Screen Area CheckScreen mesh size .Percent open area of mesh size .For flat screen,Number of screened surfaces .Length of screen Width of screen .For cylindrical screen,Diameter of screen Length of screen Worksheet 8 Irrigation Water Quality CheckSodium adsorption ratio (SAR) .Electrical conductivity (EC) of water .E. coli count Fecal coliform count UniformityIrrigation SpecificationsIrrigation interval Number of irrigations per year SystemAuditKWhIrrigatedArea10Energy consumption for entire year .140,337Refer to Worksheet 4(a) for the rest of the information regarding pumpPeakFlow RatePumpname plateAnnualWater UsehpWater Diversion &Conveyance Loss9125ScreenAreaPump SpecificationsPump horsepower .Chapter 3 Basic Irrigation System Assessment 17
18Irrigation System Assessment ater Diversion &Conveyance LossAnnualWater UsePeakFlow RateIrrigatedAreaSystemAuditFarmPlan
Value and Box No.FarmPlanUnitSourceWorksheet 3(b) Total Irrigated Area1,03012ftftFarm info.Farm info.–2US gpmWaterlicence orpurveyor0.246.0–3in/dUS gpm/acreTable 2.1Table 2.2 or2.3–5US gpmMeter ordistrict––––6rpmUS gpm756––78in I.D.psigphemittersField checkField checkFarm planFarm plan–2ac-ftWaterlicence12345in%Table 2.4Table 3.3Table 3.2Worksheet 4(b) Irrigation System Peak Flow Rate CheckCalculated Irrigation System Peak Flow RatePeak flow rate on water licence or provided byirrigation district or water purveyor . .Peak evapotranspiration (ET) in .KelownaEstimated peak flow rate requirement per acre .Actual Irrigation System Flow RateFlow rate metered or provided by district .Pump Specifications:Model number Impellor size . Revolution per minute (rpm) . .Flow rate .Emitter Specifications:Size . . .Operating pressure . .Flow rate (zone 4) . . .Number of emitters (zone 4) –––5/885.7Field checkPumpname platePump curvePeakFlow RateIrrigatedArea465AnnualWater UseField width . .Field length . .Water Diversion &Conveyance LossINFORMATIONSystemAuditExample 3.2 Farm Plan for a Trickle Irrigation System in KelownaWorksheet 1(b) Information from Farm Plan – TRICKLE1.092Meter InformationMeter reading at start of year .Meter reading at end of year .12,116,40067US galUS galWaterpurveyorPump SpecificationsPump horsepower .–10hpPumpname plate11KWhHydro bill5,290,500Energy consumption for entire year .–Refer to Worksheet 4(b) for the rest of the information regarding pumpChapter 3 Basic Irrigation System Assessment 19WaterQualityEstimated annual crop water requirement Crop adjustment factorApplication efficiency of irrigation system .DistributionUniformityCalculated Annual Water Use RequirementWater withdrawal amount on water licence .ScreenAreaWorksheet 5(b) Annual Water Use Check
FarmPlanSystemAuditIrrigation Specifications (based on emitter specifications)Number of zones .Operating hours per zone per day .Number of operating days per year 171819zoneshr/zone/ddaysFarm planFarm planFarm plan–1234US gpmUS gpmdaysac-ftSiteSiteSiteWaterlicenceConveyance channel flow rate at/near intake .–5US gpmSiteWorksheet 7 Intake Screen Area CheckScreen mesh size .Percent open area of mesh size .–23mesh%SiteTable /100 mlcfu/100 mlLaboratoryTable 3.5LaboratoryLaboratoryPeakFlow RateIrrigatedAreaWorksheet 6 Water Diversion and Conveyance Loss ChecksConveyance channel flow rate at/near diversion .Overflow in channelNumber of operating days per season .Amount of water licensed AnnualWater UseFor flat screen,Number of screened surfaces .Length of screen Width of screen .Water Diversion &Conveyance LossFor cylindrical screen,Diameter of screen Length of screen eet 8 Irrigation Water Quality CheckAdjusted sodium adsorption ratio (SARadj) Electrical conductivity (EC) of water .E. coli count Fecal coliform count .20Irrigation System Assessment �
Guidance on how to conduct a system audit for a sprinkler and a trickle/dripirrigation systems are outlined in Table 3.1 below.SystemAuditFarmPlanIn some case, the audit will identify areas of improvement that may not be easy torectify. These should be noted and revisited if the checks indicate that the systemperformance is not acceptable. Expertise such as a Certified Irrigation Designer(CID) may be required to correct some of the problems. The B.C. IrrigationManagement Guide can be used to determine what actions may need to be taken.In some cases, a redesign of the system may be necessary.IrrigatedAreaAn irrigation system assessment includes an evaluation of the irrigation systemperformance by conducting a simple audit of the irrigation system. An irrigationsystem audit should be done and all possible corrective actions identified takenprior to the peak flow and annual water use checks in this Guide are done. Theintent is to make the system work as efficiently as possible so that the checks canidentify whether additional corrective actions are required.PeakFlow Rate3.2 Irrigation System AuditCheck that all sprinklers are of the same model. Ensurethat all sprinklers rotate uniformly and at least twice perminute.2.Check that all nozzles have the same size.3.Check that all sprinkler and lateral spacing is uniform.Check sprinkler head and lateral line spacing to makesure they do not exceed 60% of the sprinkler wetteddiameter. Preferable sprinkler spacing is 50% of thewetted diameter.4.Operating pressure at the beginning of the zone shouldbe within the best operating range for the nozzles beingused.5.Check the operating pressure at the first and lastsprinklers on the lateral with a pressure gauge. Thepressure differential between the first and last sprinklerwithin a zone should be as minimal as possible, butshould not exceed 20%.For each zone,1.Check that all emitters are of the same modelthroughout the entire zone.2.Check that all emitter have the same size throughoutthe zone.3.Check that emitter spacing is uniform throughout thezone.4.Check the operating pressure at the beginning andend of the zone with a pressure gauge. The pressuredifferential between the beginning and end within azone should be as minimal as possible, but shouldnot exceed 10% unless pressure compensatingemitters are used.5.If possible each zone should be irrigating the samecrop and the same plant size.6.Ensure that each zone has a uniform soil type.WaterQuality1.DistributionUniformityFor each zone,Trickle/Drip System AuditWater Diversion &Conveyance LossSprinkler System AuditScreenAreaTable 3.1 Irrigation System Audit ChecklistAnnualWater UseB.C. Irrigation Management GuideChapter 3 Basic Irrigation System Assessment 21
FarmPlanExample 3.3 Sprinkler Irrigation System Checklist in Armstrong (I)Worksheet 2(a) Irrigation System Audit – SPRINKLERSystemAuditQuestion:Do the system conditions meet all the minimum standards?Checklist:Yes1. Are all sprinklers of the same model? . .99IrrigatedArea2. Are all nozzles of the same size? .PeakFlow RateNo3. Are all sprinkler and lateral spacing uniform (50 – 60% wetteddiameter)? .94. Is the operating pressure in the best range? 95. Is pressure differential minimal? . .9Answer:Do the system conditions meet all the minimum standards?AnnualWater Use9Yes- OKNo- See action items.Example 3.4 Trickle Irrigation System Checklist in Kelowna (I)Worksheet 2(b) Irrigation System Audit – TRICKLEWater Diversion &Conveyance LossQuestion:Do the system conditions meet all the minimum standards?Checklist:YesScreenAreaFor each zone,1. Are all emitters of the same model throughout the zone? .92. Are all emitters of the same size throughout the zone? .93. Are all emitter spacing uniform throughout the zone? .94. Is pressure differential minimal? . .95. Is the same crop or same plant size grown in the zone? .96. Is the soil type uniform throughout the zone? . .9Answer:WaterQualityDo the system conditions meet all the minimum standards?DistributionUniformity922Irrigation System Assessment GuideYes- OKNo- See action items.No
FarmPlanActions for Worksheets 2(a) and 2(b) – Irrigation System Audit9 Replace nozzles if they are not of the same size as the original system design.9 Install flow control nozzles if the lateral has a significant elevation difference between the first andlast sprinkler.SystemAuditNozzle/Emitter:9 Replace nozzles that are worn out.not uniform.9 For wheelline and hand line systems, spacing can be adjusted by offsetting lateral settings everyother irrigation.Operating Pressure:9 Where excessive pressure losses are due to elevation, flow control nozzles should be used forsprinkler systems and pressure-compensating emitters for trickle systems.9 If excessive pressure losses occur due to friction, consider using larger lateral pipe sizes in criticalPeakFlow Rate9 Although difficult in some instances, consider adjusting sprinkler spacing if the spacing is too big orIrrigatedAreaSpacing:Others:9 If more than one crop or more than one plant size is grown in a zone, consider dividing the zoneinto smaller areas.9 If there is more than one predominant soil type within a zone, consider dividing the zone intoAnnualWater Usesections or decrease sprinkler/emitter flow to reduce pressure losses for both sprinkler and tricklesystems.If the problem cannot be solved, refer to the B.C. Irrigation Management Guide.B.C. Irrigation Management GuideCase Study 3.1 Irrigation System Audit in Armstrong – SPRINKLERWater Diversion &Conveyance Losssmaller areas to accommodate soil changes.Purchase new nozzles and replace all nozzles on the system with the correct size as stated on the originalirrigation plan.Chapter 3 Basic Irrigation System Assessment 23WaterQualityAction:DistributionUniformityUsing Example 3.3, the farmer in Armstrong noticed that some parts of his field puddle and some spots were dryunder the same irrigation schedule. All lines of the wheelline system were checked but no leaks were found. Allsprinklers were checked and were found to be of the same model. The system design indicated that all nozzlesshould be 3/8 inch. A visual observation of the system operation found that some of the nozzles were partially orfully clogged causing lower or no flow. With a 3/8-inch drill bit, the nozzle openings were checked and 30% of thenozzles were found to have worn out causing a higher flow than what the system was designed for in the firstplace. Some of the nozzles had also been replaced with a different size over the years.ScreenAreaScenario:
The irrigation system should be designed and operated so that the peak flow ratemeets the climate, crop and soil requirements. Some irrigation licences may state apeak flow or withdrawal rate. A basic irrigation system assessment should checkthe actual irrigation system flow rate against the calculated peak flow rate requiredfor the region.Î Example 3.7 for sprinkler systemsÎ Example 3.8 for trickle systemsIrrigatedAreaSystemAuditFarmP3.3 System Peak Flow Rate CheckPeakFlow RateIf the check indicates that the system peak flow rate exceeds the calculated peakflow rate, the system operating conditions need to be reviewed. The B.C.Irrigation Management Guide provides additional information on how to correctthe problem. If the issue is not easily resolved, consult a Certified IrrigationDesigner (CID). A list of CIDs can be obtained from the Irrigation IndustryAssociation of B.C. (IIABC) at www.irrigationbc.com.B.C. Irrigation Management Guidewww.irrigationbc.comWater Diversion &Conveyance LossAnnualWater UsePre-Assessment – Total Irrigated AreaThe total irrigated area needs to be known before assessing the system peak flowrate. Use Equation 3.1 to determine the total irrigated area in acres. For anirregular shaped field, divide the field into rectangular and/or triangular blocks andadd all field areas to obtain the total irrigated area.Equation 3.1 Total Irrigated Area(a) For square or rectangular field,Total Irrigated Area (b) For triangular field,Total Irrigated Area ScreenAreaWorksheet 3Field Width Field Length43,560Field Base Field Height21,780WaterQuality3.14 ( Field Radius ) se(c) For circular field,Total Irrigated Area lengthIrrigation System Assessment GuideTotal Irrigated AreaField WidthField LengthField BaseField HeightField Radiusradius[acres][ft][ft][ft][ft][ft]
The area that is irrigated by a handmove or wheelmove irrigation system can be determined by using systeminformation as described in Worksheet 3(a). lateral line spacing or distance moved per set number of irrigation sets in the fieldThe irrigated area can also be obtained by determining the field dimensions using Worksheet 3(b).Information AnnualWater UseFor square or rectangular field, measure field widthmeasure field lengthFor triangular field, measure field base measure field heightFor circular field, measure field radiusDetermine the total irrigated area Multiply the field width by the field length to obtain the total irrigated area (Equation 3.1).WaterQualityScreenAreaFor irregular-shaped fields, divide it into rectangular and triangular fields, and add all field areas to obtainthe total irrigated area.DistributionUniformity PeakFlow Ratenumber of sprinklers per lineWater Diversion &Conveyance Loss IrrigatedAreaInformationThe information required for determining the irrigated area is: sprinkler spacingFarmPlanWorksheet 3(a) – can be used for handmove and wheelmove systems onlyWorksheet 3(b) – can be used for both sprinkler and trickle systemsSystemAuditAssessment 3.2 Total Irrigated AreaChapter 3 Basic Irrigation System Assessment 25
FarmPlanExample 3.5 Total Irrigated Area in Armstrong (II)Worksheet 3(a) Total Irrigated Area Using System InformationSystemAuditQuestion:For the wheelmove system in Figure 3.1, there are 30 sprinklers which are spaced 40 ftapart. The wheelline is moved 60 ft per set. The system runs two irrigation sets per day.The irrigation interval is 15 days per pass. What is the total irrigated area of the farmthat is irrigated at one time?Information:IrrigatedAreaIrrigation interval per passIrrigation sets per daySprinkler spacingNumber of sprinklersDistance moved per setCalculation:Step 1.PeakFlow RateAnnualWater UseWater Diversion &Conveyance Loss3060 Irrigation Interval per pass x Irrigation Sets per Day 151days x 306sets22 Sprinkler Spacing x No. of Sprinklers 403ft x 1,2007ft630Calculate the field lengthField LengthStep 4.40Calculate the field widthField WidthStep 3.2Calculate the number of sets per passNo. of Sets per PassStep 2.days/passsetsftsprinklersft1234515 Distance Moved per Set x No. of Sets 605ft x 1,8008ft630Determine the field areaEquation 3.1(a)Total Irrigated AreaScreenArea Field Width x Field Length43,56071,200ft x1,800ft843,560949.6acresRepeat the same step for irregular shaped field.Answer:WaterQualityTotal Irrigated Area Sum of All Field Areas (DistributionUniformity 26Irrigation System Assessment Guide49.6170910 acres99.29 21.29) acres
Question:FarmPlanExample 3.6 Total Irrigated Area in Kelowna (II)Worksheet 3(b) Total Irrigated Area Using Field Dimension – TRICKLEWhat is the total irrigated area of the farm in Figure 3.2 that is irrigated at one time?Information:ftft124651,030SystemAuditField widthField lengthCalculation: Field Width x Field Length43,5601465ft xft21,03043,560311acresPeakFlow RateEquation 3.1(a)Total Irrigated AreaIrrigatedAreaDetermine the field areaRepeat the same step for irregular shaped fieldAnswer: Sum of All Field Areas ( 111434 33 –3) acresAnnualWater UseTotal Irrigated AreaacresPeak flow rate is determined by using Equation 3.2 and the estimated peak flowrate requirement per acre obtained from Table 2.3.Equation 3.2 Calculated Peak Flow RateWorksheets 4(a) and 4(b)Calculated Peak Flow RateWater Diversion &Conveyance LossStep 1. Calculated Peak Flow RateStep 2. Actual System Flow RateThe actual system flow rate can be determined using meters, water purveyorrestrictions, pump information, or sprinkler nozzle output. Worksheets 4(a) and4(b) illustrate more than one method that can be used to determine an accurateactual system flow rate.Î Examples 3.7 and 3.8Chapter 3 Basic Irrigation System Assessment 27WaterQualityCalculated Peak Flow Rate peak flow rate [US gpm]Estimated Peak Flow Rate Requirement per Acre values from Table 2.3Irrigated Area entire area covered by irrigation system [acres]DistributionUniformitywhere:ScreenArea Estimated Peak Flow Rate Requirement per Acre Irrigated Area
Water MeterWater PurveyorWater purveyors supplying irrigation water often allocate a flow rate to the farmbased on acreage. Most often, these flow rates are regulated using flow controlvalves. Contact your water purveyor to find out how much water you are allowedto take if you are on a municipal system or an irrigation district.Pump CurveThe pump curve can be used to estimate the irrigation system flow rate by usingthe impellor diameter, the number of revolutions per minute (rpm) of the pump,and the system operating pressure. This method is most reliable for pumps thathave a steeper pump curve. Contact your pump supplier for pump curveinformation. It is a good idea to confirm the pump flow rate determined from apump curve with one of the other methodologies whenever possible.PeakFlow RateIrrigatedAreaSystemAuditFarmPlanA water meter installed on the irrigation system can be used to determine thesystem flow rate by measuring the amount of water that passes through the meterduring a given time period.Sprinkler System Output Flow RateAnnualWater UseFor sprinkler irrigation systems, the output flow rate can be determined by:1. measuring the sprinkler flow rate using a pail and stop watch;2. averaging the flow; and3. multiplying this number by the number of sprinklers operating.Water Diversion &Conveyance LossAlternately, the sprinkler flow rate can be estimated using the tables in AppendixB. The operating pressure and nozzle size must be known to use these tables. Bothsprinkler and gun system flow rates can be estimated using this method. Flowrates can also be obtained from the manufacturer’s product information.B.C. Sprinkler Irrigation ManualDistributionUniformityTo determine sprinkler system output flow rate using nozzle flow, refer toEquation 3.3.28FarmPlanFarmSystemPlanAuditB.C. Irrigation Management GuideIrrigation System Assessment GuideSystemgatedAuditreaWaterQualityScreenAreaThe flow rates of sprinkler nozzles should be checked at three locations: thebeginning, the middle and the end of the lateral. It is important that all nozzles onthe system are of the same type and have the same operating pressure; otherwise,this system peak flow rate check will be inaccurate. Pressure variances occur dueto friction and elevation differences, and are evident if the sprinklers at the end ofthe lateral do not have the same flow rate as those at the start of the lateral.Sprinkler system lateral lines should be operated on the contour wheneverpossible. If the laterals run up or down a steep slope, each nozzle will be operatingat different pressures. More nozzles along the lateral should then be checked todetermine an average nozzle flow rate. Pressure losses along lateral lines shouldnot be excessive. For more information on pressure distribution assessment, referto the B.C. Irrigation Management Guide.
Worksheet 4(a)Sprinkler System Output Flow Rate Nozzle Flow Rate No. of NozzlesSprinkler System Output Flow Rate flow rate at the outlet [US gpm]Nozzle Flow Rate value from supplier’s tables [US gpm]No. of Nozzles number of nozzles operating at one timeSystemAuditwhere:FarmPlanEquation 3.3 Sprinkler System Output Flow Rate Drip systems do not need to operate 24 hours per day if the sprinkler system peakflow rate is used. To determine trickle system output flow rate using the emitterflow rate, refer to Equation 3.4. For farms using more than one type of emitter fordifferent crops or zones, use the zone with the highest flow rate.Equation 3.4 Trickle System Output Flow RateWorksheet 4(b)Trickle System Output Flow Rate Emitter Flow Rate No. of Emitters 0.0167where:Trickle System Output Flow Rate flow rate at outlet [US gpm]Emitter Flow Rate value from supplier’s tables or determined on the farm [L/hr]No. of Emitters number of emitters operating in one zoneWhat if my peak flow rate is below the calculated one?PeakFlow RateWaterQualityFarms that have a limited water supply may use drip systems to stretch the watersupply further. In these cases, the peak flow rate may be lower than the calculatedrequired peak flow rate, and the operating hours per day will be higher.AnnualWater Use The farm may convert to an alternate crop requiring that a differentirrigation system be used. The flow rate must be capable of supplying therequired flow rate.Water licence flow rates do not take into consideration system types whenestablishing flow rates. The allowable water withdrawal rates are based onsprinkler system flow rates.Irrigation districts establish flow rates based on the requirements ofsprinkler systems.Water Diversion &Conveyance Loss ScreenAreaTrickle and drip systems are much more efficient than sprinkler systems, and maytherefore be able to irrigate an equivalent size field at lower flow rates. However,to conduct a system peak flow rate check, the same calculated peak flow rateobtained for the sprinkler system should be used. The reasons for this are:IrrigatedAreaTrickle System Output Flow RateB.C. Trickle Irrigation ManualSystemAuditTo complete the system peak flow rate check, compare the calculated peak flowrate to the actual system flow rate. It is recommended that the actual flow ratedoes not exceed the calculated flow rate. Equation 3.5 determines the percentChapter 3 Basic Irrigation System Assessment 29DistributionUniformityFarmPlanStep 3. Calculated Versus Actual Irrigated System Flow Rates
FarmPlandifference between the two values for both the system peak flow rate check andthe annual water use check.SystemAuditWhere the peak flow rate is established by a water licence or a water purveyor, thecalculated peak flow rate must not be exceeded.Equation 3.5 Percentage Difference in Flow RateWater Diversion &Conveyance LossAnnualWater UsePeakFlow RateIrrigatedAreaPercent Difference where:Worksheets 2(a) and 2(b)Actual Value 100%Calculated ValuePercent Difference percent difference between actual and calculated values [%]Actual Value irrigation system flow rate [US gpm] or farm annual water use [in]Calculated Value calculated peak flow rate [US gpm] or calculated annual water requirement [in]Assessment 3.3 System Peak Flow Rate CheckWorksheet 4(a) – SprinklerWorksheet 4(b) – TrickleInformation Irrigated area is the entire area irrigated by the irrigation system. Determine the peak flow rate requirement per acre (Table 2.3).Step 1. Determine calculated peak flow rate Use the total irrigated area and estimated peak flow rate requirement per a
requirements. The basic components of an Irrigation System Assessment covered in this chapter are: 3.1 Preparation of an Irrigation Farm Plan - Worksheets 1(a) and 1(b) 3.2 Irrigation System Audit - Worksheet 2(a) and 2(b) 3.3 Total Irrigated Area and Irrigation System Peak Flow Rate Check - Worksheets 3(a), 3(b), 4(a) and 4(b)