Transcription
Irrigation in U.S. Agriculture: On-FarmTechnologies and Best Management PracticesMegan StubbsSpecialist in Agricultural Conservation and Natural Resources PolicyOctober 17, 2016Congressional Research Service7-5700www.crs.govR44158
Irrigation in U.S. Agriculture: On-Farm Technologies and Best Management PracticesSummaryRecent threats to water availability as a result of moderate to exceptional drought in several stateshave raised questions about agricultural water use and efficiencies across the United States. Anunderstanding of common irrigation technologies and the impacts of best management practicesin irrigation may be useful to Congress concerning potential policy responses to this issue. As amajor user of water, the agricultural industry’s use of water resources continues to be a focal pointof agriculture policy. Additional demands on water supplies, extreme weather events (e.g.,prolonged drought), and agricultural market conditions have raised producers’ interest ininvesting in irrigation systems. Increased pressure on the industry to reduce its water use has alsodrawn interest in the adoption of irrigation technologies and best management practices (BMPs)as a means of achieving efficiency and potential water savings.The federal government performs several roles in assisting agricultural producers with irrigationpractices, including financial assistance, technical assistance, research, and monitoring andreporting. The majority of financial and technical assistance is offered through voluntaryconservation programs that target increased irrigation efficiency. In some cases, improvements inirrigation efficiency can increase water consumption because farmers increase the number ofirrigated acres or grow more profitable, water-intensive crops. This raises questions about howand where federal funds are allocated, particularly in areas where water shortages are a concern.The use and significance of irrigated agriculture varies widely across the United States. Althoughpolicy discussions related to irrigation typically focus on western states—home to roughly 71%of irrigated farms—irrigation is practiced in all 50 states and is growing in the east. Over time,there has been a shift in water resources used for irrigation, with an increasing reliance ongroundwater and less on the use of surface water.The type of irrigation system used has also shifted over time—from a gravity, or flood-type ofirrigation, to potentially more efficient pressurized sprinkler and drip irrigation systems. Pressuresystems account for between 58 to 65% of irrigation systems used in the United States andinclude applicators such as center pivot, surface drip, slide roll or wheel move, and microsprinkler. Gravity flow, which includes furrow, and controlled and uncontrolled flooding,accounts for approximately 35 to 42% of irrigation systems in the United States. Irrigation BMPscenter around how water is managed on a farm and includes on-farm conveyance, irrigationscheduling, and application methods. Increasingly, precision technologies (e.g., drones, sensornetworks, data analytics, etc.) are becoming a common part of many irrigation systems because oftheir potential to increase efficiencies and reduce costs.The use of irrigation technology and BMPs bring both benefits and costs. The control of waterapplication achieved through irrigation systems can create higher yields and allow the productionof higher value crops, while potentially reducing some production costs. The additional cost ofinstalling and maintaining these systems, however, can present a barrier to implementing BMPs.Accounting for variations in the local climate, soil type, water quality, and water availability mayalso challenge adoption of irrigation technologies and BMPs.Congressional Research Service
Irrigation in U.S. Agriculture: On-Farm Technologies and Best Management PracticesContentsIrrigation Trends in the United States . 4National Trends . 4On-Farm Trends . 5Irrigation Efficiency . 8Irrigation Technologies and Best Management Practices (BMPs) . 10Pressure Systems . 10Gravity Systems . 13Precision Technologies . 15Benefits of BMP Implementation. 17Barriers to BMP Implementation . 17Cost and Financial Considerations. 17Crop Type. 19Climate . 19Soil . 19Labor and Technology Requirements . 20Water Quality and Quantity of Applied Water . 20Federal Assistance . 20Financial Assistance . 20Technical Assistance . 23Research . 23Monitoring/Reporting . 24FiguresFigure 1. Percent of Market Value of Crops Sold from Irrigated Farms, 2012 . 2Figure 2. Percent Change in Irrigated Acres in the United States, 1997-2013 . 2Figure 3. Irrigated Acres and Applied Irrigation Water, Western States 1984-2013 . 6Figure 4. Sources of Applied Irrigation Water in the West and East, 2003-2013 . 6Figure 5. Irrigation Technologies by Acres and Applied Water by Acre-Feetby Census Division, 2013. 7Figure 6. Irrigation Technologies in Select States, 2013 . 9Figure 7. Sprinkler Irrigation . 11Figure 8. Microirrigation . 11Figure 9. Low-Energy Precision Application Irrigation . 11Figure 10. Common Irrigation Technologies in the United States . 12Figure 11. Laser-Leveling Irrigation Land . 14Figure 12. Tailwater Recovery and Pump . 15Figure 13. Soil Moisture Active Passive (SMAP) . 15Figure 14. Remote Soil Monitoring. 16Figure 15. Poly-Pipe Irrigation . 17Figure 16. Farm Bill Irrigation BMPs Funding by Watershed, FY2009-FY2014 . 22Congressional Research Service
Irrigation in U.S. Agriculture: On-Farm Technologies and Best Management PracticesFigure A-1. Irrigation Technologies and Water Use by State, 2013 . 25Figure C-1. Farm Bill Irrigation BMPs Funding by State, FY2009-FY2014 . 29TablesTable 1. Major Irrigation Technologies: Use in the United States, 2013. 13Table 2. Cost Estimates for Select Irrigation Technologies . 18Table 3. Farm Bill Irrigation BMP Funding by Practice, FY2009-FY2014 . 21AppendixesAppendix A. Irrigation Technologies and Water Use . 25Appendix B. Practice Codes and Definitions for Irrigation BMPs . 26Appendix C. Irrigation BMPs Funding . 29ContactsAuthor Contact Information . 30Acknowledgments . 30Congressional Research Service
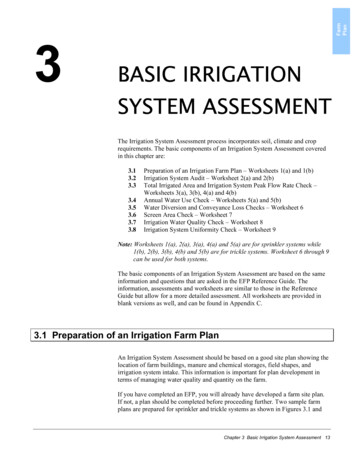
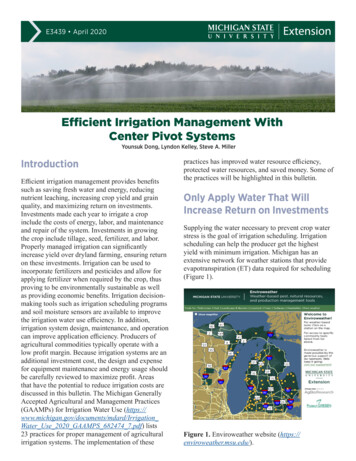
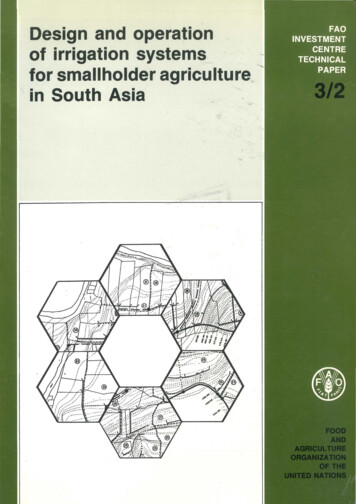
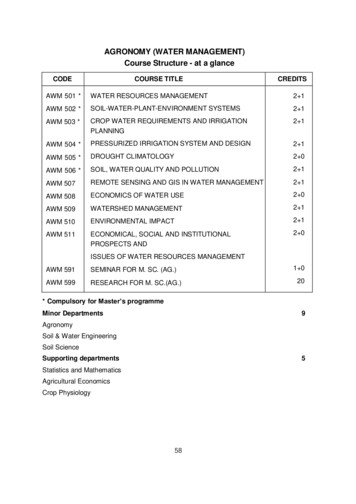
Irrigation in U.S. Agriculture: On-Farm Technologies and Best Management Practicesgriculture is a major user of water in the United States. How the industry utilizes waterresources through irrigation technologies and best management practices continues to bea focal point of agriculture policy. Recent droughts and water shortages have resulted inagricultural producers and conveyance institutions rethinking how water is delivered to and usedon the farm to adjust to water shortages.1 Drought and water shortages affecting farmers’ abilityto irrigate, however, are not isolated to the western United States. Between 2008 and 2013,irrigation was discontinued on over 470,000 acres of farmland across the United States due tosurface and groundwater shortages.2 Given the increasing demands on water supplies for otherusers and uses, especially for the urbanizing West, there are pressures for the agricultural industryto reduce its water footprint. At the same time, there are other forces (e.g., markets, policies, anddroughts) that are encouraging increased interest in irrigation adoption and efficiency.AIrrigation, generally defined, is the artificial application of water to plants to sustain or enhanceplant growth. There are three primary sources of water for on-farm irrigation: groundwater fromwells (55% of irrigation water applied in 2013), water delivered to farms (35%), and on-farmsurface water (10%).3The use and significance of irrigated agriculture varies widely across the United States. Fivestates (Nebraska, California, Arkansas, Texas, and Idaho) alone represent 52% of the totalirrigated acres nationally.4 As shown in Figure 1, irrigated farms in several western states(Arizona, California, Idaho, Nevada, New Mexico, Utah, and Wyoming) and two eastern states(Arkansas and Florida) produce over 89% of the market value of crops sold in those states. In2012, farms with irrigated land accounted for 50% ( 106.3 billion) of the market value of cropssold in the United States, with roughly 71% of irrigated farms residing in the 17 western states.5Although the market share of many western states is high, most have seen a reduction in irrigatedacres since 1997 (see Figure 2). At the same time, irrigation in the east is growing, with somestates seeing a percent increase of more than 50% over this same time period.1U.S. Department of the Interior, Bureau of Reclamation, “Chapter 4: Agricultural Water Conservation, Productivity,and Transfers,” Colorado Basin Stakeholders Moving Forward to Address Challenges Identified in the Colorado RiverBasin Water Supply and Demand Study: Phase 1 Report, May 2015. vingForward/Phase1Report.htm; and Kaomine Vang and David Zoldoske, Irrigation Management, CaliforniaAgricultural Water Stewardship Initiative, igation management.2U.S. Department of Agriculture (USDA), National Agricultural Statistics Service (NASS), 2013 Farm and RanchIrrigation Survey, Table 27: Discontinuance of All Irrigation by Reason: 2013 and 2/Online Resources/Farm and Ranch Irrigation Survey/.3USDA, NASS, 2013 Farm and Ranch Irrigation Survey, Table 4: Estimated Quantity of Water Applied by 012/Online Resources/Farm and Ranch Irrigation Survey/.4USDA, NASS, Irrigation: Results from the 2013 Farm and Ranch Irrigation Survey, ACH 12-16, November 2/Online Resources/Highlights/Irrigation/Irrigation Highlights.pdf.5USDA, NASS, 2013 Farm and Ranch Irrigation Survey, Tables 4 and 11, ine Resources/Farm and Ranch Irrigation Survey/; USDA, NASS, 2012 United States Censusof Agriculture, AC 12-A-51, Washington, DC, May 2014, Table 11: Selected Characteristics of Irrigated andNonirrigated Farms: 2012 and 2007, l Report/Volume 1, Chapter 1 US/st99 1 011 011.pdf. The 17 western states, also referred to in this report as the West, aredefined by the Bureau of Reclamation and include Arizona, California, Colorado, Idaho, Kansas, Montana, Nebraska,Nevada, New Mexico, North Dakota, Oklahoma, Oregon, South Dakota, Texas, Utah, Washington, and Wyoming.Congressional Research Service1
Irrigation in U.S. Agriculture: On-Farm Technologies and Best Management PracticesFigure 1. Percent of Market Value of Crops Sold from Irrigated Farms, 2012Source: CRS from USDA, National Agricultural Statistics Service (NASS), 2012 United States Census ofAgriculture, AC 12-A-51, Washington, DC, May 2014, l Report/Volume 1, Chapter 1 US/usv1.pdf.Figure 2. Percent Change in Irrigated Acres in the United States, 1997-2013Source: CRS from USDA, NASS, Quick Stats, http://quickstats.nass.usda.gov/.Congressional Research Service2
Irrigation in U.S. Agriculture: On-Farm Technologies and Best Management PracticesMany stakeholders are interested in policies associated with irrigation because of its significanceto U.S. agriculture and water supplies. Drought and heat events, as well as agricultural marketconditions, have raised agricultural producers’ interest in investing in irrigation systems andimproved irrigation practices; these producers often are weighing the benefits of irrigation-relatedinvestments with their costs. Many municipal interests and customers are concerned aboutirrigation’s role in regional water demands and how agricultural water use may affect urban watersupplies. These interests would often like to see more judicious use of water in agriculture.6Environmental interests are concerned about irrigation’s impact on water quality and water sourcedepletion and resulting impacts on aquatic ecosystems and species. At the same time, agriculturalproducers are concerned about possible cuts to their right or access to water, the lack of whichcould alter their ability to farm or alter their current system, crop type, or yield.A report from 1996 by the National Research Council summarized the pressures affecting thechanging nature of U.S. irrigation as follows:7 Water costs and demand for water are rising, which is likely to continue.Irrigated agriculture, as the largest and most economically marginal user of waterin water-scarce areas, is vulnerable to changing water availability.The viability of irrigated farming may be threatened by problems, such assalinization of soils and dependence on nonrenewable water supplies.The quality of irrigation drainage or return flows is sometimes sufficientlyimpaired as to limit the future reuse of that water for other purposes, includingenvironmental uses.Irrigation systems and management will likely continue to evolve, movingtoward advanced technologies that provide better water control.The ability of states, Indian tribes, and individual water users to market watercould be central to increasing the flexibility of water allocation, whether forirrigation or nonirrigation uses.Agricultural water use and irrigation practices raise a number of policy questions. For example: Are on-farm irrigation best management practices (BMPs), and the programs thatsupport them, the most cost-effective use of federal funding? Are there otherareas of the water supply chain or involving water users (e.g., irrigation districts,municipal, manufacturing, thermoelectric power, etc.) that could provide greaterwater conservation more economically and/or in greater quantities?How is the efficiency of irrigation BMPs at conserving water measured? Couldthese efficiencies be incorporated into federal conservation programimplementation and funding allocations?Should new and emerging precision technologies, such as data analytics anddrones, receive federal assistance similar to the more traditional irrigation BMPs?What level of priority should these technologies receive, and what level of waterconservation do they provide?6George Skelton, “Thirsty Crops Should Require State Regulation,” Los Angeles Times, March 22, ap-drought-20150323-column.html; Mark Bittman, “Making Sense ofWater,” New York Times, April 14, 2015, ense-of-water.html.7National Research Council, A New Era for Irrigation, 1st ed. (Washington, DC: National Academies Press, 1996).Congressional Research Service3
Irrigation in U.S. Agriculture: On-Farm Technologies and Best Management Practices Should conditions be attached to federal funding for irrigation BMPs to limitagricultural consumption of conserved water (e.g., limiting new irrigated landfrom coming into production when federal funds are used to convert to efficientirrigation systems)? If consumption restrictions were required, what impactwould this have on irrigation BMP adoption? What impact would this have onvoluntary federal conservation program participation? What would the conservedwater be used for, and who controls it? If the conserved water is diverted toanother consumptive purpose (e.g., urban use), is it truly “conserved?”This report primarily addresses two U.S. on-farm irrigation topics: (1) the adoption of irrigationtechnologies and best management practices and (2) water use associated with irrigation. Thereport is intended to provide an overview of on-farm irrigation and does not cover storage andconveyance prior to the farm or how irrigation adoption may alter other farm practices, such asthe use of fertilizers and pesticides or impacts off-farm (e.g., groundwater and surface waterquality concerns).8 While these issues are significant to understanding the full system thatsupports irrigated agriculture and the potential environmental impacts of irrigation, they arebeyond the purpose and scope of this report.Irrigation Trends in the United StatesIrrigation has played a significant role in the development and economy of the United States. Itwas critical in the settlement of the West and agricultural reinvention after the Dust Bowl. Whileirrigation has ancient roots, technological developments (e.g., pumps, plastics, computers, andsensors) have transformed modern irrigated agriculture.9 The benefits of irrigation for the nation’sagricultural industry have been expansive; however, the application of irrigation technologies andthe concomitant changes in the industry have not been without their costs. These costs include butare not limited to associated infrastructure (e.g., dams and conveyance facilities), programssupporting use (e.g., federal assistance for irrigation investments and efficiency improvements),and potential effects on other current and future water users and the environment.National TrendsThe two primary measurements of irrigation water use are water withdrawals and waterconsumption. While irrigation water withdrawals measure the amount of water applied to lands toassist in crop and pasture growth, water consumption from irrigation refers to the water that istaken in by a plant or evaporated without returning to water sources through runoff or percolation.Although irrigation is the second-largest source of water withdrawals in the United States behind8Irrigation comes with a suite of environmental management challenges and options. A 1982 incident of waterfowl andshorebird reproductive failures, deformities, and mortalities at the Kesterson National Wildlife Refuge in the SanJoaquin Valley of California is one example that raised attention to the issue of farm irrigation drainwater quality.Some of the location-specific irrigation drainwater constituents that have been identified as concerns include arsenic,boron, copper, DDT, mercury, molybdenum, salinity selenium, and zinc (U.S. Department of the Interior, NationalIrrigation Water Quality Program, August 2001, http://www.usbr.gov/niwqp/pdf/niwqpbrochure.pdf). The USDA hasidentified improvements in irrigation water management as essential to meeting national priorities for reducingagriculturally induced pollution, such as surface water and groundwater contamination and soil erosion andsedimentation.9Modern irrigation methods arose in the United States in the mid-19th century with the settlement of the Utah GreatSalt Lake Basin. In 1902, Congress responded to growing support for federal irrigation assistance in the west bypassing the Reclamation Act, which ultimately led to the construction of over 100 water projects in 17 western states,making extensive settlement and large-scale irrigation projects on western lands possible.Congressional Research Service4
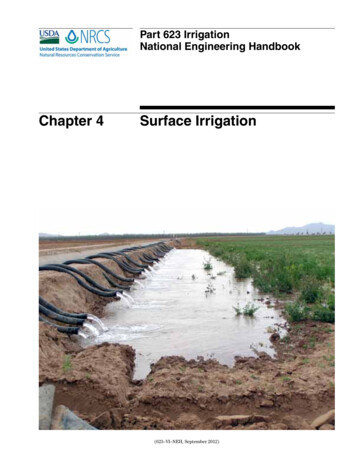
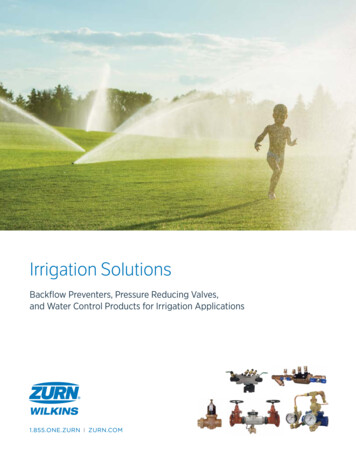
Irrigation in U.S. Agriculture: On-Farm Technologies and Best Management Practicesthermoelectric power, irrigation withdrawals have decreased by 23% since their peak in 1980.10From 2005 to 2010, irrigation withdrawals dropped 9% nationally.11 It is unclear, however,whether this decline in withdrawals has led to a decline in water consumption.12 This is becauseas irrigation efficiency improves, often less water returns to surface or groundwater suppliesthrough runoff or percolation.Brief Glossary of Terms17 Western States (The West)—Arizona, California, Colorado, Idaho, Kansas, Montana, Nebraska, Nevada, NewMexico, North Dakota, Oklahoma, Oregon, South Dakota, Texas, Utah, Washington, and Wyoming.Eastern States (The East)—All contiguous states not included in the 17 western states.Gravity Irrigation—Irrigation systems that divert water from a source to flood over a crop area via land-formingmeasures, including canals, ditches, basins, and furrows.Microirrigation—Irrigation systems that consist of several types of low-pressure, highly efficient irrigation systemsthat apply water directly to the root zone of crops.Sprinkler Irrigation—Irrigation systems that spray water into the air through a sprinkler or nozzle over a croparea to provide adequate soil moisture for crops.On-Farm TrendsAs Figure 2 illustrates, changes in the amount of land irrigated across the United States over timevary by region. Since 2003, only four western states have seen an increase in irrigated acres,while the rest have seen a reduction. Several eastern states, on the other hand, have seen asignificant increase in irrigated acres over this same time period; seven states increased irrigationby 50% (Delaware, Georgia, Illinois, Indiana, Mississippi, South Carolina, and Tennessee).Since the 1980s, farmers shifted from gravity irrigation to pressurized sprinklers andmicroirrigation.13 This shift has been especially pronounced in 17 western states, with gravityirrigation declining from almost 62% of irrigated acres in 1984 to 30% by 2013.14 As shown inFigure 3, irrigated land in the West increased by 1.7 million acres during this same time period,while applied irrigation water declined by over 1.37 million acre-feet (AF).15 There have been10Molly A. Maupin, Joan F. Kenny, and Susan S. Hutson, et al., Estimated Use of Water in the United States in 2010,U.S. Geological Survey, Circular 1405, November 5, 2014, http://pubs.usgs.gov/circ/1405/.11Ibid.12There are no recent authoritative national estimates on water consumption. Previously water consumption wasestimated by the U.S. Geological Survey; however, it has not produced consumption estimates since 1985.13For a brief description of common irrigation technologies, see Figure 10.14USDA, NASS, 2013 Farm and Ranch Irrigation Survey, Table 28: Land Irrigated in the Open by Method of WaterDistribution: 2013 and 2008, ine Resources/Farm andRanch Irrigation Survey/; U.S. Department of Commerce, Bureau of the Census, 1984 Farm and Ranch IrrigationSurvey, AG84 SR-1, Table 4: Land Irrigated by Method of Water Distribution 1984, June 4.15An acre-foot (AF) of water is the volume of water it takes to cover one acre of land with a one foot of water. Sources:USDA, NASS, 2013 Farm and Ranch Irrigation Survey, Tables 4 and 11; and U.S. Department of Commerce, Bureauof the Census, 1984 Farm and Ranch Irrigation Survey, AG84 SR-1, Table 6: Estimated Quantity of Water Applied bySource 1984, June 1986, gressional Research Service5
Irrigation in U.S. Agriculture: On-Farm Technologies and Best Management PracticesFigure 3. Irrigated Acres and Applied Irrigation Water, Western States 1984-20138070Total AppliedIrrigation Water(Millions of Acre-feet)60Total Irrigated Acres(Millions of Acres)Millions5040Irrigated Acres Pressure(Millions of Acres)3020Irrigated Acres Gravity(Millions of Acres)1001984198819941998200320082013Source: CRS from Glenn Schaible and Marcel Aillery, Irrigation and Water Use: Background, USDA, EconomicResearch Service (ERS), June 7, 2013, gement/irrigationwater-use/background.aspx; and USDA, NASS, 2013 Farm and Ranch Irrigation Survey, Tables 4, 29, 30, and Online Resources/Farm and Ranch Irrigation Survey/.Figure 4. Sources of Applied Irrigation Water in the West and East, 2003-20138070Millions of Acre-Feet6050Water Deliveredto Farms40On-FarmSurface Water30GroundwaterFrom ce: CRS from USDA, NASS, 2013 Farm and Ranch Irrigation Survey, ine Resources/Farm and Ranch Irrigation Survey/; and USDA, NASS, 2008 Farm andRanch Irrigation Survey, ine Highlights/Farm and Ranch Irrigation Survey/.Notes: The West refers to the 17 western states previously identified, and the East refers to all contiguousstates not included in the 17 western states. Data does not include water withdrawals from institutional,research, and experimental operations or horticultural crops grown under protection in greenhouses and otherprotective structures that regulate light, shade, and temperature.Congressional Research Service6
Irrigation in U.S. Agriculture: On-Farm Technologies and Best Management PracticesMicroirrigation(Millions of Acres)Sprinkler Irrigation(Millions of Acres)Gravity Irrigation(Millions of Acres)16401435123010258206154102500Millions of Acre-FeetMillions of AcresFigure 5. Irrigation Technologies by Acres and Applied Water by Acre-Feetby Census Division, 2013Source: CRS from USDA, NASS, 2013 Farm and Ranch Irrigation Survey, Tables 6 and Online Resources/Farm and Ranch Irrigation Survey/.Notes: Divisions are based on the nine U.S. Census Bureau Divisions. For a state-by-state breakdown, seeAppendix A. Data do not include water withdrawals or irrigation methods from institutional, research, andexperimental operations or horticultural crops grown under protection.fluctuations in the amount of irrigation water applied over time with the current trend of declinein water application beginning in 1998. Figure 4 shows that although irrigation withdrawals fromon-farm surface water and water delivered to farms in the West has decreased by about 2.5million and 1.2 million AF, respectively, since 2003, groundwater withdrawals have increased byover 740,000 AF. Even with this overall decline in irrigation withdrawals, irrigation withdrawalsremain highest in the western-most portions of the United States (Figure 5).16Growth in irrigated acres in the West is small when compared to increases in the East. Since1984, irrigated land in eastern states has grown by over 8.7 million acres.17 Figure 4 shows thatgroundwater withdrawals have been the primary withdrawal source for irrigation in eastern states.Withdrawals peaked in 2008, with an overall increase of 4.3 million AF since 2003. This trend inincreased irrigated acres in the East has been attributed to increased commodity prices and
The type of irrigation system used has also shifted over time—from a gravity, or flood-type of irrigation, to potentially more efficient pressurized sprinkler and drip irrigation systems. Pressure systems account for between 58 to 65% of irrigation systems used in the United States and