Transcription
ADVANCED EV3PROGRAMMING LESSONData Logging (Part 1)By Sanjay and Arvind Seshan
Lesson Objectivesì Learn what data logging isì Learn the different ways of doing data logging on the EV3ì Learn how to use the Live Data Logging, Remote Data Loggingand Brick Data Logging feature using a temperature sensorì Prerequisites: Must own an NXT Temperature Sensor, Musthave the Edu version of the EV3 Software and Edu version ofbrick firmware. 2016 EV3Lessons.com, Last edit 7/18/2016
What is Data Logging?ì The EV3 software provides a simple way to continuously recordsensor readings to a file and to plot the values later. This iscalled Data Logging.ì Why use Data Logging:ì Great for science experiments. In Part 1, we will show how youcan record values like temperature for a science project.ì Great for understanding robot programming blocks. In Part 2, wewill show how to use data logging to measure the differencebetween turns.ì Great for understanding sensor behavior. In Part 3, we will showhow to use data logging to understand the details of sensors suchas the gyro sensor. 2016 EV3Lessons.com, Last edit 7/18/2016
How do you data log on an EV3?There are 4 ways to data log using the EV3 MINDSTORMS:Live Data Logging: Real time data collected directlyin the EV3 software2. Remote Data Logging: Use the the brick to collectdata, and transfer the data to the computer foranalysis3. Brick Data Logging: Run the experiment directlyfrom the brick1.Lesson 1:TemperatureSensorExperimentLesson 2:DifferencesBetween Turns4.Autonomous. Collect data with the Data Loggingblock. The data is stored on the brick. 2016 EV3Lessons.com, Last edit 7/18/2016
Live Data Loggingì Challenge: We will use a Temperature Sensor to log thechanging temperature of water.ì Design your own experiment. For example, you can try placingthe temperature sensor probe at room temperature water, thenboiling water and then cold water. 2016 EV3Lessons.com, Last edit 7/18/2016
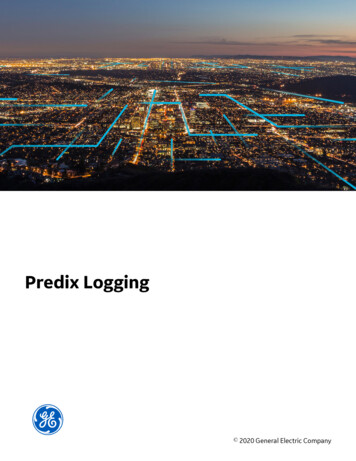
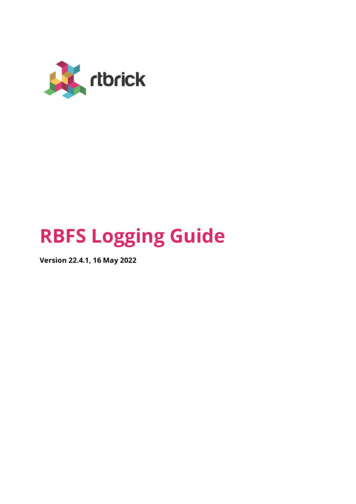
Live Data Logging (Temperature Sensor)STEP 1:Start a New Experiment inan existing projectSTEP 2:Turn off Oscilloscope ModeSTEP 3: Pick yourduration, sample rate,sensor and units. 2016 EV3Lessons.com, Last edit 7/18/2016
Live Data Logging (Temperature Sensor)STEP 4:All sensors connected tothe EV3 will beautomatically added. Ifyou do not want tocollect data with aparticular sensor, clickthe “X” next to it.STEP 5: Download and RunSTEP 6: Place temperatureprobe in hot/cold liquid andwatch the graph (see nextslide) 2016 EV3Lessons.com, Last edit 7/18/2016
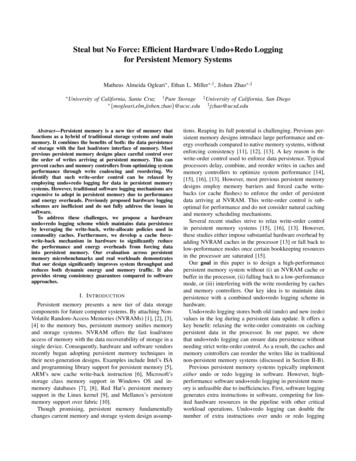
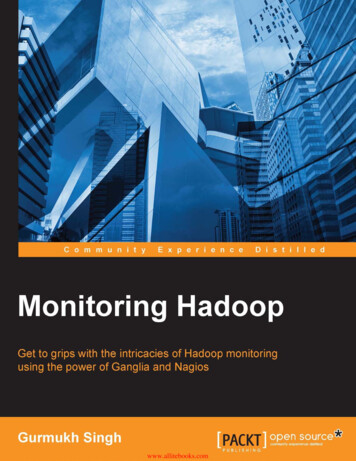
Results/Solution2. Temperatureincreases1. Roomtemperature probeplaced in boilingwater 2016 EV3Lessons.com, Last edit 7/18/20163. Proberemoved andplaced in coldwaterA similargraph willappearlive onyourscreen.
Other Ways to Collect Dataì Now that we have tried Live Data Logging, let’s look at twoother ways to collect data when the computer isn’t around:ì Remote Data Logging: Use the the brick to collect data, andtransfer the data to the computer for analysisì Brick Data Logging: Run the experiment directly from the brick 2016 EV3Lessons.com, Last edit 7/18/2016
Remote Data Logging InsteadDownload IconSTEP 1-4: Repeat steps 1-4 ofthe Live Data LoggingSTEP 5: Click on theDownload iconSTEP 6: Take your robotsomewhere else and runthe experiment from thescreenSTEP 7: Place temperatureprobe in hot/cold liquidSTEP 8: Connect yourrobot and click on theUpload Icon. In the DataLog File Manager, pickthe correct file to import. 2016 EV3Lessons.com, Last edit 7/18/2016These icons appear only when you are inan open EXPERIMENT (not a Project)Upload Icon
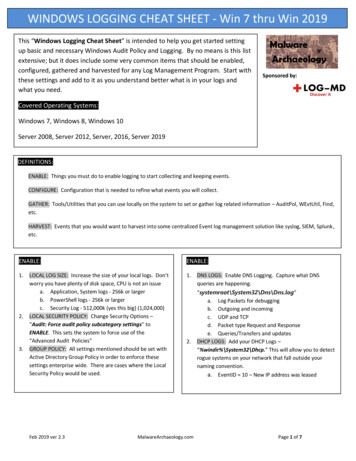
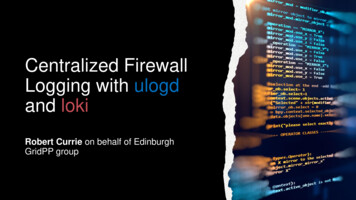
Using Brick Data Logging Instead (Part 1)STEP 1: Go to third tab on Brick Menuand pick Brick DatalogSTEP 2: Click on the wrench to set upsensorsSTEP 3: Click on icon with numbersto see the data for a different sensorSTEP 4: Place temperaturesensor probe in hot/coldliquidStep 5: Click onthe sphere icon tostart and stopcollecting data 2016 EV3Lessons.com, Last edit 7/18/2016
Brick Data Logging (Part 2)STEP 6: Pick name for thefile on the brickSTEP 7: Connect yourThese icons appear only when you are inrobot and click on theUpload Icon after you are an open EXPERIMENT (not a Project)in an Experiment. In theData Log File Manager,pick the correct file toimport. 2016 EV3Lessons.com, Last edit 7/18/2016Upload Icon
Next Stepsì Can you think of other experiments?ì Try data logging using other sensors.ì Try exporting your data into Excel oranother spreadsheet tool.ì Learn how to use Autonomous DataLogging in Part 2 of the Data Loggingseries of lessons. 2016 EV3Lessons.com, Last edit 7/18/2016
Creditsì This tutorial was written by Sanjay Seshan and Arvind Seshanì More lessons at www.ev3lessons.comThis work is licensed under a Creative Commons AttributionNonCommercial-ShareAlike 4.0 International License. 2016 EV3Lessons.com, Last edit 7/18/2016
Live Data Logging: Real time data collected directly in the EV3 software 2. Remote Data Logging: Use the the brick to collect data, and transfer the data to the computer for analysis 3. Brick Data Logging: Run the experiment directly from the brick 4. Autonomous. Collect data with the Data Logging block. The data is stored on the brick.