Transcription
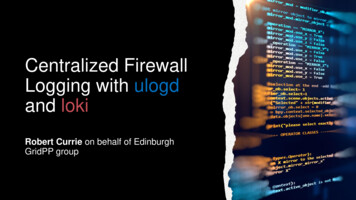
Centralized FirewallLogging with ulogdand lokiRobert Currie on behalf of EdinburghGridPP group
At Edinburgh, the networking is managedcentrally by our university.So, what dowe mean byfirewalllogging?Advantage :less responsibilities/costDisadvantage :less control over traffic flow We can’t monitor firewall policies external toour equipment.We can, and do, request changes. We can still monitor the traffic hitting ourservers which is always useful.
We exclusively use iptables and not firewalld.(viewed as a bit too RH exclusive. Also, iptables are verysimilar to nftables which we plan to test soon)Rules managed/deployed by template/roleswithin ansible.Our Firewallconfiguration Originally, we were interested in just loggingdropped connections.Trying to answer; “Are there any obviousmisconfigurations at our server level?” iptables –j LOG was ‘good enough’ forthis, but makes dmesg unusable very quickly,not to mention painful to parse.
Ulogd:“ulogd is auserspace loggingdaemon fornetfilter/iptablesrelated logging” Installed/Available on lots of Debian baseddistros ‘by default’(3rd party epel repos package it for CentOS) Deployed using ansible and compile/installeverything manually on each host.(deployment takes 10min for the whole site of30ish machines) Usage is relatively simple:Start userland ulogd service then les –A INPUT -j NFLOG --nflog-group xx
Custom service managed by systemd 1 Config file ( 25 lines):/etc/ulogd.conf Rejected connections are logged:How we use all-ipv6.log We can track source/destination IP/portnumber and protocol in a time orderedtext logfile.
In order to centrally manage logs, we decided to useGrafana loki promtail (PLG).(promtail, loki & Grafana written in go, user-friendly andhave a reduced barrier to entry)Centralizingour firewalllogging Promtail: runs on the host where the logs are.These logs are tagged and (push) broadcast to ourcentral loki instance.(security here mainly via ip whitelisting,need to configure tls in future) Loki: runs a service on our monitoring host. Loggingdata is ingested, processed and stored. Grafana: responsible for plotting/displaying metricsfrom logs.
How do we useCentralizedLogging?(Not necessarilya best practiceguide) Custom systemd services on all hosts (HW/VM).Logging framework deployed via docker on centralizedlogging server. Promtail is quite quick to configure. Broadcasts wholelog message and simply tags it with metadata. Loki ingests and stores data. Slightly tricker to getconfigured correctly. Supports s3 storage and allowsafter-the fact log parsing.(e.g. searching for 1 IP in the logs can return when thisIP contacted each host) Grafana is responsible for displaying the log results.Quite easy to use, good support here for combining Lokiand Prometheus metrics on same plot!
Summary of Rejected Connections
Exploring time based loki logs
Exploring time based loki logsLogQL query supporti.e. What port, time, server Time based histogram forsearchingFull logs from server
What did we learnfrom the logs?Target PortServices associated with t SQL Server Most actively probed (and blocked)requests are. 3074Xbox (and opsec-omi)3389RDP Ports are for services which arecommonly used, though not in GridPP.3478STUN server (IP-phones)59xxVNC8080Re-directed web-uis for many services Some of these are also used in ouruniversity. Lesson here is to remember to keepexternally facing services up to date.
IPv6 traffic at Edinburgh is routed through additionalfirewalls.We believe this partly explains the lack of malicioustraffic hitting our nodes over IPv4.(Although IPv6 adoption in industry is hit/miss)What elsedid we learnfrom thelogs?Quite a lot. Most traffic comes from distributed networks of botswhich scan sequentially though our infrastructure.(Usually, no 2 IP are the same) Unwanted traffic is 99.9% from external maliciousbotnets. Identified a minor DPM (non-security) issue at the site.(won’t discuss here) Attacks seem to be based on naïvely looking forunsecure services rather than probing whole port range Switching services to non-standard ports where possiblereduces unwanted traffic.e.g. ssh 22 - 2222, vnc 5900 - 5750
During the ‘2020-HPC-security-incident’* wewere easily able to confirm/deny maliciousactivity involving the servers we manage.Centralizedlogging, is ituseful?Yes! Potentially too many IP to sensibly block on allhosts?(May want to look at ASN) Loki promises better integration withPrometheus/Grafana system monitoring butmigrating to an ELK stack promises bettercomplex log queries, neither are perfect for alluse-cases (yet). Loki is better (purely imo) as you spend lesstime worrying about ingesting/indexing/storingdata, but it doesn’t have quite the same flexibilityof elasticsearch. \ (ツ) / * https://www.bbc.co.uk/news/technology-52709660
Checking the firewall config is useful.(Some services were more exposedthan they should be, fortunately nocompromises)What didwe learn? Useful for debugging distributedsystems.(tracking DPM logs this way) Once setup ELK or PLG are both moreefficient than having to manuallyextract/search logs.In terms of ease of use:manual-logs PLG ELK
BACKUPS
Learning touse Loki A casestudy indoing itwrong, atfirst. Originally attempted to label all dropped connection log lines byIP,PROTO,DPT,SPT. This produced a cardinality that is too highfor loki to comfortably cope with.( 1,000 labels after 1 week) Planning to reduce this to PROTO DPT. This reduces thecardinality to only some of the key metrics.NB:We can now plot;Can no longer plot;What people are probing for?Who was probing for this? Can produce plots to answer both questions using ELK.But here all the data is pre-parsed (no full log lines). Labels in loki are much more intended to aid log filtering but arealso essential for producing metric plots using Grafana.Potential solution might be to include virtual-labels generated atquery time using regex within LogQL but we haven’tinvestigated this yet.
Centralized Logging? (Not necessarily a best practice guide) Custom systemd services on all hosts (HW/VM). Logging framework deployed via docker on centralized logging server. Promtail is quite quick to configure. Broadcasts whole log message and simply tags it with metadata. Loki ingests and stores data. Slightly tricker to get