Transcription
IRWUS APPENDICESAppendix JAppendix J.Efficient Indoor Water Use andPracticesPrepared forCalifornia Department of Water ResourcesByCalifornia State Water Resources Control BoardCalifornia Department of Water ResourcesWater Use Efficiency BranchApril 2020J-1
IRWUS APPENDICESAppendix JEfficient Indoor Water Use and PracticesThis appendix includes additional information to quantify efficient indoorresidential water use and practices. The Department of Water Resources(the Department) and the State Water Resources Control Board (the StateWater Board) recognize the work urban retail water suppliers have done andcontinue to do to promote water conservation, including measures toincrease indoor residential water use efficiency. The Department and theState Water Board also recognize there is untapped potential and moreCalifornians can do to make conservation a way of life.The data and reports referenced in this appendix were collected before theCOVID-19 pandemic. Shelter-in-place orders and remote work haveaffected urban water use patterns. According to one study, the water use ofmany households increased with more frequent hand washing and toiletflushing; in other households, it decreased as people washed fewer loads oflaundry (P. Mayer, personal communication, January 2021). Another studysuggests the pandemic may have resulted in a 1.4% increase in theresidential water use sector, which the authors attribute to an increase inoutdoor use (Li, 2021).Efficient useStarting in January 2024, California Water Code section 10609.20 directseach Urban Retail Water Supplier (URWS) to calculate an urban water useobjective, which would be the sum of the following: Aggregate estimated efficient indoor residential water use. Aggregate estimated efficient outdoor residential water use. Aggregate estimated efficient outdoor irrigation of landscape areaswith dedicated irrigation meters or equivalent technology in connectionwith CII water use. Aggregate estimated efficient water losses. Aggregate estimated water use in accordance with variances, asappropriate.J-2
IRWUS APPENDICES Appendix JA bonus incentive for potable reuse water, not to exceed 15 percent ofthe urban water supplier’s water use objective.At the household scale, efficient indoor residential water use practicesinclude, but are not limited to, actions such as the installation andmaintenance of efficient fixtures and appliances, minimizing leaks, ensuringthe efficient distribution of hot water, reusing gray water on-site, and waterefficient behaviors (e.g., minimizing shower time). At the supplier scale,these practices include, but are not limited to, actions such as education andoutreach, leak detection, surveys, showerhead and aerator distribution,rebates, and advanced metering infrastructure (AMI) (CUWCC, 2008).While the California Water Code does not quantitatively define efficientindoor residential water use, existing standards, studies undertaken for thisreport, and previous analyses suggest efficient indoor residential water usefor homes equipped with efficient fixtures and appliances ranges from 24 to39 gpcd at the household level and from 28 to 43 gpcd (refer to Figure 1)when averaged across the service areas of California urban retail watersuppliers. These values will be explained and referenced in the followingsections.Efficient Indoor Residential Water Use in HouseholdsBased on the latest efficiency standards adopted by the California EnergyCommission (CEC), specifications adopted by the U.S. EnvironmentalProtection Agency’s ENERGYSTAR program, and use patterns documented inthe 2016 Residential End Use Study (De Oreo et al. 2016), the water use ofa typical home equipped with efficient fixtures and appliances isapproximately 35 gpcd. Table J-1 shows the hypothetical water use of atypical home with and without efficient appliances and fixtures. The columnon the left shows the hypothetical indoor water use of a typical home usingolder or less efficient appliances and fixtures. The column on the right showsthe hypothetical indoor water use of a home that has ENERGYSTARappliances (ENERGYSTAR, 2019) and fixtures that meet the most recentefficiency standards adopted by the CEC (77 FR 32307, CCR Title 20).Assumptions regarding indoor water use habits--for example, the averagenumber of times a person flushes a toilet per day as 5--come from theJ-3
IRWUS APPENDICESAppendix JWater Research Foundation’s 2016 Residential End Use study (De Oreo et al.2016).J-4
IRWUS APPENDICESAppendix JTable J-1: Comparing the hypothetical water use of example homesbetween older and less efficient appliances and fixtures, and newer,highly-efficient appliances and fixtures.Modeled water use for atypical home withinefficient appliances &fixturesModeled water use for atypical home with efficientappliances & fixturesToilet18 gpcd (3.5 Gallons perflush)6 gpcd (1.28 Gallons per flush)ClothesWasher11 gpcd (37 Gallons perload)6 gpcd (19 Gallons per load)Shower7 gpcd (2.5 Gallons perminute)6 gpcd (1.8 Gallons per minute)Faucets14 gpcd (2.2 Gallons perminute)10 gpcd (1.5 Gallons perminute)2 gpcd2 gpcd2.5 gpcd2.5 gpcd1.5 gpcd1.5 gpcd1 gpcd (9 Gallons per load)0.4 gpcd (3.6 Gallons per load) 55 gpcd 35 gpcdUseIn-homeLeaks 64Other65BathDishwasherTOTALAccording to REUS 2016, households leak 17 gallons per day, on average.That average is heavily skewed by households with large leakage rates. Mosthouseholds leak less than 5 gallons per day. Assuming an average of 2.64persons per household, the per capita share of leakage, for mosthouseholds, is less than 2 gpcd.65The “other” category includes evaporative cooling, humidification, watersoftening, and other uncategorized indoor uses.64J-5
IRWUS APPENDICESAppendix JPrevious analyses have sought to understand efficient indoor water use inhomes in California and across the country. In Analysis of Water Use in NewSingle-Family Homes, which includes homes in California cities such asRoseville, De Oreo et al. (2011) measured the indoor water use ofWaterSense New Homes at 35.6 gpcd and existing homes retrofitted withwater efficient devices at 39 gpcd. In Residential End Uses of Water, Version2, the authors found that demand would drop to 37 gpcd for homesretrofitted with most recent industry-standard water efficient devices. Ifhousehold leaks were reduced, demand would drop further to 34 gpcd. Iftoilets were flushed with greywater rather than potable water, demandwould drop to 27.9 gpcd (De Oreo et al., 2016). In Measuring ProgressToward Universal Access to Water and Sanitation in California (2018), thePacific Institute, extrapolating from 2018 appliance and fixture standards,estimated efficient indoor water use to be 37 gpcd (Feinstein, 2018). Basedon leading edge flow ratings, meaning those even more efficient thancurrent standards (e.g., toilets using just 0.8 gallons per flush), theyestimated efficient indoor water use would be 24 gpcd (Feinstein, 2018).Table J-2 summarizes the efficient indoor residential water use rates thathave been documented in previous analyses.As seen above, customer best practices, such as the installation andmaintenance of efficient fixtures and appliances, minimal leaks, the efficientdistribution of hot water, and on-site reuse of grey water can contribute toefficient indoor residential water use rates ranging from 24 to 39 gpcd.Water use that falls within this range may be considered to reflect bestpractices at the household level.J-6
IRWUS APPENDICESAppendix JTable J-2: Summary of efficient indoor residential water use rates atthe household scale.Ri-gpcdYearSourceWaterSense New Home362011De Oreo et al. (2011)Existing home retrofittedwith water efficient devices392011De Oreo et al. (2011)Existing home retrofittedwith water efficient devices372016Residential End Usesof Water, Version 2Existing home retrofittedwith water efficientdevices, plus leak detection342016Residential End Usesof Water, Version 2Existing home retrofittedwith water efficientdevices, plus leak detectionand greywater use282016De Oreo et al. (2016)Extrapolation of existingfixture and appliancestandards372018Pacific InstituteLeading edge flow ratedappliances242018Pacific InstituteEfficiency MeasureEfficient Indoor Residential Water Use at the Community ScaleAs described in Section 2.0, the Department collected and analyzed monthlywater data from customer accounts for 2017, 2018, and 2019--the threeyears following the last drought. The customer-level water use data wasthen aggregated to the geographic scale of census tracts. To calculate percapita use, the Department divided the aggregated census tract water usedata by census tract population. Using four different methods (as describedin Section 2.4), the Department estimated indoor residential water use forJ-7
IRWUS APPENDICESAppendix J18 Urban Retail Water Suppliers. One of those agencies is a municipal leaderin water efficiency, with robust programs encouraging efficiency acrosssectors (e.g., rebates, audits, give-a-ways, resale ordinances, etc.) andeffective messaging. Using each method, the Department estimated theaverage baseline indoor water use rate across this agency’s entire servicearea was below 40 gpcd.For the 17 other agencies participating in the Department’s study, estimatesof per capita use based on service area wide averages were not as low. Inany given service area however, there exists a distribution of per capita usevalues. According to the Seasonal Adjustment Method, SAM 66, homes in thelowest water-using quartile tracts use 44 gpcd on average or less, with ratesranging from 34 to 58 gpcd. These data suggest that, even if an agency’saverage estimated indoor residential water use is high, there is a percentageof customers within their service area that appear to be using water moreefficiently indoors, i.e., at rates more similar to those of the highly efficienthomes modeled through the Water Research Foundation (2016) and PacificInstitute (Feinstein, 2018 ) studies. Table J-3 summarizes these data.As described in Appendix A, each of the methods used to calculate indoorresidential have limitations. SAM, for example, may not accurately removeoutdoor water use. For agencies that participated in the Department’s studyand have independently estimated l indoor residential use rates, SAMappears to overestimate indoor use.66J-8
IRWUS APPENDICESAppendix JTable J-3: Average and first-quartile indoor residential water use,using monthly data, and the percentage of the service areapopulation associated with tracts averaging 44 gpcd or less.(Ri-gpcd)Lowest WaterUsing QuartileTracts (Ri-gpcd)% Population inTracts Averaging44 gpcd or Less18 AgencyAverage4844.042%Agency A44.440.943%Agency B39.035.776%Agency C48.944.622%Agency D57.853.18%Agency E44.442.323%Agency F43.538.761%Agency G44.740.435%Agency H41.938.583%Agency I49.144.621%Agency J40.334.262%Agency K51.648.211%Agency L53.749.73%Agency M39.438.0100%Agency N69.857.74%Agency O42.739.965%Agency P51.648.71%AgencyAverage UseJ-9
IRWUS APPENDICESAppendix J(Ri-gpcd)Lowest WaterUsing QuartileTracts (Ri-gpcd)Agency Q63.255.50%Agency R36.833.6100%AgencyAverage Use% Population inTracts Averaging44 gpcd or LessAs described in Section 2.3, the Department also collected and analyzedhourly water data from customer accounts for 4 of the 18 suppliers (Table J4). According to SAM, tracts in the lowest water-using quartile used anaverage of 42 gpcd for these suppliers, with values ranging from 31 to 52gpcd.Table J-4: Service are average and first-quartile tracts indoorresidential water use, using hourly data, and the percentage of theservice area population associated with tracts averaging 44 gpcd orless.AgencyAverage Use(Ri-gpcd)Lowest WaterUsing QuartileTracts (Ri-gpcd)% Population inTracts Averaging44 gpcd or Less4 AgencyAverage4742Agency K57.951.60%Agency L51.446.89%Agency 042.439.862%Agency R34.431.1100%43%As described in Section 5.0 of this report, the Department and the StateWater Board also analyzed single-family water delivery volumes using dataJ-10
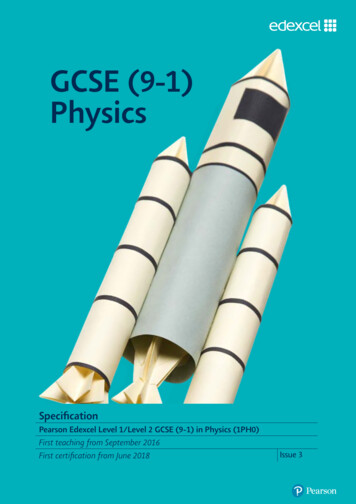
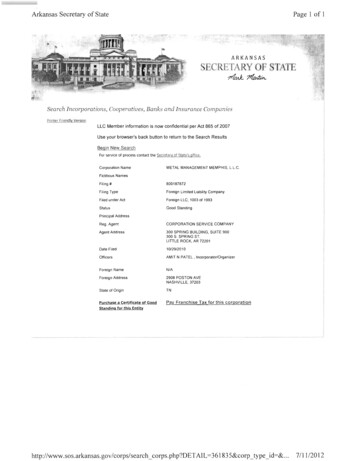
IRWUS APPENDICESAppendix Jreported in the electronic Annual Report (eAR), according to the SAM. Basedon this analysis of 2017-2019 data from 157 urban retail water suppliers,average and median indoor residential water are 51 and 48 gpcd,respectively. For urban retail water suppliers (Suppliers) at the lowest waterusing quartile, residential customers are estimated to be using 43 (or lower)gpcd indoors. Figure J-1 shows the residential water use continuum usingElectronic Annual Report (eAR) data and SAM analysis.MedianAverage48 5128IMn39 43I I10th 25th56I75th64I90th129IMaxFigure J-1: Today’s indoor residential water use continuum usingdata from the eAR and SAM, showing the 2017-2019 range in gpcd.Alignment across these datasets does not explain why water use is 44 gpcdor less for tracts (Tables J-3 and J-4) and 43 gpcd for Suppliers (Figure J-1)at the 25th percentile. One explanation is that these customers andcommunities are using water more efficiently indoors. In-depth End Usestudies would help us to better understand these trends.Efficient Indoor Residential Water Use as Reported by Water AgenciesSome agencies have also independently sought to understand indoorresidential water use trends in their service area (Table J-5). Based on asingle-family residential end use study, the City of San Francisco estimatesper capita residential use to be 44 gpcd, including both indoor and outdooruse (SFWPP, 2016). Using a combination of the minimum month methodand the seasonal adjustment method, the Inland Empire Utility Agency(IEUA) estimated indoor residential use is 37 gpcd in housing built after2013 (IEUA, 2016). The City of Santa Cruz used the minimum monthmethod and estimated indoor residential water use to be 36 gpcd (B. Pink,J-11
IRWUS APPENDICESAppendix Jpersonal communication, September 2020). In their draft Urban WaterManagement Plan, the City of Los Angeles estimates that on average, indooruse represents 49 - 56% and 70 - 80% of single-family and of multi-familyresidential use, respectively (LADWP, 2021 and T. McCarthy, personalcommunication, April 2021). The reported volume of deliveries by sectorand service area characteristics, such as average number of persons perhousehold, suggests LADWP’s indoor residential water use is somewherebetween 40 and 46 gpcd. 67Table J-5: Summary of efficient indoor residential use rates fromvarious agency studiesAgencynameRigpcdYearMethodSourceSanta Cruz362020Winter minimumCity of Santa CruzSanFrancisco442015End Use studyCity of SanFrancisco WaterConservation PlanIEUA372015Winter Min/SAMInland Empire UtilityAgency IntegratedWater ResourcesPlanLADWP40-462021Percentindoor/outdoor usebased on an enduse study, asaturation study,and sewage flowdata.LADWP 2021 UWMPdraftsWPPSingle-family and multi-family water demand (FYE average 2016-2020), indoor andoutdoor water use percentage breakdowns by sector (FYE average 2015-2020), and 2020demographic projections for the LADWP service area (housing units and persons perhousehold) from LADWP’s Draft Urban Water Management Plan 2020 were used to calculatean indoor residential use of about 40 gpcd (LADWP 2021).67J-12
IRWUS APPENDICESAppendix JEfficient Indoor Residential Water Use in AustraliaAustralia provides a relevant comparative case study to California forunderstanding indoor water use trends. Like California, Australia is affluentand industrialized; it has also endured severe drought and investedconsiderable resources in managing water resources more efficiently.Several Australian states with characteristics akin to communities here inCalifornia have achieved efficient indoor water use rates across large areas.In Australia, average indoor household water use was measured at 38 gpcdacross southeast Queensland cities such as Brisbane and Gold Coast (Beal etal., 2012) and 35 gpcd in Adelaide, South Australia (Arbon et al., 2014). InMelbourne, Victoria, City West Water conducted two residential end usemeasurement studies in the last decade, documenting that average indoorresidential water use ranges from 25 to 32 gpcd (City West Water, 2019).In the period immediately following the Millennium Drought, indoorresidential water use averaged 25 gallons per person per day. Since then,indoor water use has increased; between 2017 and 2018, it averaged 32gpcd (City West Water, 2019). Table J-6 below summarizes the total andfixture-specific water use trends.J-13
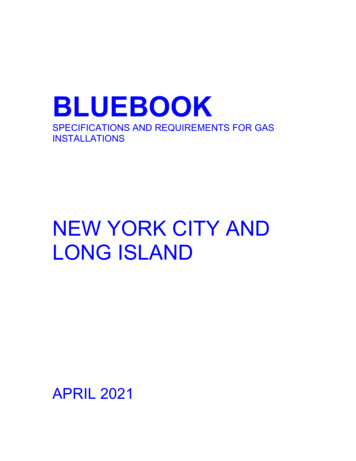
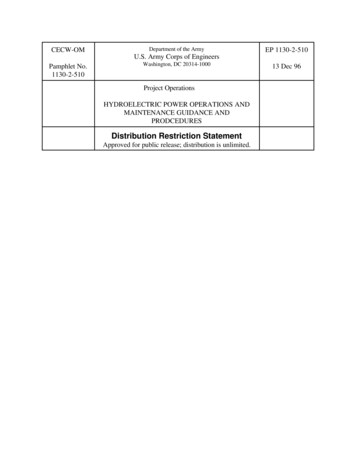
IRWUS APPENDICESAppendix JTable J-6: Melbourne’s average residential indoor water useaccording to City West Water’s 2010-2012 and 2017-2018residential end use studies.FixtureResidential End Use Study2010-2012 (gpcd)Residential End Use Study2017-2018 Leaks/drips21Dishwasher0.050.12532TotalIn August 2020, typically Melbourne’s wettest month 68, water use was 33gpcd (Melbourne Water, 2020), suggesting residents have been beating their“winter Target” of 130 liters (34 gallons) per day, even in the throes of theCOVID-19 pandemic. During and following the Millennium Drought,Australian states and water purveyors set ambitious residential waterconsumption targets. “Target 155” initiatives encourage limiting household(indoor and outdoor) use to 155 liters (40 gallons) or less per person perday (Figure 2). Because demand varies depending on the season,Australia's water managers concluded that 155 liters would represent anideal annual average (Fitzgerald, 2009). In Melbourne, the target is 130In areas like Melbourne, where winter precipitation eliminates the need for outdoorirrigation, winter water use is an imperfect, but reasonable gauge of indoor water use.68J-14
IRWUS APPENDICESAppendix Jliters (34 gallons) in the winter and 190 liters (50 gallons) in the summer(Weinstein Bloome and de Guzman, 2017).Figure J-2: Printed material used to encourage residents toconserve water (NY Times, 2016)In drought or not, states such as South Australia, South East Queensland,and Victoria are institutionalizing efficient urban indoor water use. Theydemonstrate that with adequate funding, efficient levels of indoor water useare possible across large areas with big populations — and that such levelsof water use are possible in places that resemble California, not onlyculturally and economically, but also climatically for some regions (e.g.,Melbourne’s climate is similar to San Jose’s climate). Many California citiesand suburbs developed around the same time as those in Australia, withparallel trajectories in terms of urban design and infrastructure. Perhapsmost importantly, California and Australia share a need to prepare for longerand more intense periods of water scarcity. One key lesson from Australia’sMillennium Drought and drought responses is that efficient indoor residentialuse is as achievable as it is important. Table J-7 summarizes the efficientJ-15
IRWUS APPENDICESAppendix Jindoor residential water use rates documented at the household andcommunity scale in three regions in Australia.Table J-7: Summary of efficient indoor residential use ratesdocumented in Australia.Ri-gpcdYearLocation382012Southeast Queensland (e.g., Brisbane, Gold Coast,etc.), Queensland352014Adelaide, South Australia252012Melbourne, Victoria322018Melbourne, Victoria332020Melbourne, VictoriaGreen Building Standards and Rating SystemsSeveral green building rating systems encourage efficient water use. Whilecompliance with the standards may be voluntary (or partially voluntary),they may be used for new construction and existing homes. Leadership inEnergy and Environmental Design (LEED) is the most widely used greenbuilding rating system in the world, but there are others and they all includecriteria to ensure water is being used efficiently in new and existing homes.Table J-8a and J-8b, below, summarize the water criteria currently used byLEED, WaterSense, CalGreen, and Build It Green’s Green Point Standard.J-16
IRWUS APPENDICESAppendix JTable J-8a: Water use efficiency criteria for several efficiency program standards. Applianceand fixture efficiencies are generally measured in gallons per flush (gpf) or gallons per minute(gpm).ToiletsFaucetsWaterSenseLEED*(Ver 2.0,1 pt2019)CalGreenGreen PointStandardLEED*2 ptsLEED*3 pts1.28 gpf1.28 gpf or less1.28 gpf1.28 gpf1.1 gpf0.8 gpf1.2 /1.8 gpm 1.5 gpm or less1.5 gpm1.5 gpm1.5 gpm1.0 gpmShowerhead1.8 gpm2.0 gpm or less2.5 gpm2.0 gpm1.75 gpm1.5 n/aENERGYSTAR’S IWFTop-loading, IWF 4.3Front-loading, IWF 3.2n/aDishwasher ENERGYSTAR(voluntary)ENERGYSTARn/an/an/an/a*LEED Leadership in Energy & Environmental Design, Vol. 4.1, updated January 10, 2020J-1
IRWUS APPENDICESAppendix JTable J-8b: Water use efficiency criteria for several efficiency program standards continued.Appliance and fixture efficiencies are generally measured in gallons per flush (gpf) or gallonsper minute (gpm).CalGreenLeaksn/aGreen Point StandardNo leaksWaterSense(Ver 2.0,2019)No leaksHotOn-demand hot Insulate all hot watern/awaterwaterpipes; locate water heaterdelivery circulationwithin 12 ft of all fixtures;systemand install on-demand(voluntary)circulation control y)Greywater reuse,rainwater capture(innovation, extra pts)Leadership in Energy &Environmental DesignVol 4.1, updated January 10,2020The water pressure in the housemust be tested, with no detectablewater leaks; projects arerecommended, but not required, toreduce water pressure in the houseto 60 pounds per square inch.Design and install an energyefficient hot water distributionsystem; All heat traced piping mustbe insulated.Homes must be Water meteringat least 30%more efficient Water softeners must be demandinitiated.than typicalnewconstructionJ-2
IRWUS APPENDICESAppendix JOther examples of customer water use efficiency criteria and ratings notsummarized in Tables J-1a and J-1b include RESNET’s HersH20 69, WaterEfficiency Rating Score (WERS) 70, and The Living Building Challenge 71.Some certification schemes, such as the Living Building Challenge, have veryrobust requirements for existing buildings, calling both for responsible wateruse as well as buildings being “net positive” with respect to water. As usedby energy resource managers, being net positive means making or usingmore than you take. Some Californians have already taken steps to this endand offset indoor and outdoor needs with greywater and captured rainwater.As described in Appendix F, passive conservation is estimated to havecontributed to an average statewide decrease in indoor residential water useof 0.58 gpcd per year from 2015 through 2020; from 2020 to 2025, passiveconservation is expected to drive indoor gpcd down by a statewide averageof 0.38 gpcd per year; and, from 2025 to 2030, by 0.26 gpcd per year(Mitchell 2016). These projections may underestimate passive conservation’srole in the future because they do not account for ultra-high-efficiencyfixtures and appliances (e.g., toilets that use 0.8 gpf) or even showerheadsand faucets that meet today’s standards 72. However, these statewideestimates may also overestimate the passive conservation potential ofcommunities that have low indoor residential water use rates today (e.g.,San Francisco) and may underestimate the passive conservation potential ofcommunities with high indoor residential water use rates today.Residential Energy Services Network. 2021. RESNET’s Water EfficiencyRating System HERSH2O. Available at:https://www.resnet.us/about/hersh2o/. Accessed May 6, 2021.70Water Efficiency Rating Score (WERS) . Available at:https://www.wers.us/about-2/. Accessed May 6, 2021.71International Living Future Institute.2021. Living Building Challenge.Available at: https://living-future.org/lbc/. Accessed May 6, 2021.72The 2016 Mitchell analysis did not include ultra-efficient fixtures becausethey are not required by code; it did not include showerheads and faucetsbecause end use studies have suggested more efficient showerheads andfaucets result in relatively minimal savings.69J-1
IRWUS APPENDICESAppendix JConclusionExisting standards, studies undertaken for this report, and previous analysessuggest efficient indoor residential water use ranges from 24 to 39 gpcd atthe household level. Many California households appear to be using waterefficiently indoors, with use rates mirroring those of homes equipped withfixtures and appliances that meet current CEC standards and U.S. EPAENERGYSTAR performance criteria.Studies undertaken for this report and previous analyses suggest efficientindoor residential water use ranges from 28 to 43 gpcd when averagedacross the service areas of California urban retail water suppliers. Using datafrom the electronic Annual Report, 25% of California Urban Retail WaterSuppliers are estimated to have indoor residential water rates of 43 gpcd orless.Section 10817 of the California Water Code defines “water use efficiency” asthe efficient management of water resources for beneficial uses, preventingwaste, or accomplishing additional benefits with the same amount of water.Using less water indoors to complete the same domestic tasks — withoutcomprising water quality or the user experience — is a clear example ofwater use efficiency.References77 F.R. 32307. (2012). Energy Conservation Program: Energy ConservationStandards for Residential Clothes Washers. Department of -05-31/pdf/2012-12320.pdfArbon, N., Thyer, M., Hatton MacDonald, D., Beverley, K., & Lambert, M.(2014). Understanding and predicting household water use for Adelaide.Goyder Institute for Water Research Technical Report Series, 14, 15.Beal, C. D., Makki, A., & Stewart, R. A. (2012). Identifying the Drivers ofWater Consumption: a Summary of Results from the South East QueenslandResidential End Use Study. In Science Forum and Stakeholder Engagement:Building Linkages, Collaboration and Science Quality (pp. 19-20).J-2
IRWUS APPENDICESAppendix JCalifornia Green Building Resources Code (2020). CalGreen’s 2019Residential Measures, Mandatory and Voluntary. Accessed chapter-4-residentialmandatory-measuresCalifornia Green Building Standards Code. (2016). California Code ofRegulations, Title 20, Sections 1601 through ns/appliance-efficiencyregulations-title-20C.W.C. , § 10609.2, subdivision (a). Chapter 9. Urban Water Use Objectivesand WaterUse Reporting. http://leginfo.legislature.ca.gov/faces/codes displaySection.xhtml?sectionNum 10609.&lawCode WATDeOreo, William B. (2011). Analysis of water use in new single familyhomes. By Aquacraft. For Salt Lake City Corporation and US EPA.DeOreo, W., Mayer, P., Dziegielewski, B., and J. Kiefer. (2016). ResidentialEnd Uses of Water, Version 2. Water Research Foundation.ENERGY STAR. (2019) Unit Shipment and Sales Data Archives. Accessedfrom:https://www.energystar.gov/partner resources/products partner resources/brand owner resources/unit shipment data/archivesFeinstein, L. (2018). Measuring Progress Toward Universal Access to Waterand Sanitation in California: Defining Goals, Indicators, and PerformanceMeasures. Pacific Institute.FitzGerald, C. (2009). Implementing Residential Water Use Targets – AMelbourne Perspective.Presented at the 2009 IWA Water Efficiency conference in Sydney by CityWest Water, Sunshine, VIC.Green Point Standard. Build It Green’s GreenPoint Rated Existing Home.Accessed /documentschecklistsJ-3
IRWUS APPENDICESAppendix JInland Empire Utilities Agency. (2016). Integrated Water Resources Plan:Water Supply & Climate Change Impacts 2015-2040.International Living Institute, Living Building Challenge. s, E. T. (2007). Best practices in public administration: how do weknow them? How can we use them? Administratie SI Management Public, 9,73-80.Leadership in Energy and Environmental Design (LEED), (2020). LEED v4.1Residential: Single Family Homes rating system. Accessed from:https://www.usgbc.org/leed/v41?creative 340482139151&keyword leed%20building%20standards&matchtype b&network g&device c&gclid plWzPnweEyxkk8deSetiefx2wFdsaAtsOEALw wcB#residentialLi, D., Engel, R.A., Ma, X., Porse, E., Kaplan, J.D., Margulis, S.A. and D. P.Lettenmaier. (2021).Stay-at-Home Orders during the COVID-19 Pandemic Reduced Urban WaterUse. Environmental Science and Technology Letters. 79Los Angeles Department of Water & Power (LADWP). (2017). WaterConservation Potential Study. Accessed March 2021 fromhttps://www.ladwp.com/waterconservationLos Angeles Department of Water & Power (LADWP). (2021). 2020 UrbanWater Management Plan for the Los Angeles Department of Water& Power.Accessed March 2021 from: Urban Water Management Plan: 2020 DraftMayer, P. Principal and Founder, Water DM., personal communication,January 2021.McCarthy, T., Manager of Water Resources Policy, Water Resources Division,LADWP, personal communication, April 2021.J-4
IRWUS APPENDICESAppendix JMelbourne Water, 2020. Accessed and-educationN.Y. Times. (2016). Australia’s Lesson for a Thirsty California. AccessedSeptember 9,2020 ias-lesson-fora-thirsty-california.htmlPink, B., City of Santa Cruz Water Department, personal communication,September 2, 2020.RESNET, RESNET’s Water Efficiency Rating SystemHERSH2O, accessed from https://www.resnet.us/about/hersh2o/San Francisco Water, Power, Sewer. (2016). 2015 Retail Water ConservationPlan. Accessed documentid 8760State of Victoria. Livable Towns and Cities: Target 155. Accessed November24, 2020:https://www.water.vic.gov.au/liveable
At the household scale, efficient indoor residential water use practices include, but are not limited to, actions such as the installation and maintenance of efficient fixtures and appliances, minimizing leaks, ensuring the efficient distribution of hot water, reusing gray water on-site, and water efficient behaviors (e.g., minimizing shower time).