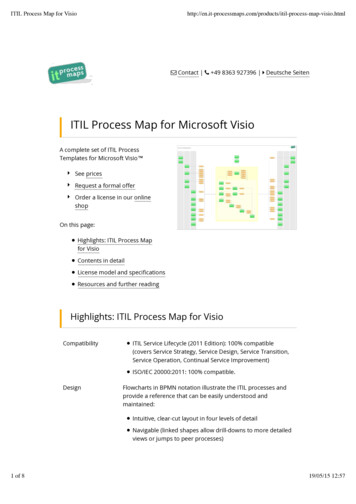
Transcription
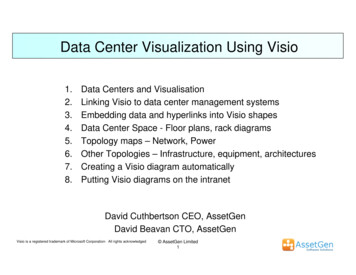
Data Center Visualization Using Visio1.2.3.4.5.6.7.8.Data Centers and VisualisationLinking Visio to data center management systemsEmbedding data and hyperlinks into Visio shapesData Center Space - Floor plans, rack diagramsTopology maps – Network, PowerOther Topologies – Infrastructure, equipment, architecturesCreating a Visio diagram automaticallyPutting Visio diagrams on the intranetDavid Cuthbertson CEO, AssetGenDavid Beavan CTO, AssetGenVisio is a registered trademark of Microsoft Corporation- All rights acknowledged AssetGen Limited1
Data Center Visualization Using VisioUnderstanding a data center is difficult due to the amountof devices and connections crammed into a small space.The best way to explain location, paths, risks and capacityis often with a picture or diagram, so our techniques thatautomate Visio diagram production significantly reducesthe work on data center, operations and project teams.Examples of typical diagrams covering the Data CenterBusiness ProcessesDepartmental, CompanyServicesEnd user, infrastructure, supplierApplicationsPC, server, mainframe, SOA1. Floor plans2. Pathways and cabling routes3. Fixed infrastructure overviews – Cabling and Power4. Rack layouts (front and back)5. Network LAN/SAN/WAN topology diagrams6. Resilience and SPOF (single point of failure) diagrams7. Visual status – hot spots, capacity, ownershipVirtual InfrastructurePCs, Network, Servers, Storage, DBMSHardware InfrastructurePCs, Network, Servers, UPS, Storage, OtherFixed InfrastructureAs with any diagram, a specific view is created to meetthe needs of planners, project teams, operations etc. Visioprovides a wealth of features to enhance diagrams withadditional data as well as publish to intranets. AssetGen Limited2(Cabling, Power, Cabinets, Rooms, Buildings)The focus for Data Center Visualisation
Visio Linking to Data Center ToolsetsHyperlinks back toAssetGen ConnectAssetGen SysMapService Impact AnalysisLinking Visio to theAssetGen system providessymbols and detaileddevice data – automatically.Each shape has hyperlinksadded back to AssetGen for-Service impact analysis-Reporting, audit trails-Connectivity tracingDevice dataautomatically addedto shape by AssetGenAssetGen provides a singlesource of data, Visioprovides the diagrams AssetGen Limited3
Visio 2007 Data Graphics ExampleComputer room cabinet layout showingposition on floor planSame layout with data graphic showingcabinets exceeding rated power limitsand the current equipment power AssetGen Limited4
Data Center Views (1) – Floor PlansAssetGen Planner producescabinet shapes for roomswhich can be overlaid onbackgrounds representing tilelayouts, doorways, cableroutes etc.Hyperlinks back to AssetGenConnect are automaticallyinserted as well as cabinetdata.Existing floor plans can beupdated to preserve layoutsand positioningCabinet function, customer, owner indicated by colour coding AssetGen Limited5
Data Center Views (2) – Rack LayoutsHyperlinks back toAssetGen ConnectAssetGen SysMapService Impact AnalysisDevices positionedautomatically anddata added to shapeby AssetGenVisio rack diagrams are quick and easy to produceso all can understand where equipment is andavailable space. Racks are automatically sized andequipment placed for you.Some of the options- an individual rack, or a selection of racks- a complete room, building or site- by function (server, comms, storage)- by owner (customer, business unit)- show/hide blanking platesFor example - allocate space for a server, producean updated Visio diagram and email it to a colleaguein less than a minute! AssetGen Limited6
Creating a Rack Diagram Automatically2. Give the Visiodiagram a name3. Press DrawFinished!1. Choose a rack,multiple racks, roomsor buildingsOptions to add extradetail to the racksPower, spare switchports etc.Options to selectracks by function,row, owner etc. AssetGen Limited7
Data Center Views (3) – Network TopologyVisio diagrams of network topologyare automated, with embedding ofdevice data, link data andhyperlinks.Some of the options we provide- equipment types- limits for diagram- positioning- connectivity – data, power, or both- templates for consistent viewsLogical connectivity is traced for allconnections, with IP address, VLAN,ports etc. added to link dataBackbone LAN diagram with Unix hosts AssetGen Limited8
Data Center Views (4) – Power TopologyPower topology diagrams areprovided in the same way asnetwork topologiesSimilar options under your control- equipment types- limits for diagram- positioning- templates for consistent viewsIdeal for ensuring that standby andresilience power circuits do not getoverloaded under normal or faultconditions.The same Unix hosts from a power perspective AssetGen Limited9
Creating a Visio Topology Diagram Automatically2. Choose an end limitbased on the cabinet,room, building etc.1. Choose a startpoint – equipment,cabinet, room etc.4. Create a newdiagram or updateand existing one5. Select connectivitytype(s) for topology AssetGen Limited103. Select theequipment types tobe drawn etc.
Data Center Views (5) – Other topologiesThere are many ways to present how IT systems work. It makes sense to reduce theburden on getting the equipment and connectivity data by using a common source suchas AssetGen. All Visio diagrams will have common naming, the same device data andlinks back to the original source. Infrastructure– SAN, LAN, WAN, Power, Cabling, Environment, Cooling, Telecom Combined equipment and infrastructure–––– SPOF (single points of failure). Eg. Servers with LAN, SAN, powerConnectivity infrastructure. Eg. Switch, firewall, router, load balancersZoning. Eg. DMZ, VLANs, test/productionPath diagrams. Eg. End to end paths for power, data, convertorsArchitecture– Groupings. Eg. Domains, addressing, functions, services, DR recovery– Overlays. Eg. Data flows, batch processes, applications AssetGen Limited11
Putting Visio Diagrams on the IntranetSaving a Visio service map as a web page, preserves hyperlinks and embedded data.An easy way to distribute data center knowledge while keeping control.Go to floor plan, racklayout, topology pagesPan and Zoom windowfor control of detailCTRL-CLICK to seeembedded dataSingle CLICK to launchhyperlinks to:AssetGen ConnectService Impact AnalysisEmbedded equipmentdata displayedSearch on equipmentand embedded dataacross multiple pages AssetGen Limited12
Data Center Visualization SummaryWe make it possible to automate the production of Visio diagrams covering the physicaland logical aspects of data centres and infrastructure. Accuracy and understandingare increased with links back to the source data for more detail.To finish with, Visio combined with AssetGen Planner givesa.b.c.d.e.A quick, automated way to produce Visio diagrams without being an expert!An easy method of distributing device data and connectivityConsistency of symbols, content and embedded data across diagramsSavings in staff time in producing and maintaining complex diagramsFaster implementation of change projectsContact us or our resellers for more information on the AssetGen rangeWeb - www.assetgen.com Tel: 44 (0)870 950 4651 - UKTel: 1 (0) 301 947 6714 - USTel: 61 (0) 417 231726- AsiaPac AssetGen Limited13
Data Center Visualization Using Visio 1. Data Centers and Visualisation 2. Linking Visio to data center management systems 3. Embedding data and hyperlinks into Visio shapes 4. Data Center Space - Floor plans, rack diagrams 5. Topology maps - Network, Power 6. Other Topologies - Infrastructure, equipment, architectures 7.