Transcription
2018 IJRAR November 2018, Volume 5, Issue 4www.ijrar.org (E-ISSN 2348-1269, P- ISSN 2349-5138)SIX SIGMA APPLICATION INPOLYURETHANE FOAM INDUSTRY FORDEFECTIVE HEADREST: A CASE STUDYSahib Singh Chadha1, Manish Kumar Tripathi2, Krishan Kant Dwivedi3,Dr. Bikarama Prasad Yadav 41,2,3M.Tech HSEDepartment of Health, Safety and Environmental EngineeringUniversity of Petroleum and Energy StudiesDehradun, India4Associate ProfessorDepartment of Health, Safety and Environmental EngineeringUniversity of Petroleum and Energy StudiesDehradun, IndiaAbstract : This paper follows DMAIC methodology of six sigma to identify and analyze the root causes of the problems abuttedwith defects reduction in foam injection molding process of integral skin foams and to suggest solutions to counter it Thisproblem not only leads to increased turnaround time in terms of remolding but also loss of revenue and dissatisfaction amongclients.Keywords—Six sigma, DMAIC, Reaction injection molding, Cause and Effect diagram,Paretochart.I. INTRODUCTIONThe term “Six Sigma” developed by Motorola and popularized by General Electric is based on a statistical concept where thedefectives are minimized by maintaining 6 standard deviations between the mean of the results procured in the process and itsallowed specification limits. To realize a long lasting solution, the project must flow smoothly through the define, measure,analyze, improve and control (DMAIC) improvement phases. Lean sigma projects or studies are formal examinations guided bylogical learning, not an array of unplanned activities. The possible deviations from the company’s objectives can be easilyidentified even in the case of complex processes as per (Harry 1998). (Murugappan and Keeni 2000) summarized that Six Sigmashould be of paramount importance to every forward-thinking executive and manager determined to make their company worldclass in their industry.The study follows the same approach of Six Sigma to solve the problem. The study has been conducted in Company XYZHaryana which is a leading manufacturer of Polyurethane based products. Firstly the problem statement and process map of thepolymer product was developed. The root causes associated with the defectives were identified using the fishbone diagramsubsequently followed by brainstorming events held with the manager of the organization and workers to formulate pragmaticsolutions.This study performs the root causes analysis of the problem of high number of defectives of headrest and suggestspossible solutions to reduce defectives using six sigma methodology.II.SIX SIGMA HISTORYThe utilization of Six Sigma for enhancing production and elimination of defects can be followed back to the 1920s; be that as itmay, it was not generally utilized as a quality control tool until the late 1980s. Engineers of Motorola were interested inmeasuring defects and tried eliminating them, which led to the built up of Six Sigma as a continual improvement philosophywhich combined various statistical tools into one single package. Around then, Motorola was under the helms of Bob Galvin,Chairman of Motorola Inc. Since Motorola's improvement of Six Sigma, the methods have been generally embraced byorganizations through out the world. General Electric’s CEO Jack Welch adopted Six Sigma’s techniques from Bossidy inAlliedSignal for his business strategy in 1995, which helped to expand the use of the Six Sigma ideology across multifarioussectors.(Eckes 2002)III. REACTION INJECTION MOLDING PROCESSFirstly, the main reaction to create polyurethane is in between diisocyanate and polyol in the presence of catalysts and materialsfor controlling the cell structure –namely, surfactants in the case of foams. Polyurethane can be produced in a lot of densities andhardness by fluctuating the kind of monomer used and adding distinctive substances to change the product traits and attributes,prominently density, or the final mechanical properties. Other additives can be used to upgrade their performance and othercharacteristics of the final product. High-pressure machines are frequently called reaction injection molding, reaction impingedmixing (RIM), or high-pressure impingement mixing (HPIM) machines refers to systems where the component mixing occursthrough impingement of the component streams at high pressure under a mold of given shape and size. (Szycher 2012)IJRAR1904702International Journal of Research and Analytical Reviews (IJRAR) www.ijrar.org10
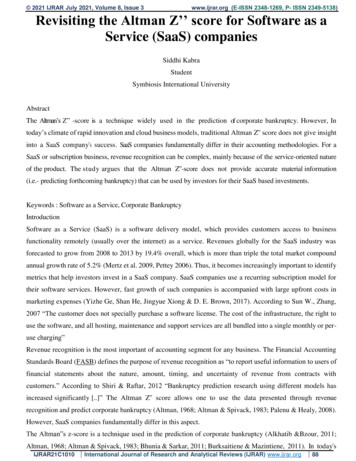
2018 IJRAR November 2018, Volume 5, Issue 4www.ijrar.org (E-ISSN 2348-1269, P- ISSN 2349-5138)IV. METHODOLOGYThis study is based on following processes:Define: The phase outlines the process to be improved. Next the company needs are identified and morphed to Critical to QualityCharacteristics (CTQs) which relate to the needs and wants of the customer. The problem statement is formulated and the projectscope, limitations and goals are developed. (Murugappan and Keeni 2000). A visual representation highlighting the sequence ofsteps involved is also made via reference to a handbook (Pyzdek and Keller 2014).Measure: The phase identifies the types of defects occurring after collecting data from the production department of theorganization inspected, the amount of defectives in rejects needs to be found in this phase.Analyze: The phase involves the development of the Cause & Effect Analysis by brainstorming the problem with the supervisorand workers of the company, and developed a Cause-and-Effect diagram, a tool to identify and state the tentative factors whichnegatively affect stability and spread of critical to quality (CTQ) characteristics. This tool was formulated by Dr. K. Ishikawa andis otherwise called Ishikawa or fishbone diagram.Improve: The phase verifies the relationship of key root causes that affected the variation of the key metrics. Then, aim the keyfactors and develop solutions to improve the process or production toolsIt also includes identifying the acceptable ranges of the paramount variables and transforming the existing process to stay withinappropriate ranges.Control: The phase ensures that all improvements are revised, standardized, documented, and distributed as the new process forthe production department to follow.V. CASE STUDYDefine Phase:The problem statement of our case study is “to reduce rate of defects in PU headrests during winters for Company XYZ”.Orders/Tenders obtained in the season varies the companies production quality as it’s the winter season where they face highnumber of defects tantamount to exuberant losses as a result.Based on the Voice of customer seeks to reduce the major defects namely;a) No. of Voidsb) Poor Surface qualityThe key limitations of the project are:a) The RIM machine parameters are to be kept constant.b) The composition of the reactant mix is not a subject to vulnerability to defects.(Oliver 1999) characterizes loyalty as a profoundly held responsibility to rebuy or reacquaint oneself with a favored productregularly with the passage of time. Customer loyalty is the desire to continue to be associated with the same company. So thecompany is primarily concerned about the workability and correctness of the cast products, the purpose is to reduce the repairingjob or waiting in the job-site, and keep the operation of part production smooth.Therefore CTQ’s of the case study are to:a) Improve Surface Quality of the products made in the winter season.b) Reduce Moisture Regain below 25% without jeopardizing the mechanical integrity of the final cast. For this decreasing .Next the process map is developed (as shown in Fig.1) to show the sequence of steps in order to identify the flaws in the processwhich can be targeted to solve the problem with a better approach.IJRAR1904702International Journal of Research and Analytical Reviews (IJRAR) www.ijrar.org11
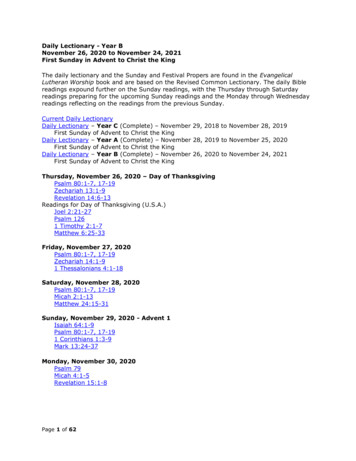
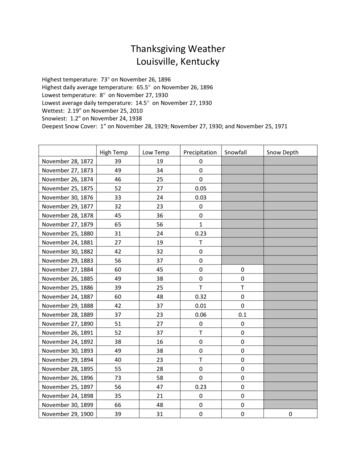
2018 IJRAR November 2018, Volume 5, Issue 4www.ijrar.org (E-ISSN 2348-1269, P- ISSN 2349-5138)Measure Phase:Measure phase is an attempt used to make an overview ofpotential X’s that has potentially impacted process CTQ’s.On through analysis of monthly reports of logisticsdepartment, data of past tender is used. Based on theideology of an economist of Italian origin Vilfredo Pareto,stated that 20% of causes determine 80% of problems(Eckes 2003). A Pareto chart is devised to point out themost frequently occurring defects over the previous tenderAnalyze Phase:batch. The graph clearly states that by giving due priority tolarge voids; loose skin & Sink/Shrink marks can reduceoverall defects by about 70%. If major resources aredeployed on targeting just these three defects, then this willimply that 70% of the losses incurred in terms of remoldingpart and additional labor hours also hold a possibility ofgetting reduced substantially.IJRAR1904702International Journal of Research and Analytical Reviews (IJRAR) www.ijrar.org12
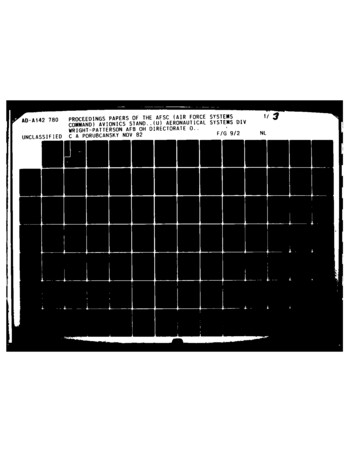
2018 IJRAR November 2018, Volume 5, Issue 4www.ijrar.org (E-ISSN 2348-1269, P- ISSN 2349-5138)A cause and effect diagram also called as the Ishikawa or fishbone diagram is a visual representation that shows preciseconnection between an outcome or a side effect and its conceivable causes. (Koripadu and Subbaiah 2014) used it in theirresearch to perform a gap analysis in the IT industry.The possible causes of each defect were summarized by brainstorming with the head and operators. The major causes of the twodefects could be categorized systematically as:Type of voids:1. Large voids 2. Small voids/Blow holesPoor Surface Quality due to:1. Streaking2. BlisteringRoot CauseEffects & ExplanationProposed SolutionInsufficientMixingEven without pigment, the A and B components aregenerally different colors, or different shades of the samecolor. On the off chance if these two parts are not totallycombined, bits of uncured material will stay in theelastomer which would lead to poor physical properties.Inadequate mixing of fillers and pigments could causestreaks in the final part.SplashingConsiderable splashing while pouring the mix couldintroduce bubbles the final part. This is especially anissue with low-viscosity systems where splashing is morepronounced. Its mainly because of: 1.Clogged hopper2.Unclean Sprue/mold channelIncompatibleMold Temp.Low Mold temp: A mold that is too cold will cause partskin to form beforehand causing the air and gasesentrapment and forming blisters, blow holes, voids andsink/shrink marks.High Mold Temp: A mold that is too hot does not allowthat skin to form in time and the final part has a soft skin.Release AgentIssuesUsing either excessive or inadequate release agent for themold could lead to improper surface characteristics of thefinal part. Too much of mold release could lead to voidsand too less could cause the part to stick to the mold.MoistureContaminationMoisture will react with the isocyanate in a polymer toform CO2 gas whose bubbles will manifest themselves inthe part. Moisture can come from many sources and willform pockets of trapped gas that may show up as blisters,bubbles, streaks in the molded part.Improper FlowrateFlow rate affects the pot life of the material; a short potlife will not allow the air to ventilate out the mold.1. Increase mix time by 15-20 minutes.2. Promote efficient mixing, use the type of blades thatprevent air enclosure.1. Purge the hopper and sprue/mold channel properly afterconsecutive operations.2. Tilting the mold whilst the filling operation shall allowentrapped air or gases to escape more easily.1. Mold should be evenly heated from both the sides for betteraesthetic appeal. Advisable mold temperature should be 35-420c.2. Labor is inadvertent to manual heating of the upper mold;installation of a heater for the position is a must.1. Don’t use water based Mold release as it may causebubbles in the surface or dry it before use.2. Avery hot mold diminishes the effect of the mold release.Maintain control of mold temp first.3. More release agent must be sprayed if part’s loose skinprevails or cut back the amount if voids are seen.1. Using a heat gun or hairdryer for a few seconds beforeputting the lid on can be an effective alternative.2. Do not keep the lids of raw material open too long sinceisocyanate and polyol are hygroscopic.3. Store all products under dry nitrogen if possible.1. Increasing flow rate for a longer pot life of material.2. Use lower viscosity polyurethane.3. Increase Temp of mix.1. Eliminate air traps by thorough cleaning of all the vents.All eight vents in our case.2. Before unclamping mold vents can be cleaned to save timeand energy.PoorHousekeepingThe housekeeping staff may inadvertently sweep dust intothe chemicals thereby contaminating raw material.1. The labor may not understand the importance ofmaintaining consistent cycles, so instruct them.2. Mold should be opened 2-3 minutes later than usual.1, Daily 10 minutes session of work area cleaning prior tomolding/mixing2. Removing unnecessary obstructions in movements forsmooth workflow.1. Venting is good but excessive venting is bad. Verify Molddesign.2. Hopper must be properly placed to avoid spillage.1. Daily reporting of defects by the operator.2. Accountability and incentives at the lower level to motivateworkers.Leaking MoldIf some of the material poured into the mold leaks out viavents, voids will form at the non-contact areas. Leaking ismore likely to occur in systems with a long pot life andlow viscosity.1. Remolding and repainting should be given at least a day ortwo to settle.2. Incorporate experienced operator for quality inspectionduring the packing phase.Lack ofVentingShort CycleTime:OtherProblems:1. Lack ofsupervisionExcess internal pressure may develop due to unvented airtraps which can cause a short shot or voids via airentrapment.Opening the mold before the skin forms on the final partresulting in the formation of trapped gases therebyforming sink marks and looseness on the surface of thepart.Intentional damage by labor leading to defective pieces.IJRAR1904702International Journal of Research and Analytical Reviews (IJRAR) www.ijrar.org13
2018 IJRAR November 2018, Volume 5, Issue 42.Lack ofqualityinspectionwww.ijrar.org (E-ISSN 2348-1269, P- ISSN 2349-5138)Packed batch ready for the delivery was found of manydefects discussed in the Cause and effect diagram andreqd. repainting too.3. Sink/Shrink marks4. Loose skinThe diagram below makes the root causes clear and puts us in proximity towards the improvement phase.Improve Phase:The root cause analysis formed a root basis for formulation of pragmatic solutions deliberately with the company head whichare easy to implement with least cost addition, shown in Table 1 in the subsequent page. Made with reference to a website cited[12] and a research conducted by(Chongwatpol 2006) in a plastic manufacturing company and my knowledge with the subject ofpolymer science.Control Phase:The control phase as mentioned earlier is very important for the sustenance of the improvements recommended and givespermanence to the solutions discovered. This also completes the handover of the project to the regular process owners who wouldimplement the solutions and ripe the benefits of the study which forms a base of common understanding and knowledge inapplication.(Bhanpurkar, Bangar et al. 2012)VI. CONCLUSIONNowadays competition is very high & also increasing day by day. Thus to survive in the market the quality of the product mustbe high standard with minimum cost which is the reason why this case study is conducted, to identify and analyze the root causesof the problem of defective PU headrests and suggest pragmatic solutions to reduce these damages which lead to customerdissatisfaction. In order to identify areas for improvement, a process map was documented. Pareto charts and the fishbonediagram identified defects and root causes which helped the management to concentrate on major defects. Accordingly, abrainstorming session with the manager and workers was done which enabled successful formulation of the suggested solutions ofall the root causes by analyzing the entire RIM process map. This study is one of the first attempts to highlight the importance ofthe defects of flexible integral foams by six sigma methodology. Academics and practitioner could use this study further forconducting research in this field of polymer technology.VII. ACKNOWLEDGEMENTS[1] Bhanpurkar, A., et al. (2012). "Implementation of Six Sigma Program for Lean Manufacturing to reduce the rework waste intransformer manufacturing unit by eliminating defect of leakage from bushings in oil filled transformers." InternationalJournal of Mechanical and Industrial Engineering 1(3): 6-11.[2] Chongwatpol, N. (2006). "Implementing Continuous Process Improvement Methods in a Mid-Size Plastic Company." AResearch paper submitted in partial Fulfillment of the requirements for the Master of Science Degree in Management ofTechnology.[3] Eckes, G. (2002). The Six Sigma revolution: How General Electric and others turned process into profits, John Wiley &Sons.[4] Eckes, G. (2003). Six Sigma for everyone, John Wiley & Sons.IJRAR1904702International Journal of Research and Analytical Reviews (IJRAR) www.ijrar.org14
2018 IJRAR November 2018, Volume 5, Issue 4www.ijrar.org (E-ISSN 2348-1269, P- ISSN 2349-5138)[5] Harry, M. J. (1998). "Six Sigma: a breakthrough strategy for profitability." Quality progress 31(5): 60.[6] Koripadu, M. and K. V. Subbaiah (2014). "Problem solving management using Six Sigma tools & techniques." InternationalJournal of Scientific and Technology Research 3(2): 91-93.[7] Murugappan, M. and G. Keeni (2000). Quality improvement-the Six Sigma way. apaqs, IEEE.[8] Oliver, R. L. (1999). "Whence consumer loyalty?" the Journal of Marketing: 33-44.[9] Pyzdek, T. and P. A. Keller (2014). The six sigma handbook, McGraw-Hill Education New York, NY.[10] Szycher, M. (2012). Szycher's handbook of polyurethanes, CRC press.[11] onal Journal of Research and Analytical Reviews (IJRAR) www.ijrar.org15
Keywords—Six sigma, DMAIC, Reaction injection molding, Cause and Effect diagram, Pareto chart. _ I. INTRODUCTION The term "Six Sigma" developed by Motorola and popularized by General Electric is based on a statistical concept where the defectives are minimized by maintaining 6 standard deviations between the mean of the results .